Energy
Visualizing the Scale of Global Fossil Fuel Production
![]() Subscribe to the Elements free mailing list for more like this
Subscribe to the Elements free mailing list for more like this


The Scale of Global Fossil Fuel Production
This was originally posted on Elements. Sign up to the free mailing list to get beautiful visualizations on natural resource megatrends in your email every week.
Fossil fuels have been our predominant source of energy for over a century, and the world still extracts and consumes a colossal amount of coal, oil, and gas every year.
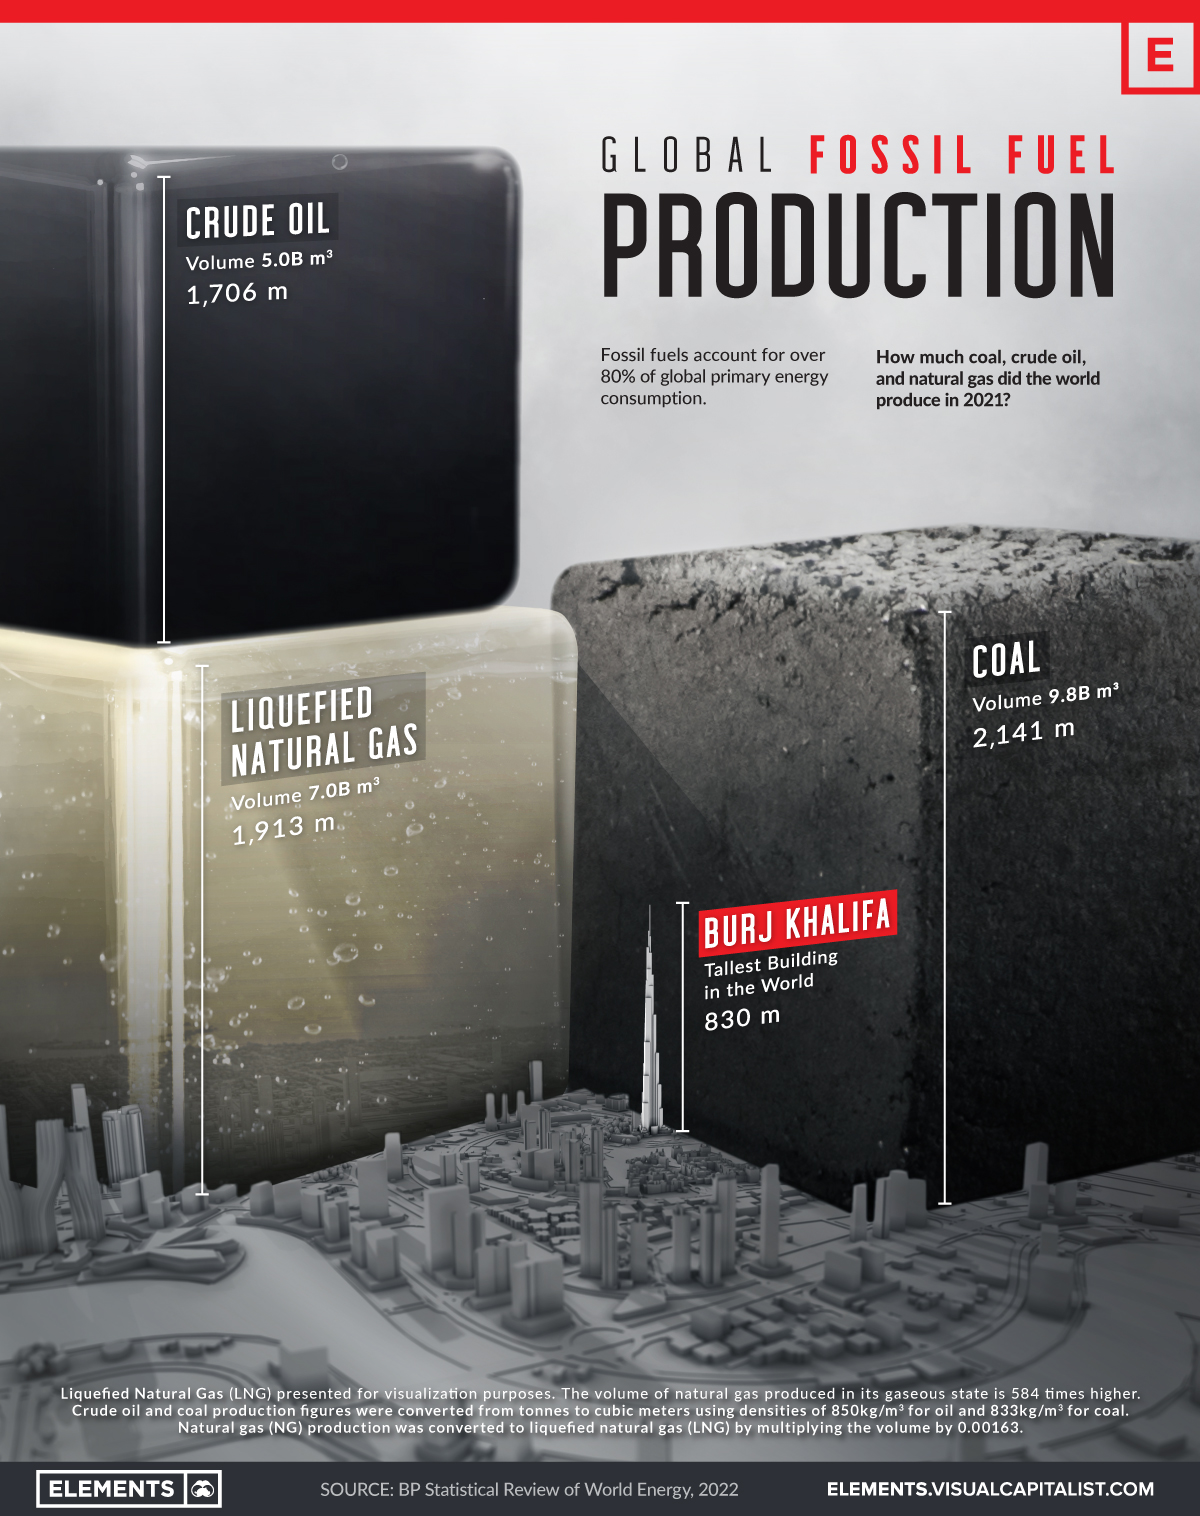
This infographic visualizes the volume of global fossil fuel production in 2021 using data from BP’s Statistical Review of World Energy.
The Facts on Fossil Fuels
In 2021, the world produced around 8 billion tonnes of coal, 4 billion tonnes of oil, and over 4 trillion cubic meters of natural gas.
Most of the coal is used to generate electricity for our homes and offices and has a key role in steel production. Similarly, natural gas is a large source of electricity and heat for industries and buildings. Oil is primarily used by the transportation sector, in addition to petrochemical manufacturing, heating, and other end uses.
Here’s a full breakdown of coal, oil, and gas production by country in 2021.
Coal Production
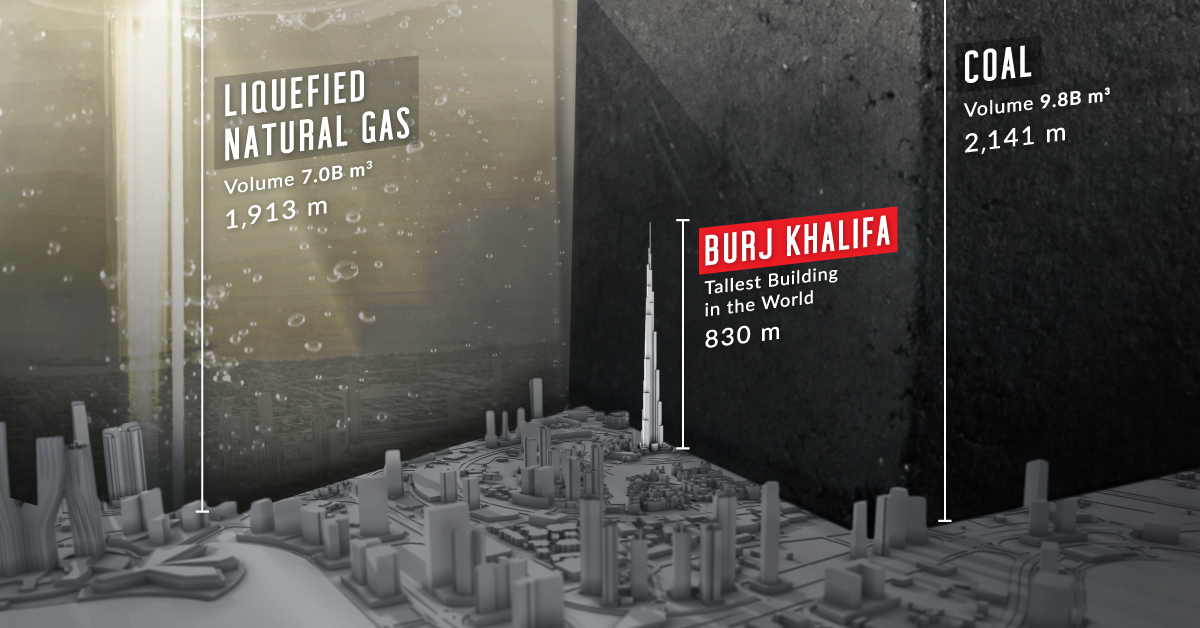
If all the coal produced in 2021 were arranged in a cube, it would measure 2,141 meters (2.1km) on each side—more than 2.5 times the height of the world’s tallest building.
China produced 50% or more than four billion tonnes of the world’s coal in 2021. It’s also the largest consumer of coal, accounting for 54% of coal consumption in 2021.
| Rank | Country | 2021 Coal Production (million tonnes) | % of Total |
|---|---|---|---|
| #1 | 🇨🇳 China | 4,126.0 | 50% |
| #2 | 🇮🇳 India | 811.3 | 10% |
| #3 | 🇮🇩 Indonesia | 614.0 | 8% |
| #4 | 🇺🇸 U.S. | 524.4 | 6% |
| #5 | 🇦🇺 Australia | 478.6 | 6% |
| #6 | 🇷🇺 Russia | 433.7 | 5% |
| #7 | 🇿🇦 South Africa | 234.5 | 3% |
| #8 | 🇩🇪 Germany | 126.0 | 2% |
| #9 | 🇰🇿 Kazakhstan | 115.7 | 1% |
| #10 | 🇵🇱 Poland | 107.6 | 1% |
| 🌍 Other | 600.9 | 7% | |
| Total | 8,172.6 | 100% |
India is both the second largest producer and consumer of coal. Meanwhile, Indonesia is the world’s largest coal exporter, followed by Australia.
In the West, U.S. coal production was down 47% as compared to 2011 levels, and the descent is likely to continue with the clean energy transition.
Oil Production
In 2021, the United States, Russia, and Saudi Arabia were the three largest crude oil producers, respectively.
| Rank | Country | 2021 Oil Production (million tonnes) | % of Total |
|---|---|---|---|
| #1 | 🇺🇸 U.S. | 711.1 | 17% |
| #2 | 🇷🇺 Russia | 536.4 | 13% |
| #3 | 🇸🇦 Saudi Arabia | 515.0 | 12% |
| #4 | 🇨🇦 Canada | 267.1 | 6% |
| #5 | 🇮🇶 Iraq | 200.8 | 5% |
| #6 | 🇨🇳 China | 198.9 | 5% |
| #7 | 🇮🇷 Iran | 167.7 | 4% |
| #8 | 🇦🇪 UAE | 164.4 | 4% |
| #9 | 🇧🇷 Brazil | 156.8 | 4% |
| #10 | 🇰🇼 Kuwait | 131.1 | 3% |
| 🌍 Other | 1172.0 | 28% | |
| Total | 4221.4 | 100% |
OPEC countries, including Saudi Arabia, made up the largest share of production at 35% or 1.5 billion tonnes of oil.
U.S. oil production has seen significant growth since 2010. In 2021, the U.S. extracted 711 million tonnes of oil, more than double the 333 million tonnes produced in 2010.
Natural Gas Production
The world produced 4,036 billion cubic meters of natural gas in 2021. The above graphic converts that into an equivalent of seven billion cubic meters of liquefied natural gas (LNG) to visualize it on the same scale as oil and gas.
Here are the top 10 producers of natural gas in 2021:
| Rank | Country | 2021 Natural Gas Production (billion m3) | % of Total |
|---|---|---|---|
| #1 | 🇺🇸 U.S. | 934.2 | 23% |
| #2 | 🇷🇺 Russia | 701.7 | 17% |
| #3 | 🇮🇷 Iran | 256.7 | 6% |
| #4 | 🇨🇳 China | 209.2 | 5% |
| #5 | 🇶🇦 Qatar | 177.0 | 4% |
| #6 | 🇨🇦 Canada | 172.3 | 4% |
| #7 | 🇦🇺 Australia | 147.2 | 4% |
| #8 | 🇸🇦 Saudi Arabia | 117.3 | 3% |
| #9 | 🇳🇴 Norway | 114.3 | 3% |
| #10 | 🇩🇿 Algeria | 100.8 | 2% |
| 🌍 Other | 1106.3 | 27% | |
| Total | 4,036.9 | 100% |
The U.S. was the largest producer, with Texas and Pennsylvania accounting for 47% of its gas production. The U.S. electric power and industrial sectors account for around one-third of domestic natural gas consumption.
Russia, the next-largest producer, was the biggest exporter of gas in 2021. It exported an estimated 210 billion cubic meters of natural gas via pipelines to Europe and China. Around 80% of Russian natural gas comes from operations in the Arctic region.


Energy
Charted: 4 Reasons Why Lithium Could Be the Next Gold Rush
Visual Capitalist has partnered with EnergyX to show why drops in prices and growing demand may make now the right time to invest in lithium.


4 Reasons Why You Should Invest in Lithium
Lithium’s importance in powering EVs makes it a linchpin of the clean energy transition and one of the world’s most precious minerals.
In this graphic, Visual Capitalist partnered with EnergyX to explore why now may be the time to invest in lithium.
1. Lithium Prices Have Dropped
One of the most critical aspects of evaluating an investment is ensuring that the asset’s value is higher than its price would indicate. Lithium is integral to powering EVs, and, prices have fallen fast over the last year:
| Date | LiOH·H₂O* | Li₂CO₃** |
|---|---|---|
| Feb 2023 | $76 | $71 |
| March 2023 | $71 | $61 |
| Apr 2023 | $43 | $33 |
| May 2023 | $43 | $33 |
| June 2023 | $47 | $45 |
| July 2023 | $44 | $40 |
| Aug 2023 | $35 | $35 |
| Sept 2023 | $28 | $27 |
| Oct 2023 | $24 | $23 |
| Nov 2023 | $21 | $21 |
| Dec 2023 | $17 | $16 |
| Jan 2024 | $14 | $15 |
| Feb 2024 | $13 | $14 |
Note: Monthly spot prices were taken as close to the 14th of each month as possible.
*Lithium hydroxide monohydrate MB-LI-0033
**Lithium carbonate MB-LI-0029
2. Lithium-Ion Battery Prices Are Also Falling
The drop in lithium prices is just one reason to invest in the metal. Increasing economies of scale, coupled with low commodity prices, have caused the cost of lithium-ion batteries to drop significantly as well.
In fact, BNEF reports that between 2013 and 2023, the price of a Li-ion battery dropped by 82%.
| Year | Price per KWh |
|---|---|
| 2023 | $139 |
| 2022 | $161 |
| 2021 | $150 |
| 2020 | $160 |
| 2019 | $183 |
| 2018 | $211 |
| 2017 | $258 |
| 2016 | $345 |
| 2015 | $448 |
| 2014 | $692 |
| 2013 | $780 |

3. EV Adoption is Sustainable
One of the best reasons to invest in lithium is that EVs, one of the main drivers behind the demand for lithium, have reached a price point similar to that of traditional vehicle.
According to the Kelly Blue Book, Tesla’s average transaction price dropped by 25% between 2022 and 2023, bringing it in line with many other major manufacturers and showing that EVs are a realistic transport option from a consumer price perspective.
| Manufacturer | September 2022 | September 2023 |
|---|---|---|
| BMW | $69,000 | $72,000 |
| Ford | $54,000 | $56,000 |
| Volkswagon | $54,000 | $56,000 |
| General Motors | $52,000 | $53,000 |
| Tesla | $68,000 | $51,000 |
4. Electricity Demand in Transport is Growing
As EVs become an accessible transport option, there’s an investment opportunity in lithium. But possibly the best reason to invest in lithium is that the IEA reports global demand for the electricity in transport could grow dramatically by 2030:
| Transport Type | 2022 | 2025 | 2030 |
|---|---|---|---|
| Buses 🚌 | 23,000 GWh | 50,000 GWh | 130,000 GWh |
| Cars 🚙 | 65,000 GWh | 200,000 GWh | 570,000 GWh |
| Trucks 🛻 | 4,000 GWh | 15,000 GWh | 94,000 GWh |
| Vans 🚐 | 6,000 GWh | 16,000 GWh | 72,000 GWh |
The Lithium Investment Opportunity
Lithium presents a potentially classic investment opportunity. Lithium and battery prices have dropped significantly, and recently, EVs have reached a price point similar to other vehicles. By 2030, the demand for clean energy, especially in transport, will grow dramatically.
With prices dropping and demand skyrocketing, now is the time to invest in lithium.
EnergyX is poised to exploit lithium demand with cutting-edge lithium extraction technology capable of extracting 300% more lithium than current processes.

-

 Lithium3 days ago
Ranked: The Top 10 EV Battery Manufacturers in 2023
Asia dominates this ranking of the world’s largest EV battery manufacturers in 2023.
-

 Energy1 week ago
The World’s Biggest Nuclear Energy Producers
China has grown its nuclear capacity over the last decade, now ranking second on the list of top nuclear energy producers.
-

 Energy4 weeks ago
The World’s Biggest Oil Producers in 2023
Just three countries accounted for 40% of global oil production last year.
-

 Energy1 month ago
How Much Does the U.S. Depend on Russian Uranium?
Currently, Russia is the largest foreign supplier of nuclear power fuel to the U.S.
-

 Uranium2 months ago
Charted: Global Uranium Reserves, by Country
We visualize the distribution of the world’s uranium reserves by country, with 3 countries accounting for more than half of total reserves.
-

 Energy3 months ago
Visualizing the Rise of the U.S. as Top Crude Oil Producer
Over the last decade, the United States has established itself as the world’s top producer of crude oil, surpassing Saudi Arabia and Russia.

-

 Mining1 week ago
Gold vs. S&P 500: Which Has Grown More Over Five Years?
-

 Markets2 weeks ago
Ranked: The Most Valuable Housing Markets in America
-

 Money2 weeks ago
Which States Have the Highest Minimum Wage in America?
-

 AI2 weeks ago
Ranked: Semiconductor Companies by Industry Revenue Share
-

 Markets2 weeks ago
Ranked: The World’s Top Flight Routes, by Revenue
-

 Countries2 weeks ago
Population Projections: The World’s 6 Largest Countries in 2075
-

 Markets2 weeks ago
The Top 10 States by Real GDP Growth in 2023
-

 Demographics2 weeks ago
The Smallest Gender Wage Gaps in OECD Countries