Energy
Visualizing the Range of Electric Cars vs. Gas-Powered Cars
![]() Subscribe to the Elements free mailing list for more like this
Subscribe to the Elements free mailing list for more like this

The Range of Electric Cars vs. Gas-Powered Cars
This was originally posted on Elements. Sign up to the free mailing list to get beautiful visualizations on natural resource megatrends in your email every week.
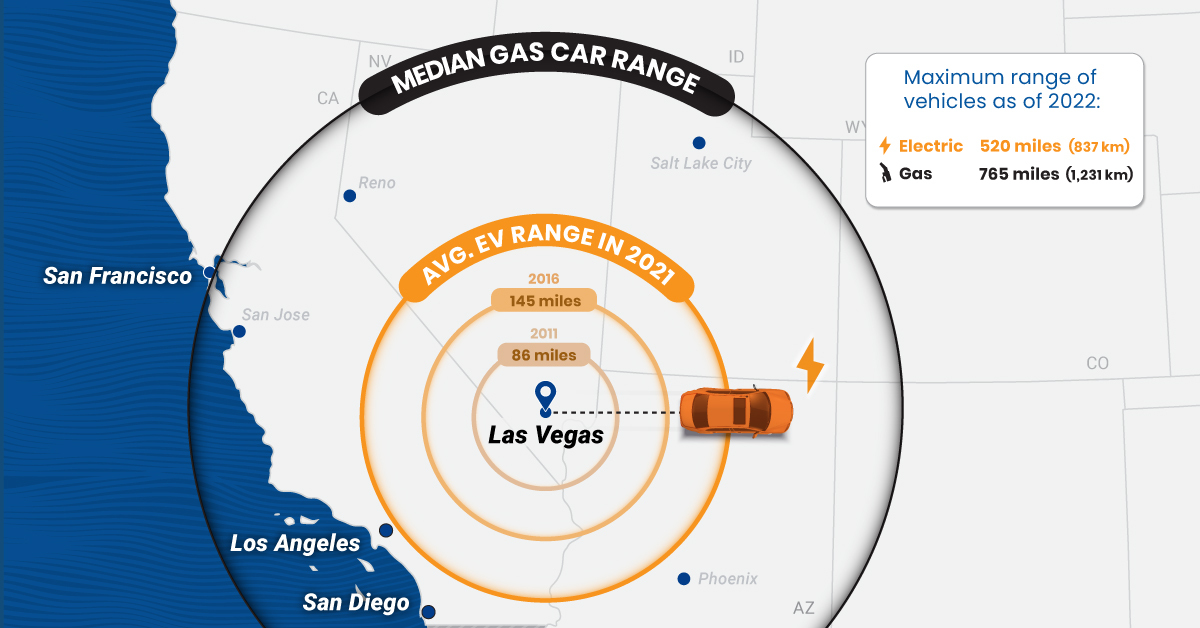
EV adoption has grown rapidly in recent years, but many prospective buyers still have doubts about electric car ranges.
In fact, 33% of new car buyers chose range anxiety—the concern about how far an EV can drive on a full charge—as their top inhibitor to purchasing electric cars in a survey conducted by EY.
So, how far can the average electric car go on one charge, and how does that compare with the typical range of gas-powered cars?
The Rise in EV Ranges
Thanks to improvements in battery technology, the average range of electric cars has more than doubled over the last decade, according to data from the International Energy Agency (IEA).
| Year | Avg. EV Range | Maximum EV Range |
|---|---|---|
| 2010 | 79 miles (127 km) | N/A |
| 2011 | 86 miles (138 km) | 94 miles (151 km) |
| 2012 | 99 miles (159 km) | 265 miles (426 km) |
| 2013 | 117 miles (188 km) | 265 miles (426 km) |
| 2014 | 130 miles (209 km) | 265 miles (426 km) |
| 2015 | 131 miles (211 km) | 270 miles (435 km) |
| 2016 | 145 miles (233 km) | 315 miles (507 km) |
| 2017 | 151 miles (243 km) | 335 miles (539 km) |
| 2018 | 189 miles (304 km) | 335 miles (539 km) |
| 2019 | 209 miles (336 km) | 370 miles (595 km) |
| 2020 | 210 miles (338 km) | 402 miles (647 km) |
| 2021 | 217 miles (349 km) | 520 miles* (837 km) |
*Max range for EVs offered in the United States.
Source: IEA, U.S. DOE
As of 2021, the average battery-powered EV could travel 217 miles (349 km) on a single charge. It represents a 44% increase from 151 miles (243 km) in 2017 and a 152% increase relative to a decade ago.
Despite the steady growth, EVs still fall short when compared to gas-powered cars. For example, in 2021, the median gas car range (on one full tank) in the U.S. was around 413 miles (664 km)—nearly double what the average EV would cover.
As automakers roll out new models, electric car ranges are likely to continue increasing and could soon match those of their gas-powered counterparts. It’s important to note that EV ranges can change depending on external conditions.
What Affects EV Ranges?
In theory, EV ranges depend on battery capacity and motor efficiency, but real-world results can vary based on several factors:
- Weather: At temperatures below 20℉ (-6.7℃), EVs can lose around 12% of their range, rising to 41% if heating is turned on inside the vehicle.
- Operating Conditions: Thanks to regenerative braking, EVs may extend their maximum range during city driving.
- Speed: When driving at high speeds, EV motors spin faster at a less efficient rate. This may result in range loss.
On the contrary, when driven at optimal temperatures of about 70℉ (21.5℃), EVs can exceed their rated range, according to an analysis by Geotab.
The 10 Longest-Range Electric Cars in America
Here are the 10 longest-range electric cars available in the U.S. as of 2022, based on Environmental Protection Agency (EPA) range estimates:
| Car | Range On One Full Charge | Estimated Base Price |
|---|---|---|
| Lucid Air | 520 miles (837 km) | $170,500 |
| Tesla Model S | 405 miles (652 km) | $106,190 |
| Tesla Model 3 | 358 miles (576 km) | $59,440 |
| Mercedes EQS | 350 miles (563 km) | $103,360 |
| Tesla Model X | 348 miles (560 km) | $122,440 |
| Tesla Model Y | 330 miles (531 km) | $67,440 |
| Hummer EV | 329 miles (529 km) | $110,295 |
| BMW iX | 324 miles (521 km) | $84,195 |
| Ford F-150 Lightning | 320 miles (515 km) | $74,169 |
| Rivian R1S | 316 miles (509 km) | $70,000 |
Source: Car and Driver
The top-spec Lucid Air offers the highest range of any EV with a price tag of $170,500, followed by the Tesla Model S. But the Tesla Model 3 offers the most bang for your buck if range and price are the only two factors in consideration.


Energy
The World’s Biggest Nuclear Energy Producers
China has grown its nuclear capacity over the last decade, now ranking second on the list of top nuclear energy producers.


The World’s Biggest Nuclear Energy Producers
This was originally posted on our Voronoi app. Download the app for free on Apple or Android and discover incredible data-driven charts from a variety of trusted sources.
Scientists in South Korea recently broke a record in a nuclear fusion experiment. For 48 seconds, they sustained a temperature seven times that of the sun’s core.
But generating commercially viable energy from nuclear fusion still remains more science fiction than reality. Meanwhile, its more reliable sibling, nuclear fission, has been powering our world for many decades.
In this graphic, we visualized the top producers of nuclear energy by their share of the global total, measured in terawatt hours (TWh). Data for this was sourced from the Nuclear Energy Institute, last updated in August 2022.
Which Country Generates the Most Nuclear Energy?
Nuclear energy production in the U.S. is more than twice the amount produced by China (ranked second) and France (ranked third) put together. In total, the U.S. accounts for nearly 30% of global nuclear energy output.
However, nuclear power only accounts for one-fifth of America’s electricity supply. This is in contrast to France, which generates 60% of its electricity from nuclear plants.
| Rank | Country | Nuclear Energy Produced (TWh) | % of Total |
|---|---|---|---|
| 1 | 🇺🇸 U.S. | 772 | 29% |
| 2 | 🇨🇳 China | 383 | 14% |
| 3 | 🇫🇷 France | 363 | 14% |
| 4 | 🇷🇺 Russia | 208 | 8% |
| 5 | 🇰🇷 South Korea | 150 | 6% |
| 6 | 🇨🇦 Canada | 87 | 3% |
| 7 | 🇺🇦 Ukraine | 81 | 3% |
| 8 | 🇩🇪 Germany | 65 | 2% |
| 9 | 🇯🇵 Japan | 61 | 2% |
| 10 | 🇪🇸 Spain | 54 | 2% |
| 11 | 🇸🇪 Sweden | 51 | 2% |
| 12 | 🇧🇪 Belgium | 48 | 2% |
| 13 | 🇬🇧 UK | 42 | 2% |
| 14 | 🇮🇳 India | 40 | 2% |
| 15 | 🇨🇿 Czech Republic | 29 | 1% |
| N/A | 🌐 Other | 219 | 8% |
| N/A | 🌍 Total | 2,653 | 100% |
Another highlight is how China has rapidly grown its nuclear energy capabilities in the last decade. Between 2016 and 2021, for example, it increased its share of global nuclear energy output from less than 10% to more than 14%, overtaking France for second place.
On the opposite end, the UK’s share has slipped to 2% over the same time period.
Meanwhile, Ukraine has heavily relied on nuclear energy to power its grid. In March 2022, it lost access to its key Zaporizhzhia Nuclear Power Station after Russian forces wrested control of the facility. With six 1,000 MW reactors, the plant is one of the largest in Europe. It is currently not producing any power, and has been the site of recent drone attacks.

-

 Markets2 weeks ago
Visualizing America’s Shortage of Affordable Homes
-

 Technology1 week ago
Ranked: Semiconductor Companies by Industry Revenue Share
-

 Money1 week ago
Which States Have the Highest Minimum Wage in America?
-

 Real Estate1 week ago
Ranked: The Most Valuable Housing Markets in America
-

 Business2 weeks ago
Charted: Big Four Market Share by S&P 500 Audits
-

 AI2 weeks ago
The Stock Performance of U.S. Chipmakers So Far in 2024
-

 Misc2 weeks ago
Almost Every EV Stock is Down After Q1 2024
-

 Money2 weeks ago
Where Does One U.S. Tax Dollar Go?