Energy
Visualizing the Range of Electric Cars vs. Gas-Powered Cars
![]() Subscribe to the Elements free mailing list for more like this
Subscribe to the Elements free mailing list for more like this

The Range of Electric Cars vs. Gas-Powered Cars
This was originally posted on Elements. Sign up to the free mailing list to get beautiful visualizations on natural resource megatrends in your email every week.
EV adoption has grown rapidly in recent years, but many prospective buyers still have doubts about electric car ranges.
In fact, 33% of new car buyers chose range anxiety—the concern about how far an EV can drive on a full charge—as their top inhibitor to purchasing electric cars in a survey conducted by EY.
So, how far can the average electric car go on one charge, and how does that compare with the typical range of gas-powered cars?
The Rise in EV Ranges
Thanks to improvements in battery technology, the average range of electric cars has more than doubled over the last decade, according to data from the International Energy Agency (IEA).
| Year | Avg. EV Range | Maximum EV Range |
|---|---|---|
| 2010 | 79 miles (127 km) | N/A |
| 2011 | 86 miles (138 km) | 94 miles (151 km) |
| 2012 | 99 miles (159 km) | 265 miles (426 km) |
| 2013 | 117 miles (188 km) | 265 miles (426 km) |
| 2014 | 130 miles (209 km) | 265 miles (426 km) |
| 2015 | 131 miles (211 km) | 270 miles (435 km) |
| 2016 | 145 miles (233 km) | 315 miles (507 km) |
| 2017 | 151 miles (243 km) | 335 miles (539 km) |
| 2018 | 189 miles (304 km) | 335 miles (539 km) |
| 2019 | 209 miles (336 km) | 370 miles (595 km) |
| 2020 | 210 miles (338 km) | 402 miles (647 km) |
| 2021 | 217 miles (349 km) | 520 miles* (837 km) |
*Max range for EVs offered in the United States.
Source: IEA, U.S. DOE
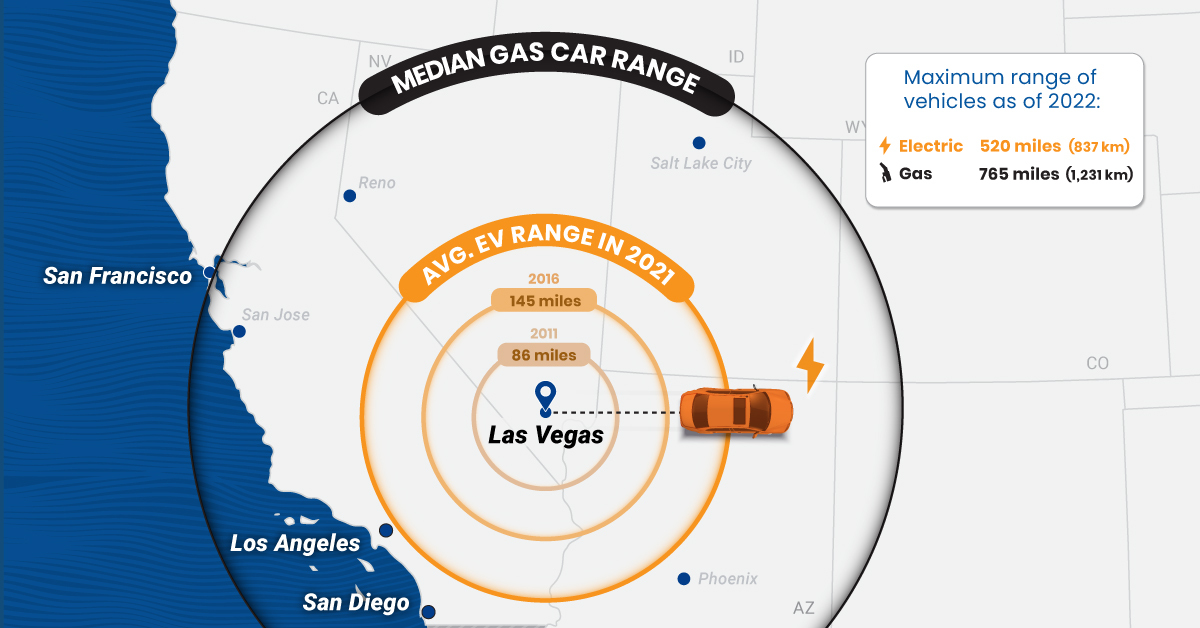
As of 2021, the average battery-powered EV could travel 217 miles (349 km) on a single charge. It represents a 44% increase from 151 miles (243 km) in 2017 and a 152% increase relative to a decade ago.
Despite the steady growth, EVs still fall short when compared to gas-powered cars. For example, in 2021, the median gas car range (on one full tank) in the U.S. was around 413 miles (664 km)—nearly double what the average EV would cover.
As automakers roll out new models, electric car ranges are likely to continue increasing and could soon match those of their gas-powered counterparts. It’s important to note that EV ranges can change depending on external conditions.
What Affects EV Ranges?
In theory, EV ranges depend on battery capacity and motor efficiency, but real-world results can vary based on several factors:
- Weather: At temperatures below 20℉ (-6.7℃), EVs can lose around 12% of their range, rising to 41% if heating is turned on inside the vehicle.
- Operating Conditions: Thanks to regenerative braking, EVs may extend their maximum range during city driving.
- Speed: When driving at high speeds, EV motors spin faster at a less efficient rate. This may result in range loss.
On the contrary, when driven at optimal temperatures of about 70℉ (21.5℃), EVs can exceed their rated range, according to an analysis by Geotab.
The 10 Longest-Range Electric Cars in America
Here are the 10 longest-range electric cars available in the U.S. as of 2022, based on Environmental Protection Agency (EPA) range estimates:
| Car | Range On One Full Charge | Estimated Base Price |
|---|---|---|
| Lucid Air | 520 miles (837 km) | $170,500 |
| Tesla Model S | 405 miles (652 km) | $106,190 |
| Tesla Model 3 | 358 miles (576 km) | $59,440 |
| Mercedes EQS | 350 miles (563 km) | $103,360 |
| Tesla Model X | 348 miles (560 km) | $122,440 |
| Tesla Model Y | 330 miles (531 km) | $67,440 |
| Hummer EV | 329 miles (529 km) | $110,295 |
| BMW iX | 324 miles (521 km) | $84,195 |
| Ford F-150 Lightning | 320 miles (515 km) | $74,169 |
| Rivian R1S | 316 miles (509 km) | $70,000 |
Source: Car and Driver
The top-spec Lucid Air offers the highest range of any EV with a price tag of $170,500, followed by the Tesla Model S. But the Tesla Model 3 offers the most bang for your buck if range and price are the only two factors in consideration.


Energy
The World’s Biggest Oil Producers in 2023
Just three countries accounted for 40% of global oil production last year.
The World’s Biggest Oil Producers in 2023
This was originally posted on Elements. Sign up to the free mailing list to get beautiful visualizations on natural resource megatrends in your email.
Despite efforts to decarbonize the global economy, oil still remains one of the world’s most important resources. It’s also produced by a fairly limited group of countries, which can be a source of economic and political leverage.
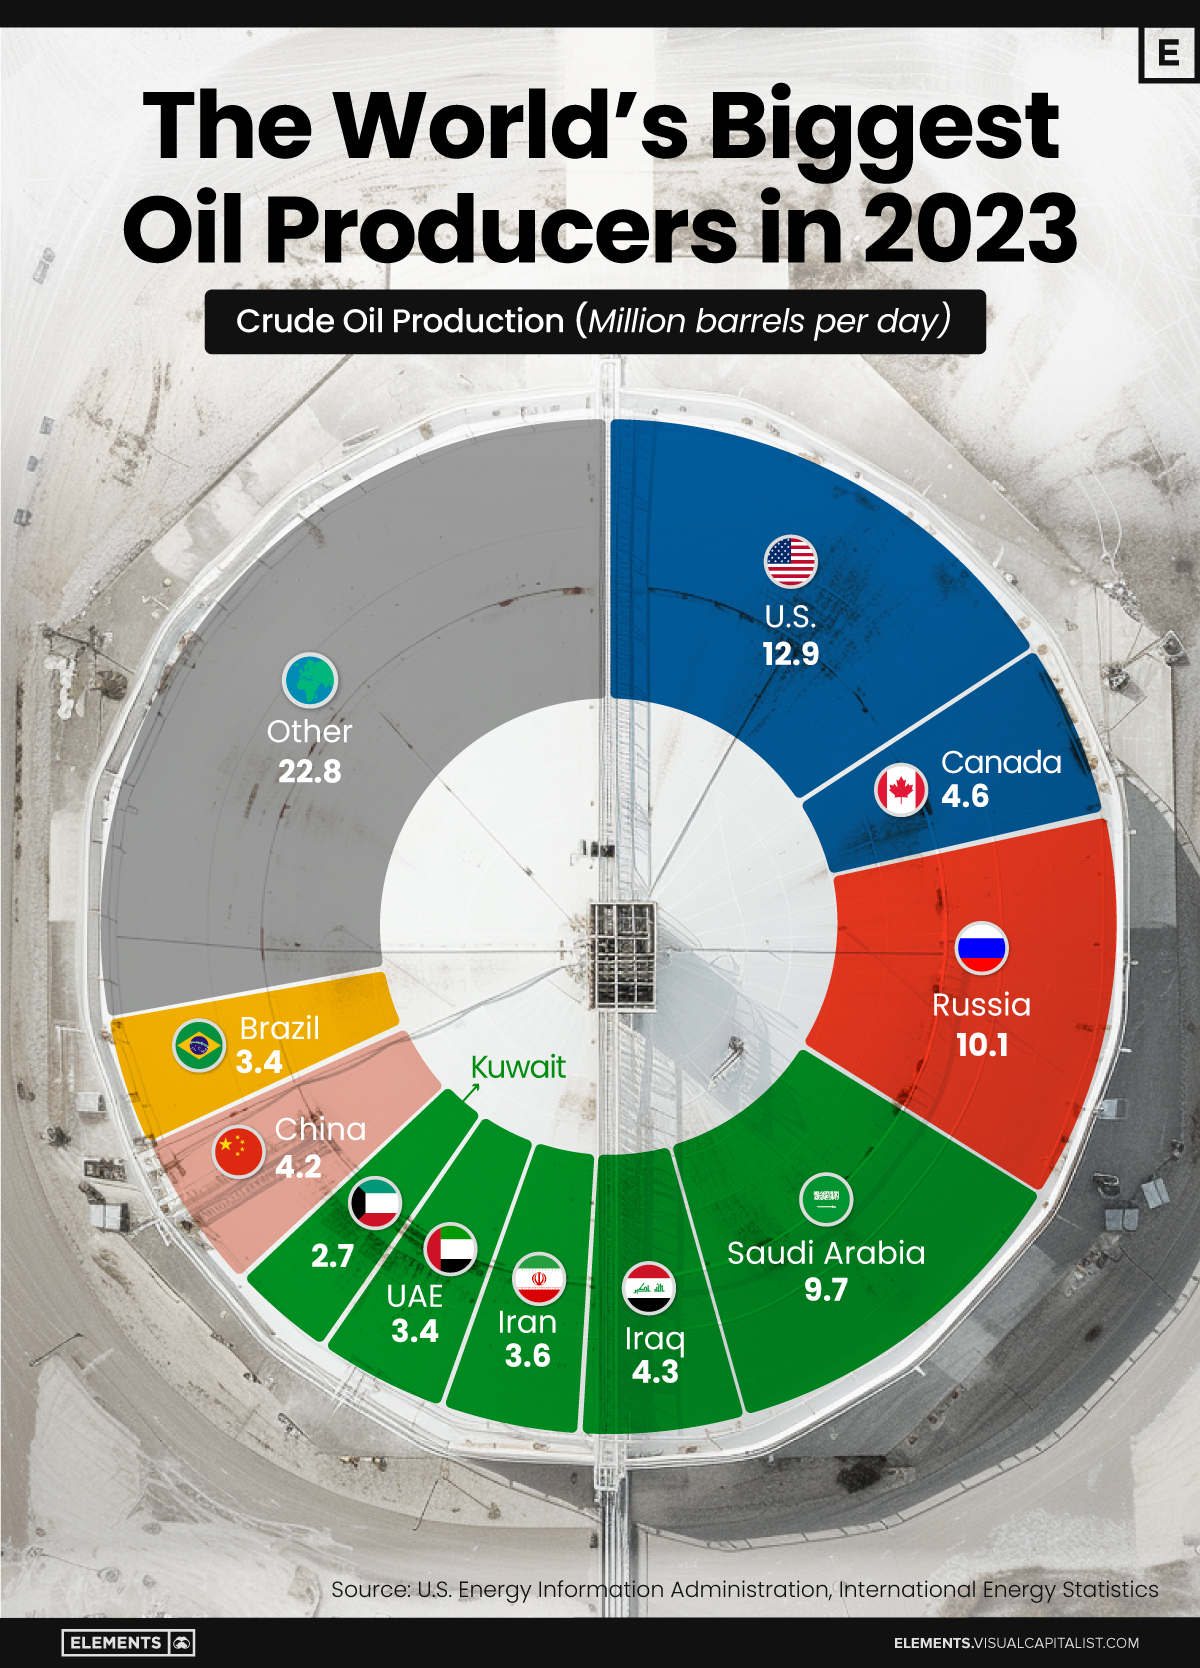
This graphic illustrates global crude oil production in 2023, measured in million barrels per day, sourced from the U.S. Energy Information Administration (EIA).
Three Countries Account for 40% of Global Oil Production
In 2023, the United States, Russia, and Saudi Arabia collectively contributed 32.7 million barrels per day to global oil production.
| Oil Production 2023 | Million barrels per day |
|---|---|
| 🇺🇸 U.S. | 12.9 |
| 🇷🇺 Russia | 10.1 |
| 🇸🇦 Saudi Arabia | 9.7 |
| 🇨🇦 Canada | 4.6 |
| 🇮🇶 Iraq | 4.3 |
| 🇨🇳 China | 4.2 |
| 🇮🇷 Iran | 3.6 |
| 🇧🇷 Brazil | 3.4 |
| 🇦🇪 UAE | 3.4 |
| 🇰🇼 Kuwait | 2.7 |
| 🌍 Other | 22.8 |
These three nations have consistently dominated oil production since 1971. The leading position, however, has alternated among them over the past five decades.
In contrast, the combined production of the next three largest producers—Canada, Iraq, and China—reached 13.1 million barrels per day in 2023, just surpassing the production of the United States alone.
In the near term, no country is likely to surpass the record production achieved by the U.S. in 2023, as no other producer has ever reached a daily capacity of 13.0 million barrels. Recently, Saudi Arabia’s state-owned Saudi Aramco scrapped plans to increase production capacity to 13.0 million barrels per day by 2027.
In 2024, analysts forecast that the U.S. will maintain its position as the top oil producer. In fact, according to Macquarie Group, U.S. oil production is expected to achieve a record pace of about 14 million barrels per day by the end of the year.

-

 Technology2 weeks ago
Ranked: The Most Popular Smartphone Brands in the U.S.
-

 Misc1 week ago
Almost Every EV Stock is Down After Q1 2024
-

 Money1 week ago
Where Does One U.S. Tax Dollar Go?
-

 Green2 weeks ago
Ranked: Top Countries by Total Forest Loss Since 2001
-

 Real Estate2 weeks ago
Visualizing America’s Shortage of Affordable Homes
-

 Maps2 weeks ago
Mapped: Average Wages Across Europe
-

 Mining2 weeks ago
Charted: The Value Gap Between the Gold Price and Gold Miners
-

 Demographics2 weeks ago
Visualizing the Size of the Global Senior Population