Energy
Visualizing the Race for EV Dominance
![]() Subscribe to the Elements free mailing list for more like this
Subscribe to the Elements free mailing list for more like this
Electric Car Companies: Eating Tesla’s Dust
This was originally posted on Elements. Sign up to the free mailing list to get beautiful visualizations on natural resource megatrends in your email every week.
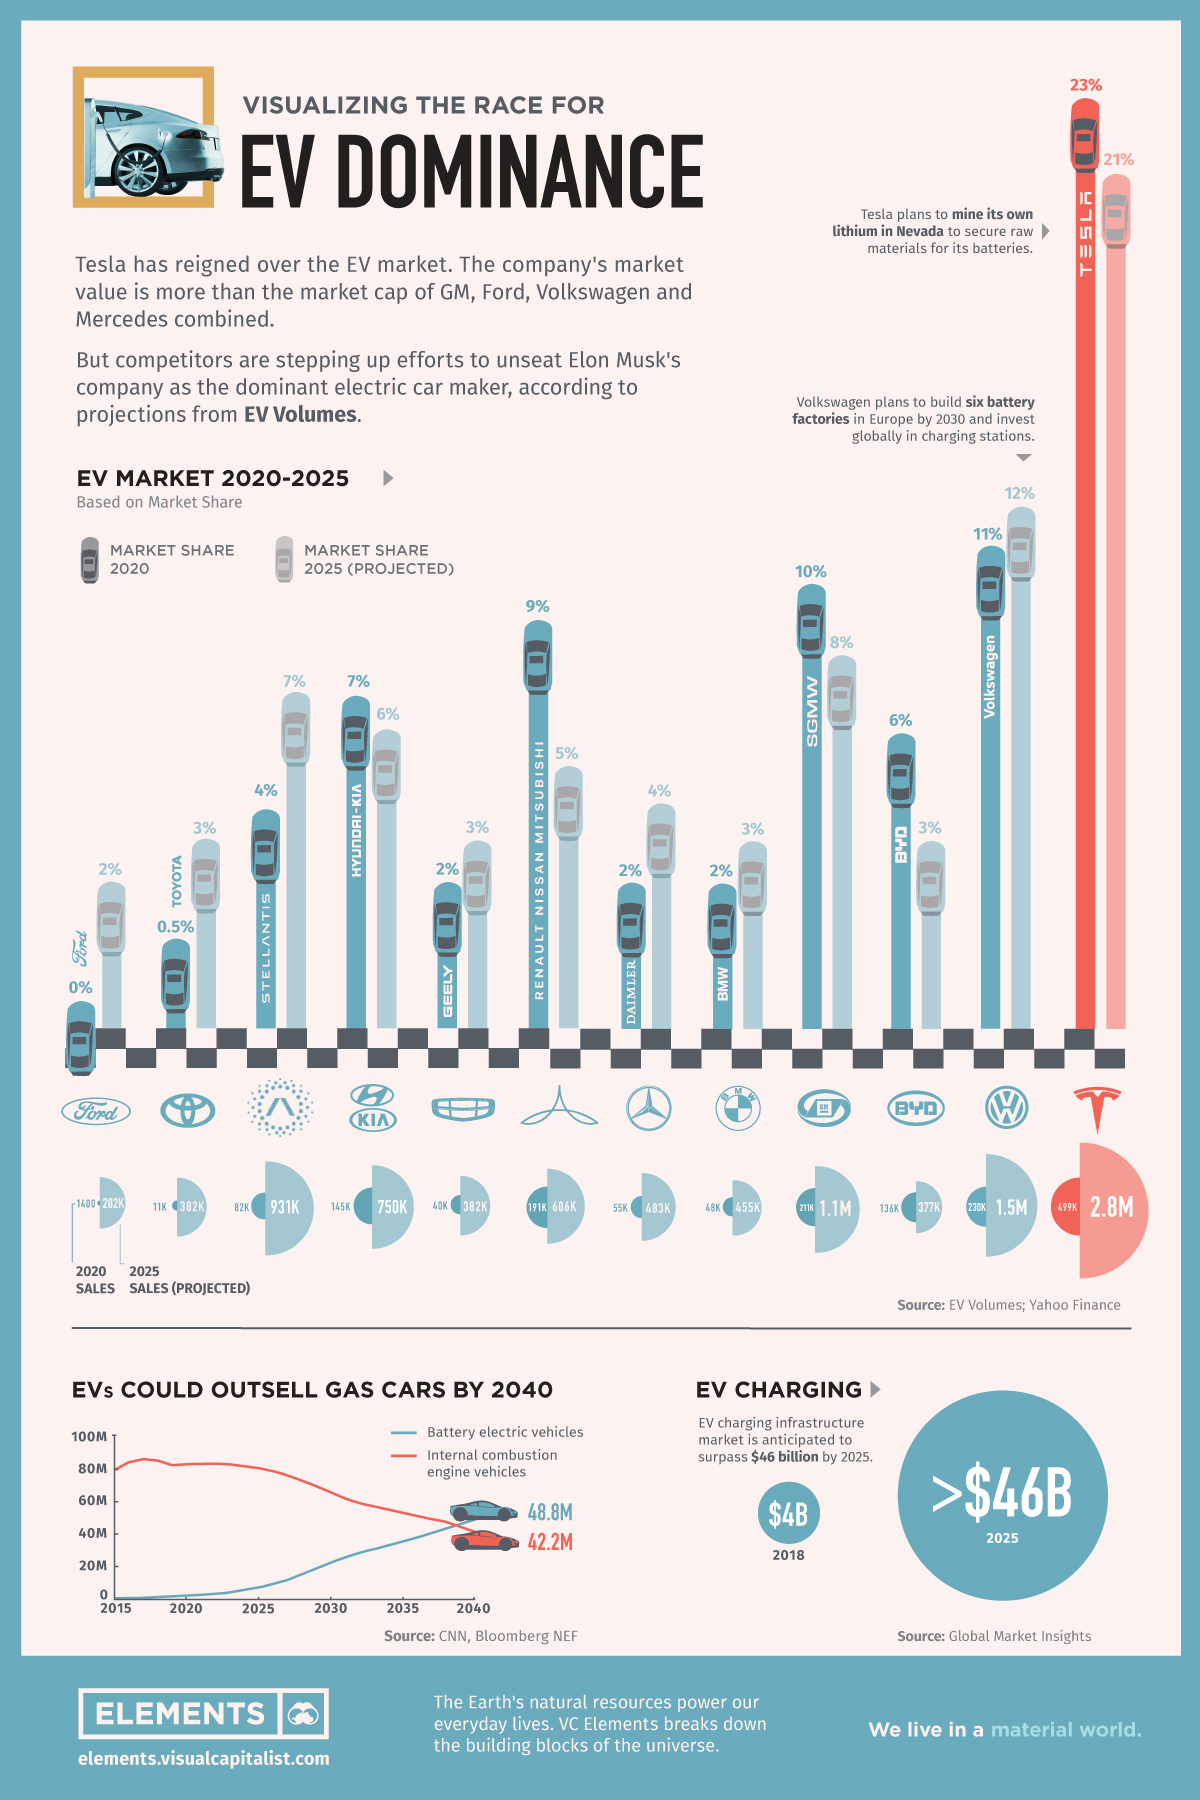
Tesla has reigned supreme among electric car companies, ever since it first released the Roadster back in 2008.
The California-based company headed by Elon Musk ended 2020 with 23% of the EV market and recently became the first automaker to hit a $1 trillion market capitalization. However, competitors like Volkswagen hope to accelerate their own EV efforts to unseat Musk’s company as the dominant manufacturer.
This graphic based on data from EV Volumes compares Tesla and other top carmakers’ positions today—from an all-electric perspective—and gives market share projections for 2025.
Auto Majors Playing Catch-up
According to Wood Mackenzie, Volkswagen will become the largest manufacturer of EVs before 2030. In order to achieve this, the world’s second-biggest carmaker is in talks with suppliers to secure direct access to the raw materials for batteries.
It also plans to build six battery factories in Europe by 2030 and to invest globally in charging stations. Still, according to EV Volumes projections, by 2025 the German company is forecasted to have only 12% of the market versus Tesla’s 21%.
| Company | Sales 2020 | Sales 2025 (projections) | Market cap (Oct '21, USD) |
|---|---|---|---|
| Tesla | 499,000 | 2,800,000 | $1,023B |
| Volkswagen Group | 230,000 | 1,500,000 | $170B |
| BYD | 136,000 | 377,000 | $113B |
| SGMW (GM, Wulling Motors, SAIC) | 211,000 | 1,100,000 | $89B |
| BMW | 48,000 | 455,000 | $67B |
| Daimler (Mercedes-Benz) | 55,000 | 483,000 | $103B |
| Renault-Nissan-Mitsubishi | 191,000 | 606,000 | $39B |
| Geely | 40,000 | 382,000 | $34B |
| Hyundai -Kia | 145,000 | 750,000 | $112B |
| Stellantis | 82,000 | 931,000 | $63B |
| Toyota | 11,000 | 382,000 | $240B |
| Ford | 1,400 | 282,000 | $63B |
Other auto giants are following the same track towards EV adoption.
GM, the largest U.S. automaker, wants to stop selling fuel-burning cars by 2035. The company is making a big push into pure electric vehicles, with more than 30 new models expected by 2025.
Meanwhile, Ford expects 40% of its vehicles sold to be electric by the year 2030. The American carmaker has laid out plans to invest tens of billions of dollars in electric and autonomous vehicle efforts in the coming years.
Tesla’s Brand: A Secret Weapon
When it comes to electric car company brand awareness in the marketplace, Tesla still surpasses all others. In fact, more than one-fourth of shoppers who are considering an EV said Tesla is their top choice.
“They’ve done a wonderful job at presenting themselves as the innovative leader of electric vehicles and therefore, this is translating high awareness among consumers…”
—Rachelle Petusky, Research at Cox Automotive Mobility Group
Tesla recently surpassed Audi as the fourth-largest luxury car brand in the United States in 2020. It is now just behind BMW, Lexus, and Mercedes-Benz.
The Dominance of Electric Car Companies by 2040
BloombergNEF expects annual passenger EV sales to reach 13 million in 2025, 28 million in 2030, and 48 million by 2040, outselling gasoline and diesel models (42 million).
As the EV market continues to grow globally, competitors hope to take a run at Tesla’s lead—or at least stay in the race.


Energy
The World’s Biggest Nuclear Energy Producers
China has grown its nuclear capacity over the last decade, now ranking second on the list of top nuclear energy producers.


The World’s Biggest Nuclear Energy Producers
This was originally posted on our Voronoi app. Download the app for free on Apple or Android and discover incredible data-driven charts from a variety of trusted sources.
Scientists in South Korea recently broke a record in a nuclear fusion experiment. For 48 seconds, they sustained a temperature seven times that of the sun’s core.
But generating commercially viable energy from nuclear fusion still remains more science fiction than reality. Meanwhile, its more reliable sibling, nuclear fission, has been powering our world for many decades.
In this graphic, we visualized the top producers of nuclear energy by their share of the global total, measured in terawatt hours (TWh). Data for this was sourced from the Nuclear Energy Institute, last updated in August 2022.
Which Country Generates the Most Nuclear Energy?
Nuclear energy production in the U.S. is more than twice the amount produced by China (ranked second) and France (ranked third) put together. In total, the U.S. accounts for nearly 30% of global nuclear energy output.
However, nuclear power only accounts for one-fifth of America’s electricity supply. This is in contrast to France, which generates 60% of its electricity from nuclear plants.
| Rank | Country | Nuclear Energy Produced (TWh) | % of Total |
|---|---|---|---|
| 1 | 🇺🇸 U.S. | 772 | 29% |
| 2 | 🇨🇳 China | 383 | 14% |
| 3 | 🇫🇷 France | 363 | 14% |
| 4 | 🇷🇺 Russia | 208 | 8% |
| 5 | 🇰🇷 South Korea | 150 | 6% |
| 6 | 🇨🇦 Canada | 87 | 3% |
| 7 | 🇺🇦 Ukraine | 81 | 3% |
| 8 | 🇩🇪 Germany | 65 | 2% |
| 9 | 🇯🇵 Japan | 61 | 2% |
| 10 | 🇪🇸 Spain | 54 | 2% |
| 11 | 🇸🇪 Sweden | 51 | 2% |
| 12 | 🇧🇪 Belgium | 48 | 2% |
| 13 | 🇬🇧 UK | 42 | 2% |
| 14 | 🇮🇳 India | 40 | 2% |
| 15 | 🇨🇿 Czech Republic | 29 | 1% |
| N/A | 🌐 Other | 219 | 8% |
| N/A | 🌍 Total | 2,653 | 100% |
Another highlight is how China has rapidly grown its nuclear energy capabilities in the last decade. Between 2016 and 2021, for example, it increased its share of global nuclear energy output from less than 10% to more than 14%, overtaking France for second place.
On the opposite end, the UK’s share has slipped to 2% over the same time period.
Meanwhile, Ukraine has heavily relied on nuclear energy to power its grid. In March 2022, it lost access to its key Zaporizhzhia Nuclear Power Station after Russian forces wrested control of the facility. With six 1,000 MW reactors, the plant is one of the largest in Europe. It is currently not producing any power, and has been the site of recent drone attacks.

-

 Markets2 weeks ago
Visualizing America’s Shortage of Affordable Homes
-

 Technology1 week ago
Ranked: Semiconductor Companies by Industry Revenue Share
-

 Money1 week ago
Which States Have the Highest Minimum Wage in America?
-

 Real Estate1 week ago
Ranked: The Most Valuable Housing Markets in America
-

 Business2 weeks ago
Charted: Big Four Market Share by S&P 500 Audits
-

 AI2 weeks ago
The Stock Performance of U.S. Chipmakers So Far in 2024
-

 Automotive2 weeks ago
Almost Every EV Stock is Down After Q1 2024
-

 Money2 weeks ago
Where Does One U.S. Tax Dollar Go?