Energy
Visualizing the Power Consumption of Bitcoin Mining


Visualizing the Power Consumption of Bitcoin Mining
Cryptocurrencies have been some of the most talked-about assets in recent months, with bitcoin and ether prices reaching record highs. These gains were driven by a flurry of announcements, including increased adoption by businesses and institutions.
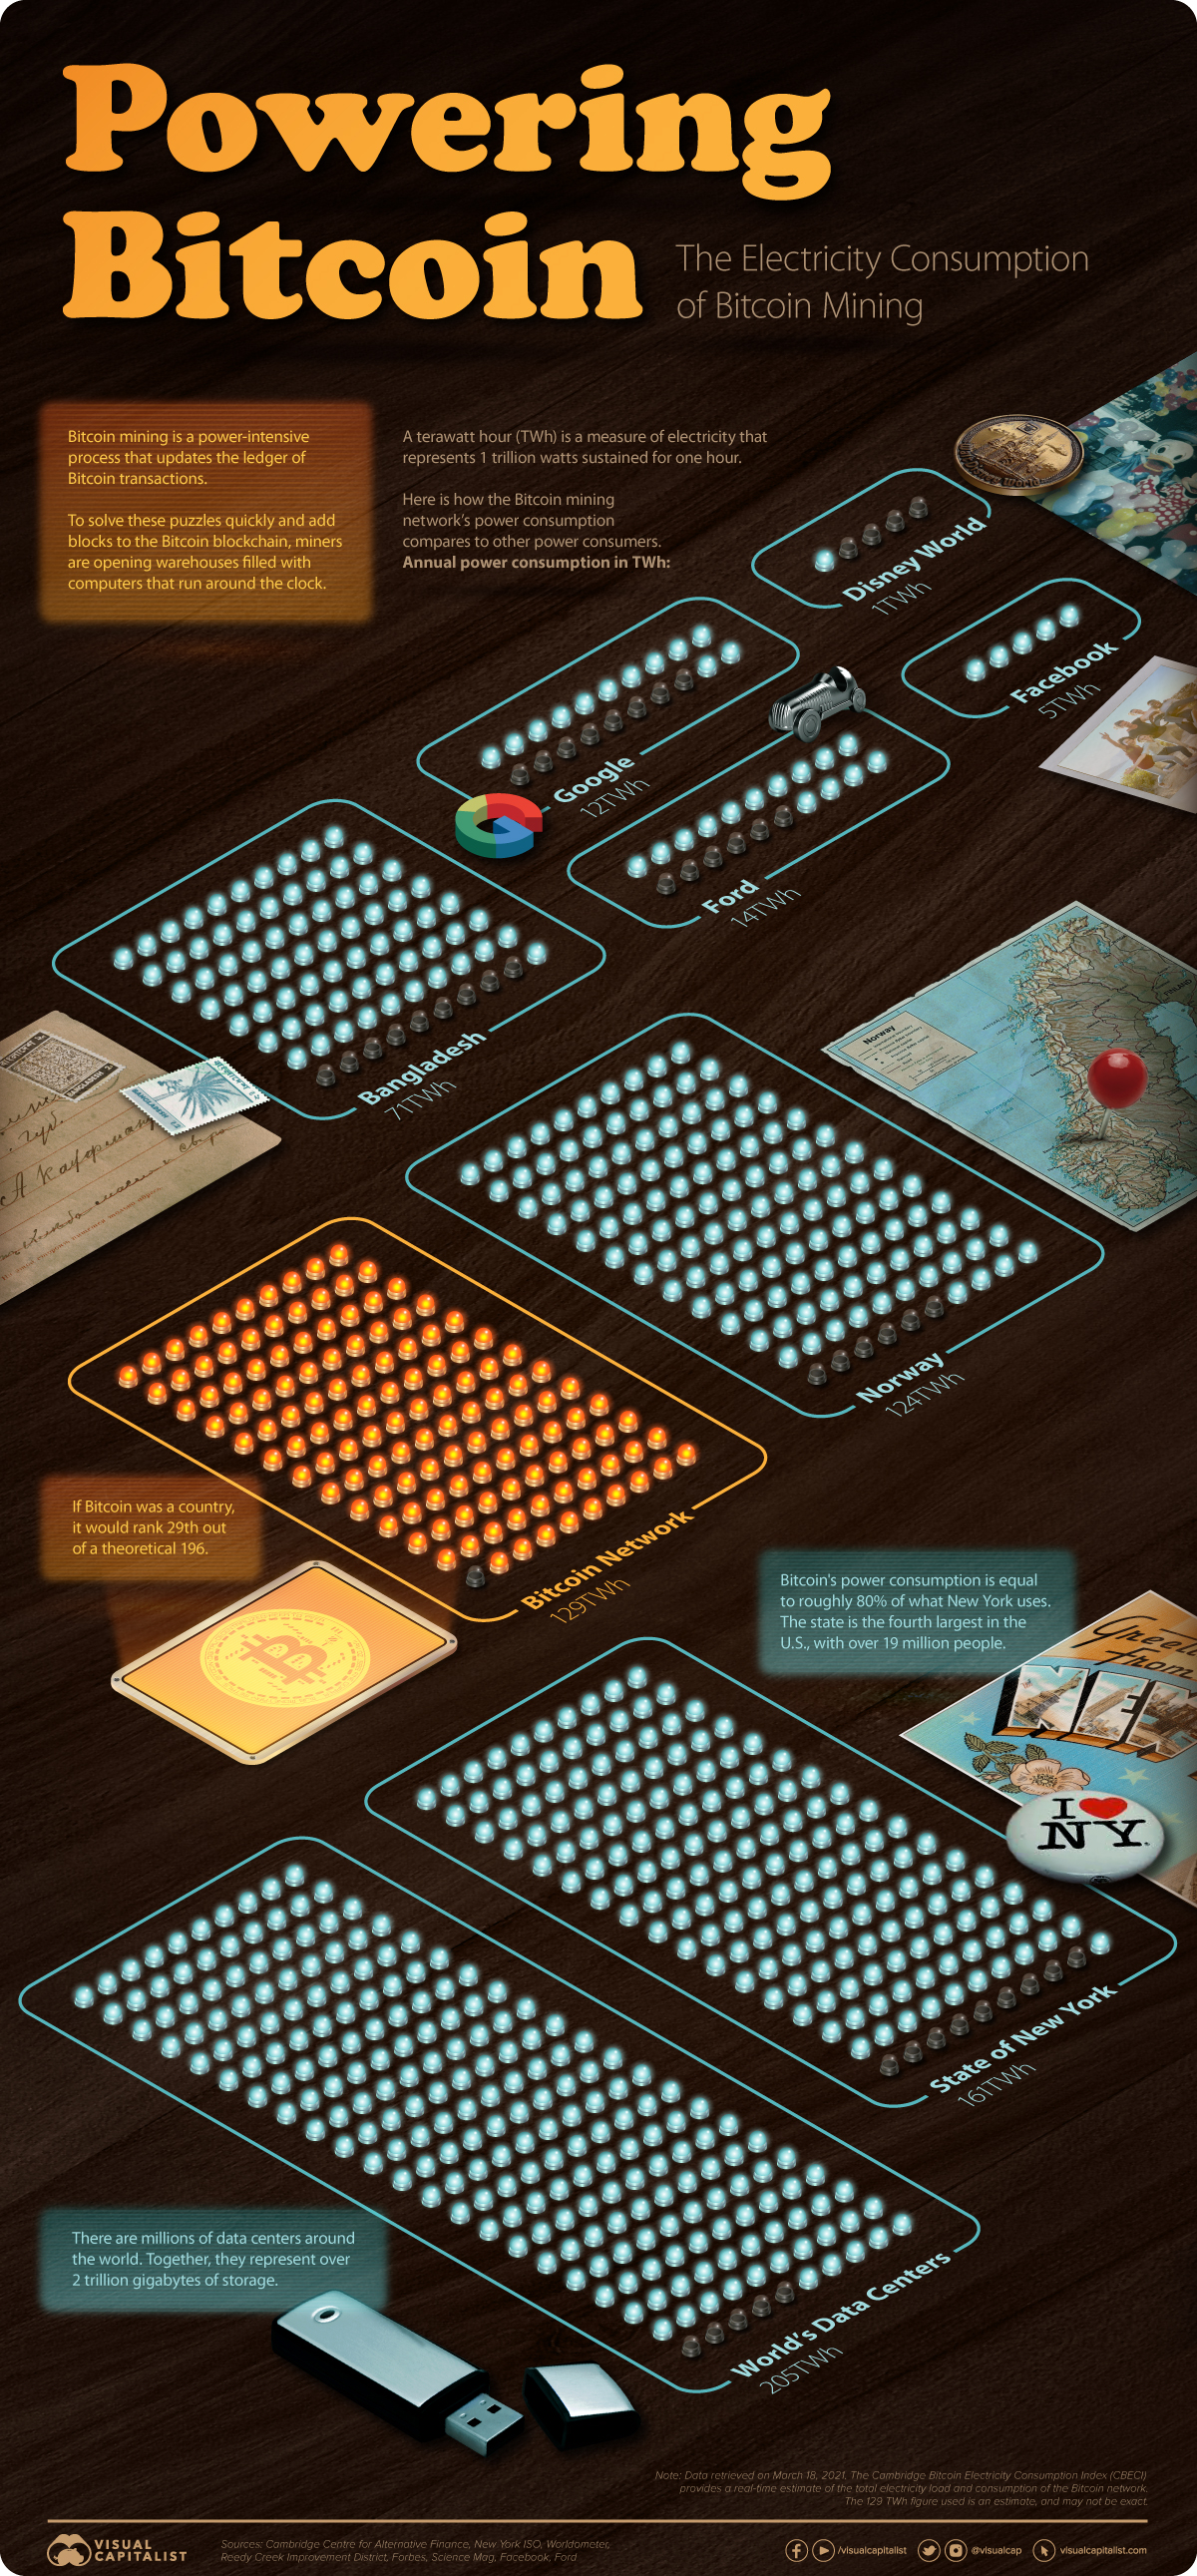
Lesser known, however, is just how much electricity is required to power the Bitcoin network. To put this into perspective, we’ve used data from the University of Cambridge’s Bitcoin Electricity Consumption Index (CBECI) to compare Bitcoin’s power consumption with a variety of countries and companies.
Why Does Bitcoin Mining Require So Much Power?
When people mine bitcoins, what they’re really doing is updating the ledger of Bitcoin transactions, also known as the blockchain. This requires them to solve numerical puzzles which have a 64-digit hexadecimal solution known as a hash.
Miners may be rewarded with bitcoins, but only if they arrive at the solution before others. It is for this reason that Bitcoin mining facilities—warehouses filled with computers—have been popping up around the world.
These facilities enable miners to scale up their hashrate, also known as the number of hashes produced each second. A higher hashrate requires greater amounts of electricity, and in some cases can even overload local infrastructure.
Putting Bitcoin’s Power Consumption Into Perspective
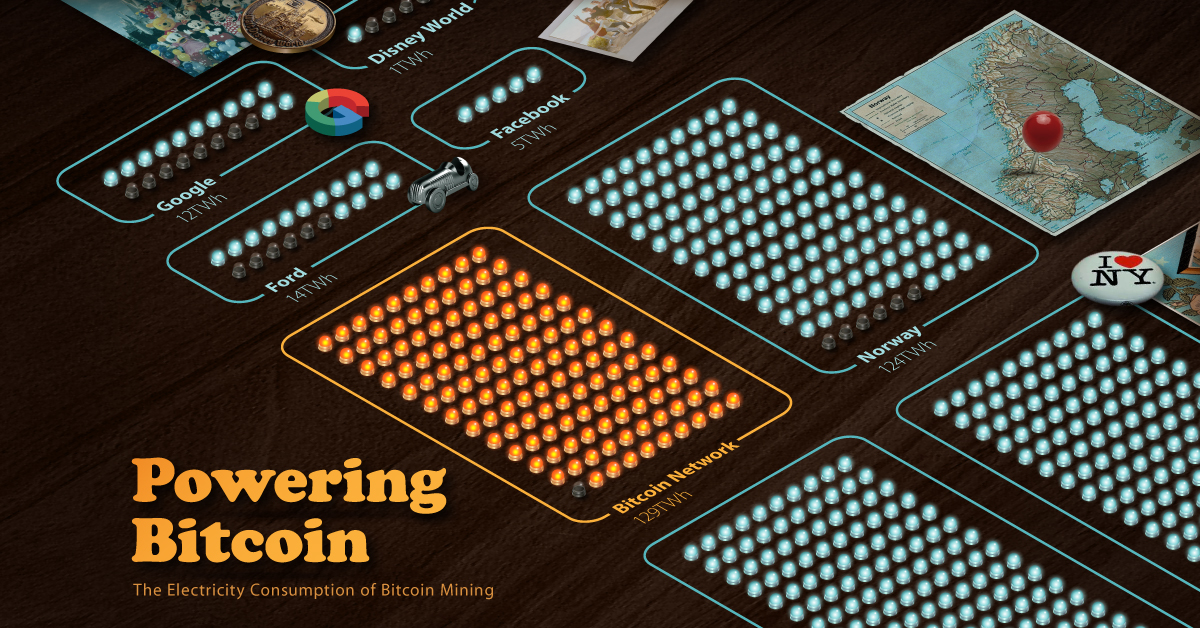
On March 18, 2021, the annual power consumption of the Bitcoin network was estimated to be 129 terawatt-hours (TWh). Here’s how this number compares to a selection of countries, companies, and more.
| Name | Population | Annual Electricity Consumption (TWh) |
|---|---|---|
| China | 1,443M | 6,543 |
| United States | 330.2M | 3,989 |
| All of the world’s data centers | - | 205 |
| State of New York | 19.3M | 161 |
| Bitcoin network | - | 129 |
| Norway | 5.4M | 124 |
| Bangladesh | 165.7M | 70 |
| - | 12 | |
| - | 5 | |
| Walt Disney World Resort (Florida) | - | 1 |
Note: A terawatt hour (TWh) is a measure of electricity that represents 1 trillion watts sustained for one hour.
Source: Cambridge Centre for Alternative Finance, Science Mag, New York ISO, Forbes, Facebook, Reedy Creek Improvement District, Worldometer
If Bitcoin were a country, it would rank 29th out of a theoretical 196, narrowly exceeding Norway’s consumption of 124 TWh. When compared to larger countries like the U.S. (3,989 TWh) and China (6,543 TWh), the cryptocurrency’s energy consumption is relatively light.
For further comparison, the Bitcoin network consumes 1,708% more electricity than Google, but 39% less than all of the world’s data centers—together, these represent over 2 trillion gigabytes of storage.
Where Does This Energy Come From?
In a 2020 report by the University of Cambridge, researchers found that 76% of cryptominers rely on some degree of renewable energy to power their operations. There’s still room for improvement, though, as renewables account for just 39% of cryptomining’s total energy consumption.
Here’s how the share of cryptominers that use each energy type vary across four global regions.
| Energy Source | Asia-Pacific | Europe | Latin America and the Caribbean | North America |
|---|---|---|---|---|
| Hydroelectric | 65% | 60% | 67% | 61% |
| Natural gas | 38% | 33% | 17% | 44% |
| Coal | 65% | 2% | 0% | 28% |
| Wind | 23% | 7% | 0% | 22% |
| Oil | 12% | 7% | 33% | 22% |
| Nuclear | 12% | 7% | 0% | 22% |
| Solar | 12% | 13% | 17% | 17% |
| Geothermal | 8% | 0% | 0% | 6% |
Source: University of Cambridge
Editor’s note: Numbers in each column are not meant to add to 100%
Hydroelectric energy is the most common source globally, and it gets used by at least 60% of cryptominers across all four regions. Other types of clean energy such as wind and solar appear to be less popular.
Coal energy plays a significant role in the Asia-Pacific region, and was the only source to match hydroelectricity in terms of usage. This can be largely attributed to China, which is currently the world’s largest consumer of coal.
Researchers from the University of Cambridge noted that they weren’t surprised by these findings, as the Chinese government’s strategy to ensure energy self-sufficiency has led to an oversupply of both hydroelectric and coal power plants.
Towards a Greener Crypto Future
As cryptocurrencies move further into the mainstream, it’s likely that governments and other regulators will turn their attention to the industry’s carbon footprint. This isn’t necessarily a bad thing, however.
Mike Colyer, CEO of Foundry, a blockchain financing provider, believes that cryptomining can support the global transition to renewable energy. More specifically, he believes that clustering cryptomining facilities near renewable energy projects can mitigate a common issue: an oversupply of electricity.
“It allows for a faster payback on solar projects or wind projects… because they would [otherwise] produce too much energy for the grid in that area”
– Mike Colyer, CEO, Foundry
This type of thinking appears to be taking hold in China as well. In April 2020, Ya’an, a city located in China’s Sichuan province, issued a public guidance encouraging blockchain firms to take advantage of its excess hydroelectricity.


Energy
The World’s Biggest Nuclear Energy Producers
China has grown its nuclear capacity over the last decade, now ranking second on the list of top nuclear energy producers.


The World’s Biggest Nuclear Energy Producers
This was originally posted on our Voronoi app. Download the app for free on Apple or Android and discover incredible data-driven charts from a variety of trusted sources.
Scientists in South Korea recently broke a record in a nuclear fusion experiment. For 48 seconds, they sustained a temperature seven times that of the sun’s core.
But generating commercially viable energy from nuclear fusion still remains more science fiction than reality. Meanwhile, its more reliable sibling, nuclear fission, has been powering our world for many decades.
In this graphic, we visualized the top producers of nuclear energy by their share of the global total, measured in terawatt hours (TWh). Data for this was sourced from the Nuclear Energy Institute, last updated in August 2022.
Which Country Generates the Most Nuclear Energy?
Nuclear energy production in the U.S. is more than twice the amount produced by China (ranked second) and France (ranked third) put together. In total, the U.S. accounts for nearly 30% of global nuclear energy output.
However, nuclear power only accounts for one-fifth of America’s electricity supply. This is in contrast to France, which generates 60% of its electricity from nuclear plants.
| Rank | Country | Nuclear Energy Produced (TWh) | % of Total |
|---|---|---|---|
| 1 | 🇺🇸 U.S. | 772 | 29% |
| 2 | 🇨🇳 China | 383 | 14% |
| 3 | 🇫🇷 France | 363 | 14% |
| 4 | 🇷🇺 Russia | 208 | 8% |
| 5 | 🇰🇷 South Korea | 150 | 6% |
| 6 | 🇨🇦 Canada | 87 | 3% |
| 7 | 🇺🇦 Ukraine | 81 | 3% |
| 8 | 🇩🇪 Germany | 65 | 2% |
| 9 | 🇯🇵 Japan | 61 | 2% |
| 10 | 🇪🇸 Spain | 54 | 2% |
| 11 | 🇸🇪 Sweden | 51 | 2% |
| 12 | 🇧🇪 Belgium | 48 | 2% |
| 13 | 🇬🇧 UK | 42 | 2% |
| 14 | 🇮🇳 India | 40 | 2% |
| 15 | 🇨🇿 Czech Republic | 29 | 1% |
| N/A | 🌐 Other | 219 | 8% |
| N/A | 🌍 Total | 2,653 | 100% |
Another highlight is how China has rapidly grown its nuclear energy capabilities in the last decade. Between 2016 and 2021, for example, it increased its share of global nuclear energy output from less than 10% to more than 14%, overtaking France for second place.
On the opposite end, the UK’s share has slipped to 2% over the same time period.
Meanwhile, Ukraine has heavily relied on nuclear energy to power its grid. In March 2022, it lost access to its key Zaporizhzhia Nuclear Power Station after Russian forces wrested control of the facility. With six 1,000 MW reactors, the plant is one of the largest in Europe. It is currently not producing any power, and has been the site of recent drone attacks.

-

 Real Estate2 weeks ago
Visualizing America’s Shortage of Affordable Homes
-

 Technology1 week ago
Ranked: Semiconductor Companies by Industry Revenue Share
-

 Money1 week ago
Which States Have the Highest Minimum Wage in America?
-

 Real Estate1 week ago
Ranked: The Most Valuable Housing Markets in America
-

 Business2 weeks ago
Charted: Big Four Market Share by S&P 500 Audits
-

 AI2 weeks ago
The Stock Performance of U.S. Chipmakers So Far in 2024
-

 Misc2 weeks ago
Almost Every EV Stock is Down After Q1 2024
-

 Money2 weeks ago
Where Does One U.S. Tax Dollar Go?