Misc
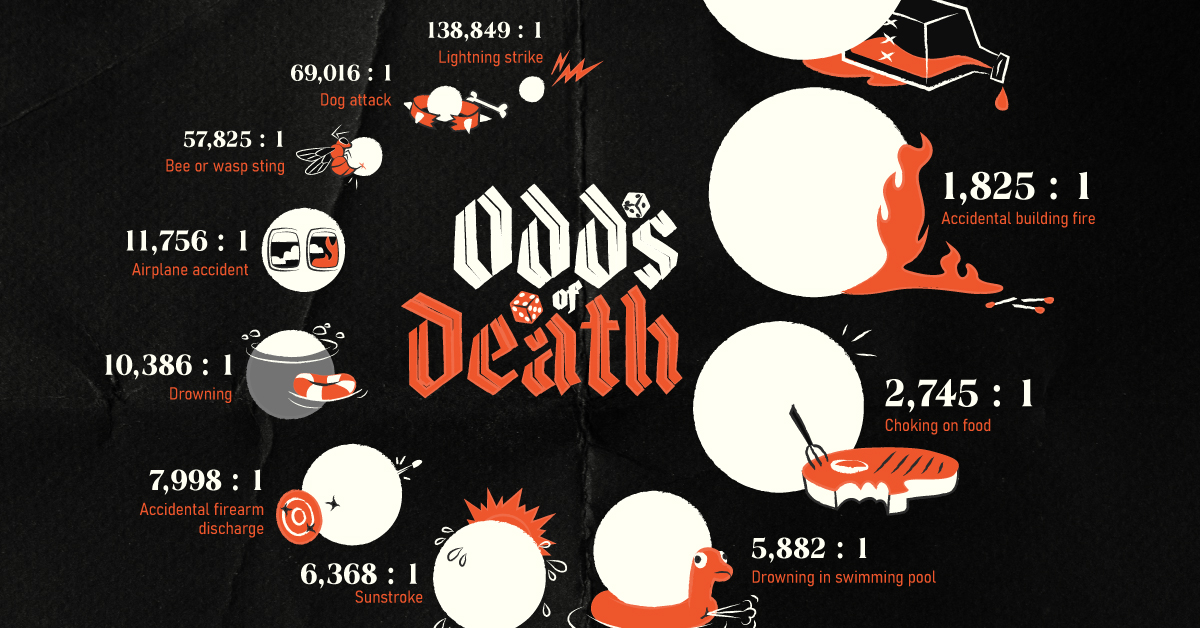
Visualizing the Odds of Dying from Various Accidents
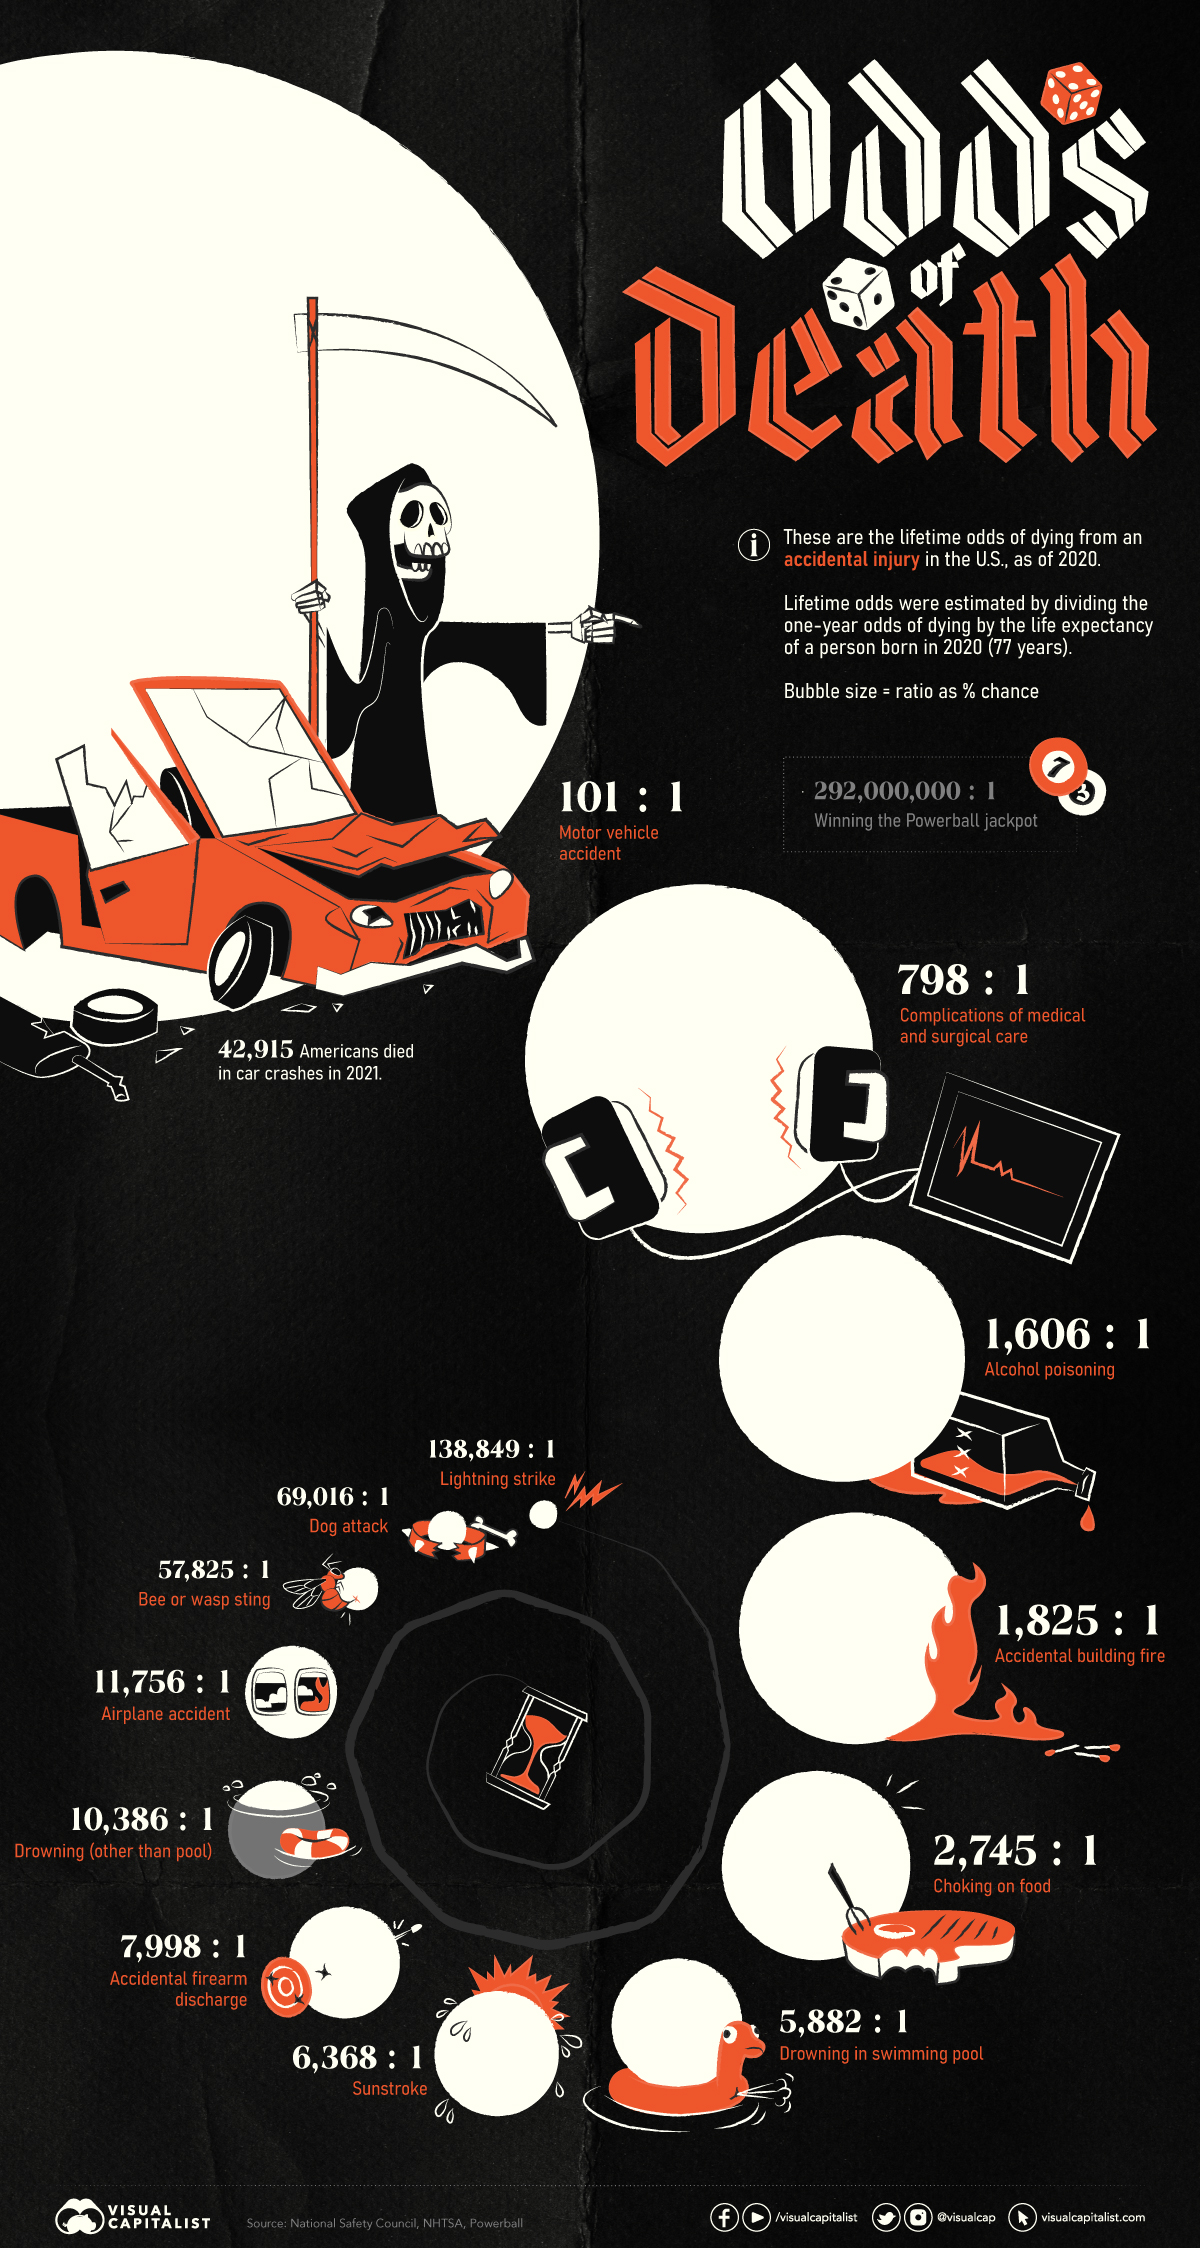


Infographic: The Odds of Dying from Various Accidents
Fatal accidents account for a significant number of deaths in the U.S. every year. For example, nearly 43,000 Americans died in traffic accidents in 2021.
Without the right context, however, it can be difficult to properly interpret these figures.
To help you understand your chances, we’ve compiled data from the National Safety Council, and visualized the lifetime odds of dying from various accidents.
Data and Methodology
The lifetime odds presented in this graphic were estimated by dividing the one-year odds of dying by the life expectancy of a person born in 2020 (77 years).
Additionally, these numbers are based on data from the U.S., and likely differ in other countries.
| Type of Accident | Lifetime odds of dying (1 in #) |
|---|---|
| Motor vehicle accident | 101 |
| Complications of medical and surgical care | 798 |
| Alcohol poisoning | 1,606 |
| Accidental building fire | 1,825 |
| Choking on food | 2,745 |
| Drowning in swimming pool | 5,782 |
| Sunstroke | 6,368 |
| Accidental firearm discharge | 7,998 |
| Drowning | 10,386 |
| Airplane accident | 11,756 |
| Bee or wasp sting | 57,825 |
| Dog attack | 69,016 |
| Lightning strike | 138,849 |
For comparison’s sake, the odds of winning the Powerball jackpot are 1 in 292,000,000. In other words, you are 4000x more likely to die by a lightning strike over your lifetime than to win the Powerball lottery.
Continue reading below for further context on some of these accidents.
Motor Vehicle Accidents
Motor vehicle accidents are a leading cause of accidental deaths in the U.S., with a 1 in 101 chance of dying. This is quite a common way of dying, especially when compared to something like bee stings (1 in 57,825).
Unfortunately, a major cause of vehicle deaths is impaired driving. The CDC reports that 32 Americans are killed every day in crashes involving alcohol, which equates to one death every 45 minutes.
For further context, consider this: 30% of all traffic-related deaths in 2020 involved alcohol-impaired drivers.
Drowning
The odds of drowning in a swimming pool (1 in 5,782) are significantly higher than those of drowning in general (1 in 10,386). According to the CDC, there are 4,000 fatal drownings every year, which works out to 11 deaths per day.
Drowning also happens to be a leading cause of death for children. It is the leading cause for kids aged 1-4, and second highest cause for kids aged 5-14.
A rather surprising fact about drowning is that 80% of fatalities are male. This has been attributed to higher rates of alcohol use and risk-taking behaviors.
Accidental Firearm Discharge
Lastly, let’s look at accidental firearm deaths, which have lifetime odds of 1 in 7,998. That’s higher than the odds of drowning (general), as well as dying in an airplane accident.
This shouldn’t come as a major surprise, since the U.S. has the highest rates of gun ownership in the world. More importantly, these odds highlight the importance of properly securing one’s firearms, as well as learning safe handling practices.
As a percentage of total gun-related deaths (45,222 in 2020), accidental shootings represent a tiny 1%. The two leading causes are suicide (54%) and homicide (43%).
Interested in learning more about death? Revisit one of our most popular posts of all time: Visualizing the History of Pandemics.


Misc
How Hard Is It to Get Into an Ivy League School?
We detail the admission rates and average annual cost for Ivy League schools, as well as the median SAT scores required to be accepted.


How Hard Is It to Get Into an Ivy League School?
This was originally posted on our Voronoi app. Download the app for free on iOS or Android and discover incredible data-driven charts from a variety of trusted sources.
Ivy League institutions are renowned worldwide for their academic excellence and long-standing traditions. But how hard is it to get into one of the top universities in the U.S.?
In this graphic, we detail the admission rates and average annual cost for Ivy League schools, as well as the median SAT scores required to be accepted. The data comes from the National Center for Education Statistics and was compiled by 24/7 Wall St.
Note that “average annual cost” represents the net price a student pays after subtracting the average value of grants and/or scholarships received.
Harvard is the Most Selective
The SAT is a standardized test commonly used for college admissions in the United States. It’s taken by high school juniors and seniors to assess their readiness for college-level academic work.
When comparing SAT scores, Harvard and Dartmouth are among the most challenging universities to gain admission to. The median SAT scores for their students are 760 for reading and writing and 790 for math. Still, Harvard has half the admission rate (3.2%) compared to Dartmouth (6.4%).
| School | Admission rate (%) | SAT Score: Reading & Writing | SAT Score: Math | Avg Annual Cost* |
|---|---|---|---|---|
| Harvard University | 3.2 | 760 | 790 | $13,259 |
| Columbia University | 3.9 | 750 | 780 | $12,836 |
| Yale University | 4.6 | 760 | 780 | $16,341 |
| Brown University | 5.1 | 760 | 780 | $26,308 |
| Princeton University | 5.7 | 760 | 780 | $11,080 |
| Dartmouth College | 6.4 | 760 | 790 | $33,023 |
| University of Pennsylvania | 6.5 | 750 | 790 | $14,851 |
| Cornell University | 7.5 | 750 | 780 | $29,011 |
*Costs after receiving federal financial aid.
Additionally, Dartmouth has the highest average annual cost at $33,000. Princeton has the lowest at $11,100.
While student debt has surged in the United States in recent years, hitting $1.73 trillion in 2023, the worth of obtaining a degree from any of the schools listed surpasses mere academics. This is evidenced by the substantial incomes earned by former students.
Harvard grads, for example, have the highest average starting salary in the country, at $91,700.

-

 Real Estate2 weeks ago
Visualizing America’s Shortage of Affordable Homes
-

 Technology1 week ago
Ranked: Semiconductor Companies by Industry Revenue Share
-

 Money1 week ago
Which States Have the Highest Minimum Wage in America?
-

 Real Estate1 week ago
Ranked: The Most Valuable Housing Markets in America
-

 Business2 weeks ago
Charted: Big Four Market Share by S&P 500 Audits
-

 AI2 weeks ago
The Stock Performance of U.S. Chipmakers So Far in 2024
-

 Misc2 weeks ago
Almost Every EV Stock is Down After Q1 2024
-

 Money2 weeks ago
Where Does One U.S. Tax Dollar Go?