Healthcare
Visualizing The Most Widespread Blood Types in Every Country
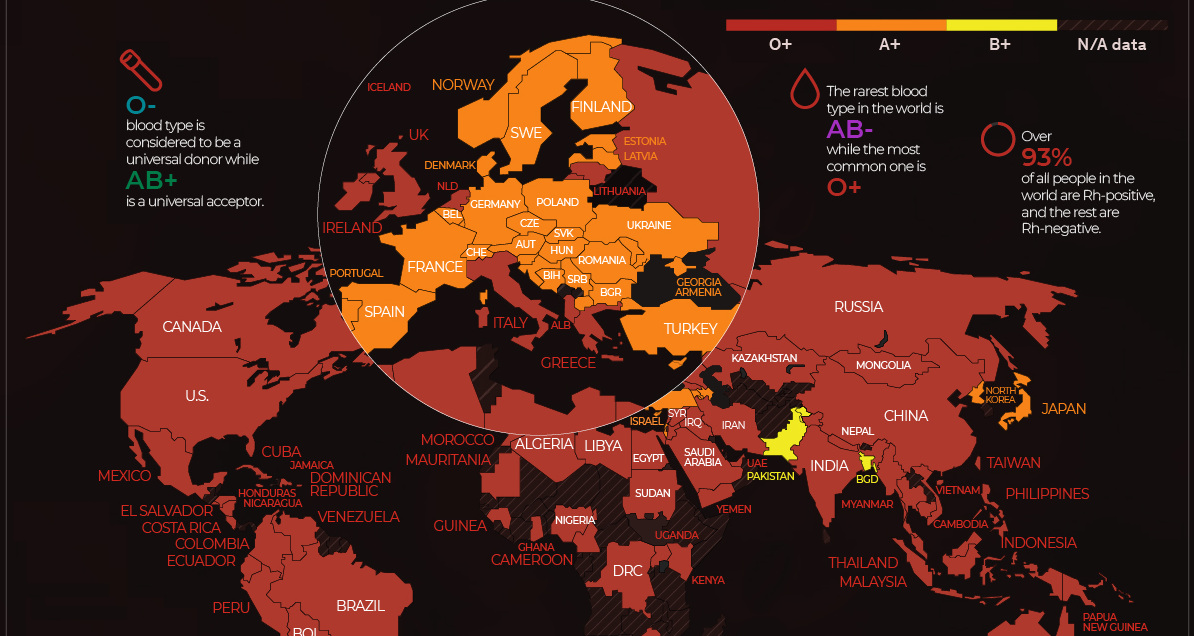
View the full-size infographic map
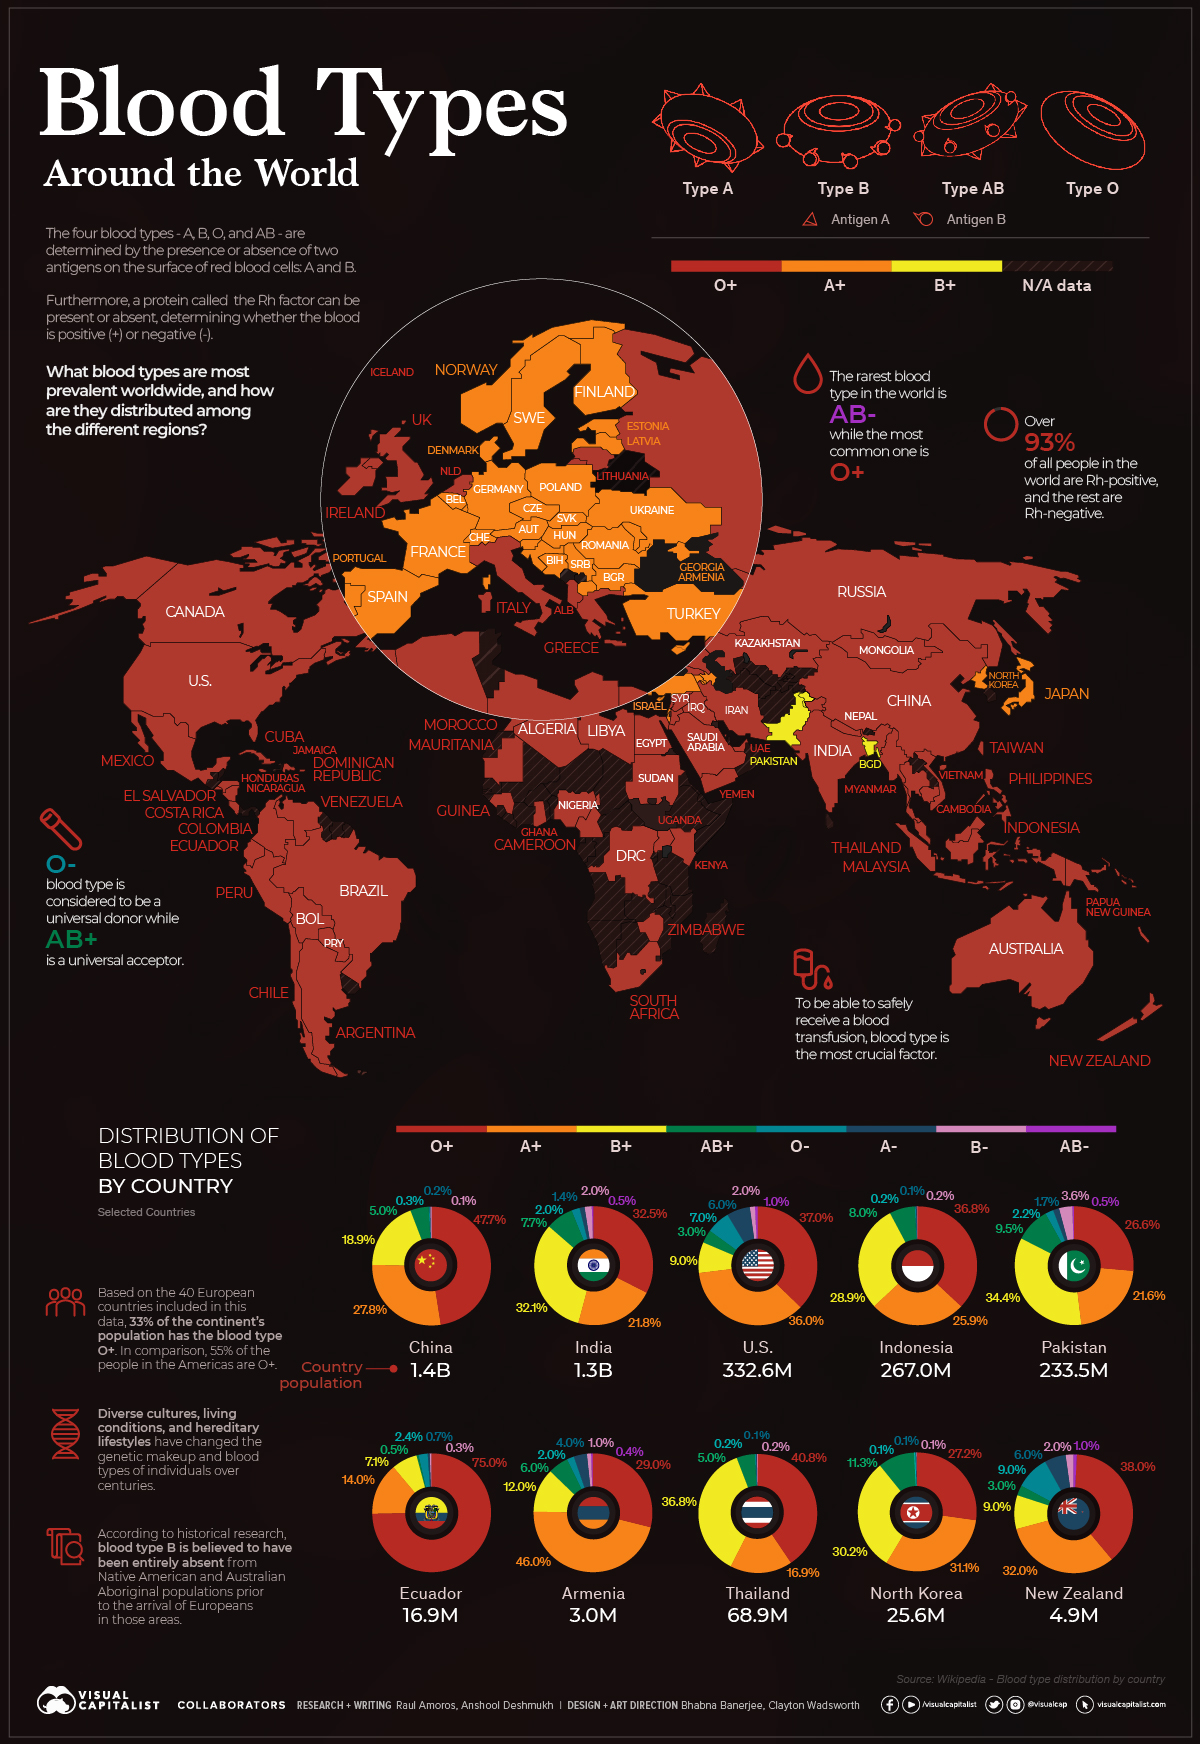


The Most Widespread Blood Types, by Country
Blood is essential to the human body’s functioning. It dispenses crucial nutrients throughout the body, exchanges oxygen and carbon dioxide, and carries our immune system’s “militia” of white blood cells and antibodies to stave off infections.
But not all blood is the same. The antigens in one’s blood determine their blood type classification: There are eight common blood type groups, and with different combinations of antigens and classifications, 36 human blood type groups in total.
Using data sourced from Wikipedia, we can map the most widespread blood types across the globe.
Overall Distribution of Blood Types
Of the 7.9 billion people living in the world, spread across 195 countries and 7 continents, the most common blood type is O+, with over 39% of the world’s population falling under this classification. The rarest, meanwhile, is AB-, with only 0.40% of the population having this particular blood type.
Breaking it down to the national level, these statistics begin to change. Since different genetic factors play a part in determining an individual’s blood type, every country and region tells a different story about its people.
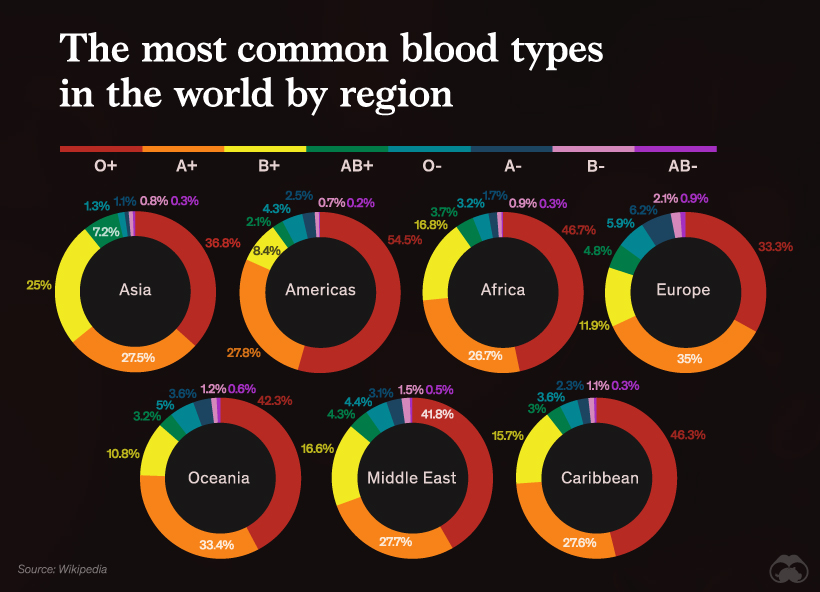
Regional Distribution of Blood Types
Asia
Even though O+ remains the most common blood type here, blood type B is relatively common too. Nearly 20% of China’s population has this blood type, and it is also fairly common in India and other Central Asian countries.
Comparatively, in some West Asian countries like Armenia and Azerbaijan, the population with blood type A+ outweighs any others.
Americas
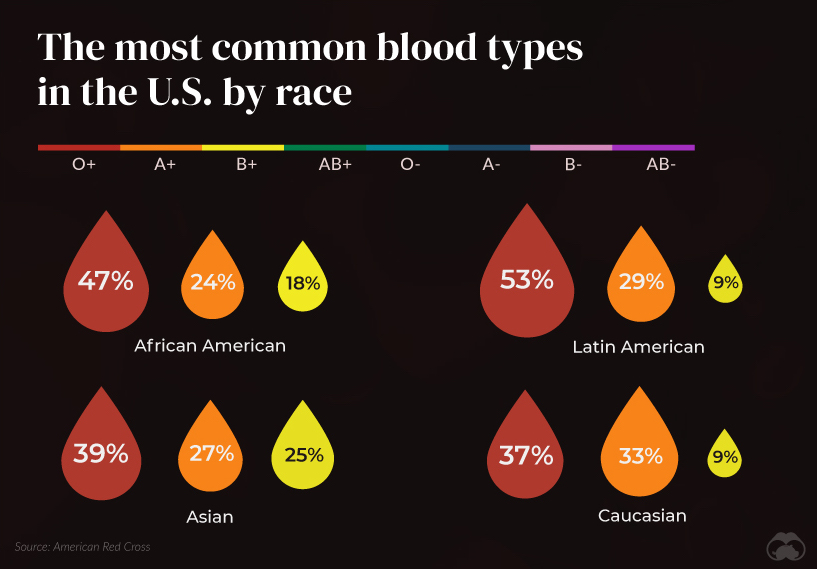
The O blood type is the most common globally and is carried by nearly 70% of South Americans. It is also the most common blood type in Canada and the United States.
Here is a breakdown of the most common blood types in the U.S. by race:
Africa
O+ is a strong blood group classification among African countries. Countries like Ghana, Libya, Congo and Egypt, have more individuals with O- blood types than AB+.
Europe
The A blood group is common in Europe. Nearly 40% of Denmark, Norway, Austria, and Ukraine have this blood type.
Oceania
O+ and A+ are dominant blood types in the Oceanic countries, with only Fiji having a substantial B+ blood type population.
Middle East
More than 41% of the population displays the O+ blood group type, with Lebanon being the only country with a strong O- and A- blood type population.
The Caribbean
Nearly half of people in Caribbean countries have the blood type O+, though Jamaica has B+ as the most common blood type group.
Here is the classification of the blood types by every region in the world:
Unity in Diversity
Even though ethnicity and genetics play a vital role in determining a person’s blood type, we can see many different blood types distributed worldwide.
Blood provides an ideal opportunity for the study of human variation without cultural prejudice. It can be easily classified for many different genetically inherited blood typing systems.
Our individuality is a factor that helps determine our life, choices, and personalities. But at the end of the day, commonalities like blood are what bring us together.


Healthcare
The Cost of an EpiPen in Major Markets
This visualization compares EpiPen prices around the world, with the U.S. having the highest prices by far.


The Cost of an EpiPen in Major Markets
This was originally posted on our Voronoi app. Download the app for free on iOS or Android and discover incredible data-driven charts from a variety of trusted sources.
EpiPens are auto-injectors containing epinephrine, a drug that can treat or reverse severe allergic reactions, potentially preventing death.
The global epinephrine market was valued at $1.75 billion in 2022 and is projected to reach $4.08 billion by 2030. North America represents over 60% of the market.
EpiPens, however, can be prohibitively expensive in some regions.
In this graphic, we present estimated EpiPen prices in major global markets, compiled by World Population Review and converted to U.S. dollars as of August 2023.
Why are U.S. Prices so High?
The U.S. stands out as the most expensive market for EpiPens, despite over 1 million Americans having epinephrine prescriptions. After Mylan (now part of Pfizer) acquired the rights to produce EpiPens in the U.S. in 2007, the cost of a two-pack skyrocketed to $600, up from about $60.
| Country | Price (USD) |
|---|---|
| 🇺🇸 U.S. | 300* |
| 🇯🇵 Japan | 98 |
| 🇩🇪 Germany | 85 |
| 🇨🇦 Canada | 80 |
| 🇫🇷 France | 76 |
| 🇦🇺 Australia | 66 |
| 🇬🇧 UK | 61 |
| 🇮🇳 India | 30 |
*Per unit cost. Commonly sold as a two-pack, meaning total cost is equal to $600
Former Mylan CEO Heather Bresch defended the price hikes to Congress, citing minimal profit margins. Mylan eventually settled with the U.S. government for a nine-figure sum.
Notably, EpiPens are available at a fraction of the cost in other developed countries like Japan, Germany, and Canada.
Making EpiPens More Affordable
Efforts to improve EpiPen affordability are underway in several U.S. states. For instance, the Colorado House approved a $60 price cap on epinephrine, now under review by the state Senate.
Similar measures in Rhode Island, Delaware, Missouri, and Vermont aim to ensure insurance coverage for epinephrine, which is not currently mandatory, although most health plans cover it.

-

 Maps1 week ago
The Largest Earthquakes in the New York Area (1970-2024)
-

 Money2 weeks ago
Where Does One U.S. Tax Dollar Go?
-

 Automotive2 weeks ago
Almost Every EV Stock is Down After Q1 2024
-

 AI2 weeks ago
The Stock Performance of U.S. Chipmakers So Far in 2024
-

 Markets2 weeks ago
Charted: Big Four Market Share by S&P 500 Audits
-

 Real Estate2 weeks ago
Ranked: The Most Valuable Housing Markets in America
-

 Money2 weeks ago
Which States Have the Highest Minimum Wage in America?
-

 AI2 weeks ago
Ranked: Semiconductor Companies by Industry Revenue Share