Energy
Visualizing the History of Energy Transitions
![]() Subscribe to the Elements free mailing list for more like this
Subscribe to the Elements free mailing list for more like this
The History of Energy Transitions
This was originally posted on Elements. Sign up to the free mailing list to get beautiful visualizations on natural resource megatrends in your email every week.
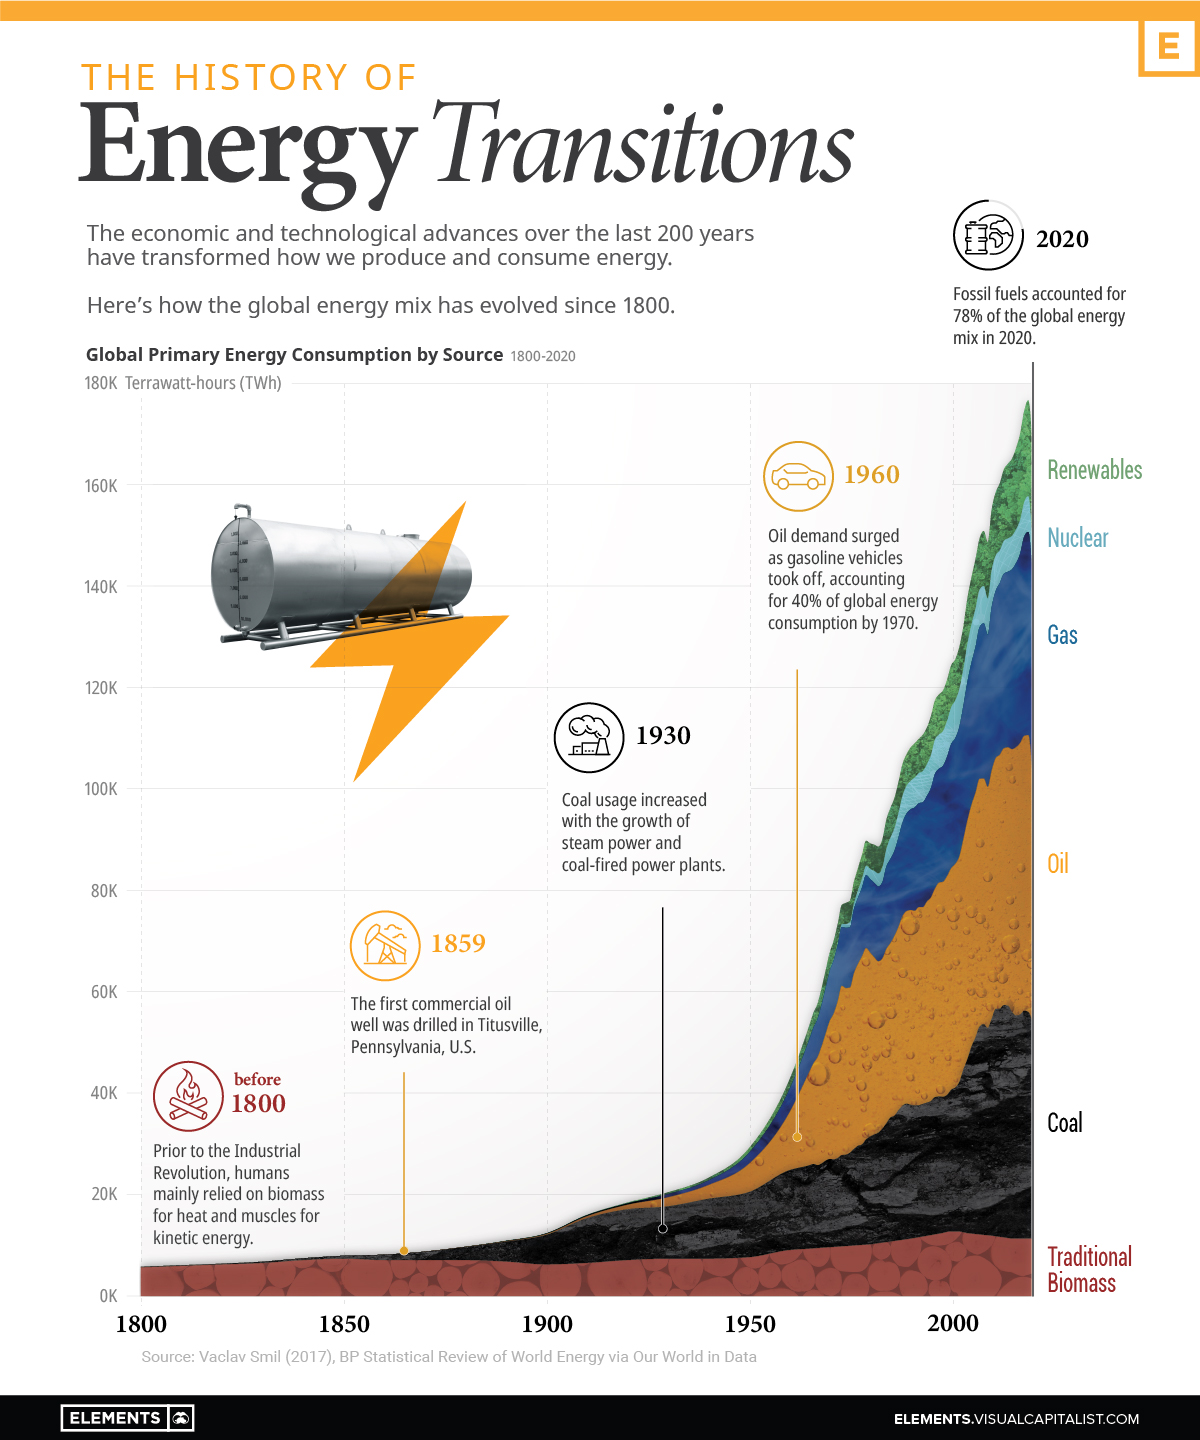
Over the last 200 years, how we’ve gotten our energy has changed drastically.
These changes were driven by innovations like the steam engine, oil lamps, internal combustion engines, and the wide-scale use of electricity. The shift from a primarily agrarian global economy to an industrial one called for new sources to provide more efficient energy inputs.
The current energy transition is powered by the realization that avoiding the catastrophic effects of climate change requires a reduction in greenhouse gas emissions. This infographic provides historical context for the ongoing shift away from fossil fuels using data from Our World in Data and scientist Vaclav Smil.
Coal and the First Energy Transition
Before the Industrial Revolution, people burned wood and dried manure to heat homes and cook food, while relying on muscle power, wind, and water mills to grind grains. Transportation was aided by using carts driven by horses or other animals.
In the 16th and 17th centuries, the prices of firewood and charcoal skyrocketed due to shortages. These were driven by increased consumption from both households and industries as economies grew and became more sophisticated.
Consequently, industrializing economies like the UK needed a new, cheaper source of energy. They turned to coal, marking the beginning of the first major energy transition.
| Year | Traditional Biomass % of Energy Mix | Coal % of Energy Mix |
|---|---|---|
| 1800 | 98.3% | 1.7% |
| 1820 | 97.6% | 2.4% |
| 1840 | 95.1% | 4.9% |
| 1860 | 86.8% | 13.3% |
| 1880 | 73.0% | 26.7% |
| 1900 | 50.4% | 47.2% |
| 1920 | 38.4% | 54.4% |
| 1940 | 31.6% | 50.7% |
As coal use and production increased, the cost of producing it fell due to economies of scale. Simultaneously, technological advances and adaptations brought about new ways to use coal.
The steam engine—one of the major technologies behind the Industrial Revolution—was heavily reliant on coal, and homeowners used coal to heat their homes and cook food. This is evident in the growth of coal’s share of the global energy mix, up from 1.7% in 1800 to 47.2% in 1900.
The Rise of Oil and Gas
In 1859, Edwin L. Drake built the first commercial oil well in Pennsylvania, but it was nearly a century later that oil became a major energy source.
Before the mass production of automobiles, oil was mainly used for lamps. Oil demand from internal combustion engine vehicles started climbing after the introduction of assembly lines, and it took off after World War II as vehicle purchases soared.
Similarly, the invention of the Bunsen burner opened up new opportunities to use natural gas in households. As pipelines came into place, gas became a major source of energy for home heating, cooking, water heaters, and other appliances.
| Year | Coal % of Energy Mix | Oil % of Energy Mix | Natural Gas % of Energy Mix |
|---|---|---|---|
| 1950 | 44.2% | 19.1% | 7.3% |
| 1960 | 37.0% | 26.6% | 10.7% |
| 1970 | 25.7% | 40.2% | 14.5% |
| 1980 | 23.8% | 40.6% | 16.3% |
| 1990 | 24.4% | 35.5% | 18.4% |
| 2000 | 22.5% | 35.1% | 19.7% |
Coal lost the home heating market to gas and electricity, and the transportation market to oil.
Despite this, it became the world’s most important source of electricity generation and still accounts for over one-third of global electricity production today.
The Transition to Renewable Energy
Renewable energy sources are at the center of the ongoing energy transition. As countries ramp up their efforts to curb emissions, solar and wind energy capacities are expanding globally.
Here’s how the share of renewables in the global energy mix changed over the last two decades:
| Year | Traditional Biomass | Renewables | Fossil Fuels | Nuclear Power |
|---|---|---|---|---|
| 2000 | 10.2% | 6.6% | 77.3% | 5.9% |
| 2005 | 8.7% | 6.5% | 79.4% | 5.4% |
| 2010 | 7.7% | 7.7% | 79.9% | 4.7% |
| 2015 | 6.9% | 9.2% | 79.9% | 4.0% |
| 2020 | 6.7% | 11.2% | 78.0% | 4.0% |
In the decade between 2000 and 2010, the share of renewables increased by just 1.1%. But the growth is speeding up—between 2010 and 2020, this figure stood at 3.5%.
Furthermore, the current energy transition is unprecedented in both scale and speed, with climate goals requiring net-zero emissions by 2050. That essentially means a complete fade-out of fossil fuels in less than 30 years and an inevitable rapid increase in renewable energy generation.
Renewable energy capacity additions were on track to set an annual record in 2021, following a record year in 2020. Additionally, global energy transition investment hit a record of $755 billion in 2021.
However, history shows that simply adding generation capacity is not enough to facilitate an energy transition. Coal required mines, canals, and railroads; oil required wells, pipelines, and refineries; electricity required generators and an intricate grid.
Similarly, a complete shift to low-carbon sources requires massive investments in natural resources, infrastructure, and grid storage, along with changes in our energy consumption habits.


Energy
Charted: 4 Reasons Why Lithium Could Be the Next Gold Rush
Visual Capitalist has partnered with EnergyX to show why drops in prices and growing demand may make now the right time to invest in lithium.


4 Reasons Why You Should Invest in Lithium
Lithium’s importance in powering EVs makes it a linchpin of the clean energy transition and one of the world’s most precious minerals.
In this graphic, Visual Capitalist partnered with EnergyX to explore why now may be the time to invest in lithium.
1. Lithium Prices Have Dropped
One of the most critical aspects of evaluating an investment is ensuring that the asset’s value is higher than its price would indicate. Lithium is integral to powering EVs, and, prices have fallen fast over the last year:
| Date | LiOH·H₂O* | Li₂CO₃** |
|---|---|---|
| Feb 2023 | $76 | $71 |
| March 2023 | $71 | $61 |
| Apr 2023 | $43 | $33 |
| May 2023 | $43 | $33 |
| June 2023 | $47 | $45 |
| July 2023 | $44 | $40 |
| Aug 2023 | $35 | $35 |
| Sept 2023 | $28 | $27 |
| Oct 2023 | $24 | $23 |
| Nov 2023 | $21 | $21 |
| Dec 2023 | $17 | $16 |
| Jan 2024 | $14 | $15 |
| Feb 2024 | $13 | $14 |
Note: Monthly spot prices were taken as close to the 14th of each month as possible.
*Lithium hydroxide monohydrate MB-LI-0033
**Lithium carbonate MB-LI-0029
2. Lithium-Ion Battery Prices Are Also Falling
The drop in lithium prices is just one reason to invest in the metal. Increasing economies of scale, coupled with low commodity prices, have caused the cost of lithium-ion batteries to drop significantly as well.
In fact, BNEF reports that between 2013 and 2023, the price of a Li-ion battery dropped by 82%.
| Year | Price per KWh |
|---|---|
| 2023 | $139 |
| 2022 | $161 |
| 2021 | $150 |
| 2020 | $160 |
| 2019 | $183 |
| 2018 | $211 |
| 2017 | $258 |
| 2016 | $345 |
| 2015 | $448 |
| 2014 | $692 |
| 2013 | $780 |

3. EV Adoption is Sustainable
One of the best reasons to invest in lithium is that EVs, one of the main drivers behind the demand for lithium, have reached a price point similar to that of traditional vehicle.
According to the Kelly Blue Book, Tesla’s average transaction price dropped by 25% between 2022 and 2023, bringing it in line with many other major manufacturers and showing that EVs are a realistic transport option from a consumer price perspective.
| Manufacturer | September 2022 | September 2023 |
|---|---|---|
| BMW | $69,000 | $72,000 |
| Ford | $54,000 | $56,000 |
| Volkswagon | $54,000 | $56,000 |
| General Motors | $52,000 | $53,000 |
| Tesla | $68,000 | $51,000 |
4. Electricity Demand in Transport is Growing
As EVs become an accessible transport option, there’s an investment opportunity in lithium. But possibly the best reason to invest in lithium is that the IEA reports global demand for the electricity in transport could grow dramatically by 2030:
| Transport Type | 2022 | 2025 | 2030 |
|---|---|---|---|
| Buses 🚌 | 23,000 GWh | 50,000 GWh | 130,000 GWh |
| Cars 🚙 | 65,000 GWh | 200,000 GWh | 570,000 GWh |
| Trucks 🛻 | 4,000 GWh | 15,000 GWh | 94,000 GWh |
| Vans 🚐 | 6,000 GWh | 16,000 GWh | 72,000 GWh |
The Lithium Investment Opportunity
Lithium presents a potentially classic investment opportunity. Lithium and battery prices have dropped significantly, and recently, EVs have reached a price point similar to other vehicles. By 2030, the demand for clean energy, especially in transport, will grow dramatically.
With prices dropping and demand skyrocketing, now is the time to invest in lithium.
EnergyX is poised to exploit lithium demand with cutting-edge lithium extraction technology capable of extracting 300% more lithium than current processes.

-

 Lithium2 days ago
Ranked: The Top 10 EV Battery Manufacturers in 2023
Asia dominates this ranking of the world’s largest EV battery manufacturers in 2023.
-

 Energy7 days ago
The World’s Biggest Nuclear Energy Producers
China has grown its nuclear capacity over the last decade, now ranking second on the list of top nuclear energy producers.
-

 Energy4 weeks ago
The World’s Biggest Oil Producers in 2023
Just three countries accounted for 40% of global oil production last year.
-

 Energy1 month ago
How Much Does the U.S. Depend on Russian Uranium?
Currently, Russia is the largest foreign supplier of nuclear power fuel to the U.S.
-

 Uranium2 months ago
Charted: Global Uranium Reserves, by Country
We visualize the distribution of the world’s uranium reserves by country, with 3 countries accounting for more than half of total reserves.
-

 Energy2 months ago
Visualizing the Rise of the U.S. as Top Crude Oil Producer
Over the last decade, the United States has established itself as the world’s top producer of crude oil, surpassing Saudi Arabia and Russia.


-

 Green1 week ago
Ranked: The Countries With the Most Air Pollution in 2023
-

 Automotive2 weeks ago
Almost Every EV Stock is Down After Q1 2024
-

 AI2 weeks ago
The Stock Performance of U.S. Chipmakers So Far in 2024
-

 Markets2 weeks ago
Charted: Big Four Market Share by S&P 500 Audits
-

 Real Estate2 weeks ago
Ranked: The Most Valuable Housing Markets in America
-

 Money2 weeks ago
Which States Have the Highest Minimum Wage in America?
-

 AI2 weeks ago
Ranked: Semiconductor Companies by Industry Revenue Share
-

 Travel2 weeks ago
Ranked: The World’s Top Flight Routes, by Revenue