Energy
Visualizing the Flow of U.S. Energy Consumption


Breaking Down America’s Energy Consumption in 2020
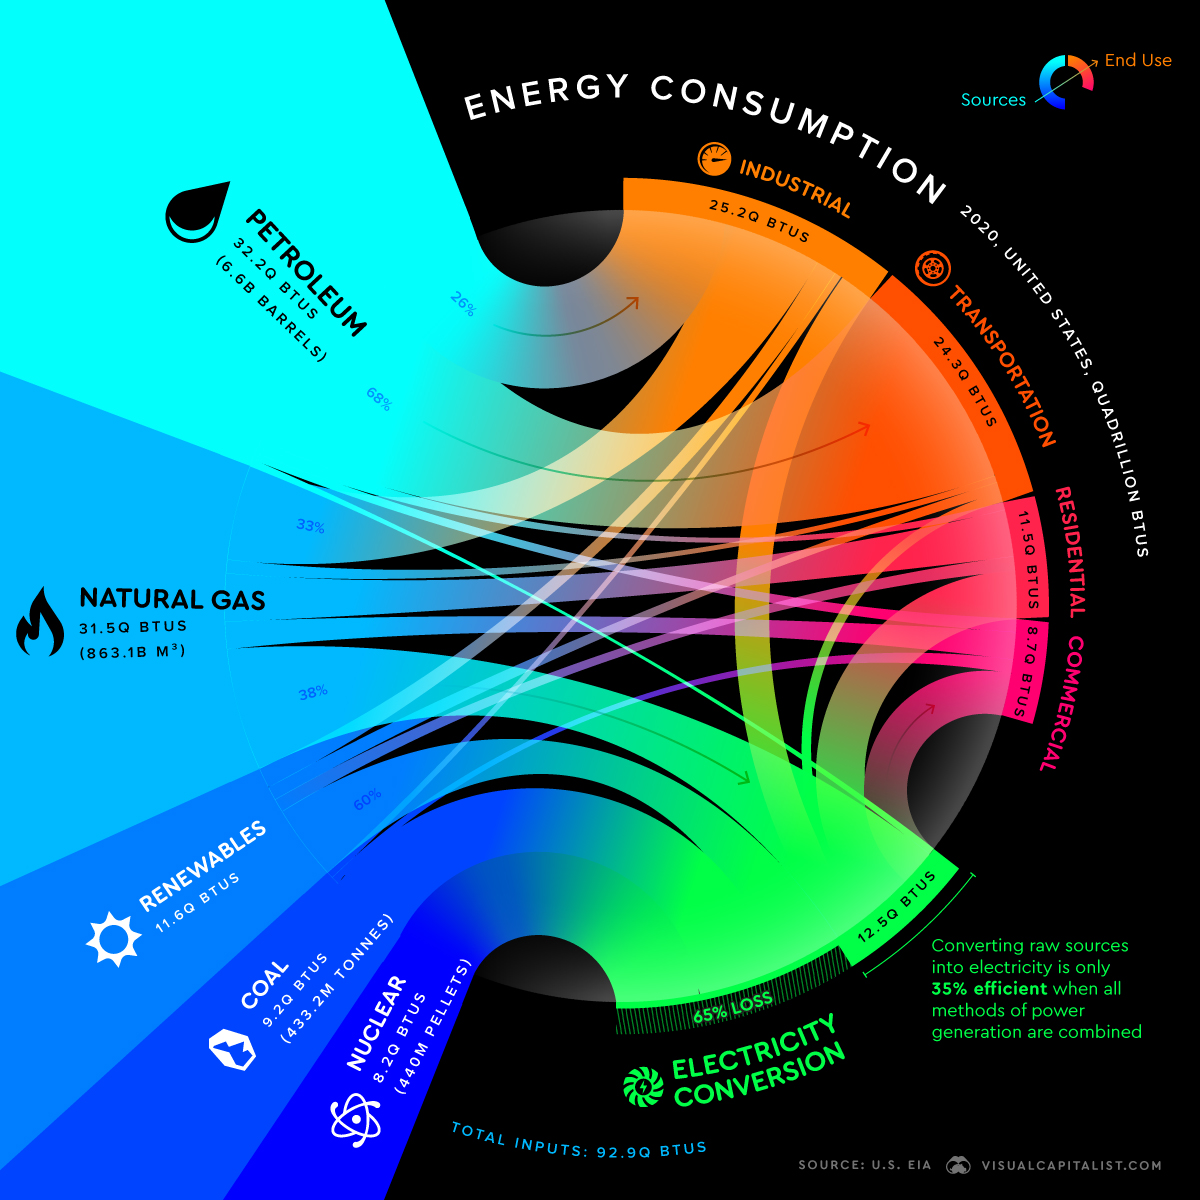
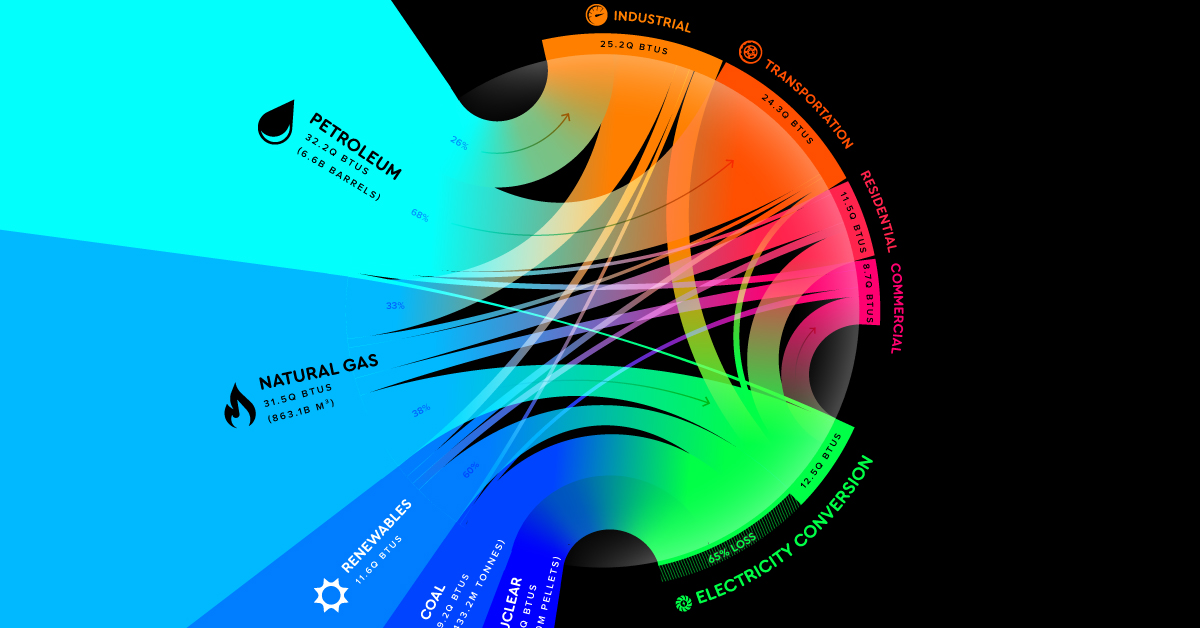
The United States relies on a complex mix of energy sources to fuel the country’s various end-sectors’ energy consumption.
While this energy mix is still dominated by fossil fuels, there are signs of a steady shift to renewable energy over the past decade.
This radial Sankey diagram using data from the EIA (Energy Information Administration) breaks down U.S. energy consumption in 2020, showing us how much each sector relies on various energy sources.
The Balance of Energy Production and Consumption
In 2019 and now in 2020, America’s domestic energy production has actually been greater than its consumption—a development that hasn’t taken place since 1957.
Last year’s numbers were severely impacted by the COVID-19 pandemic, seeing a 5% drop in energy production and a 7% drop in consumption compared to 2019. Total energy production and consumption for 2020 came in at 95.75 and 92.94 quads respectively.
The energy amounts are equalized and measured in quadrillion BTUs (British thermal units), also known as quads. A quad is a huge amount of energy, equivalent to 183 million barrels of petroleum or 36 million tonnes of coal.
So how is America’s overall energy production and consumption split between energy sources?
U.S. Energy Production and Consumption Share by Source
| Energy Source | Percentage of U.S. Energy Production | Percentage of U.S. Energy Consumption |
|---|---|---|
| Petroleum | 32% | 35% |
| Natural Gas | 36% | 34% |
| Renewable Energy | 12% | 12% |
| Coal | 11% | 10% |
| Nuclear | 9% | 9% |
Source: IEA
America’s new margin of energy production over consumption has resulted in the country being a net total energy exporter again, providing some flexibility as the country continues its transition towards more sustainable and renewable energy sources.
Fossil Fuels Still Dominate U.S. Energy Consumption
While America’s mix of energy consumption is fairly diverse, 79% of domestic energy consumption still originates from fossil fuels. Petroleum powers over 90% of the transportation sector’s consumption, and natural gas and petroleum make up 74% of the industrial sector’s direct energy consumption.
There are signs of change as consumption of the dirtiest fossil fuel, coal, has declined more than 58% since its peak in 2005. Coinciding with this declining coal dependence, consumption from renewable energy has increased for six years straight, setting record highs again in 2020.
However, fossil fuels still make up 79% of U.S. energy consumption, with renewables and nuclear accounting for the remaining 21%. The table below looks at the share of specific renewable energy sources in 2020.
Distribution of Renewable Energy Sources
| Renewable Energy Source | 2020 Energy Consumption in Quads | Share of 2020 Renewable Energy Consumption |
|---|---|---|
| Biomass | 4.52 | 39% |
| Wind | 3.01 | 26% |
| Hydroelectric | 2.55 | 22% |
| Solar | 1.27 | 11% |
| Geothermal | 0.23 | 2% |
Source: IEA
The Nuclear Necessity for a Zero-Emission Energy Transition
It’s not all up to renewable energy sources to clean up America’s energy mix, as nuclear power will play a vital role in reducing carbon emissions. Technically not a renewable energy source due to uranium’s finite nature, nuclear energy is still a zero-emission energy that has provided around 20% of total annual U.S. electricity since 1990.
Support for nuclear power has been growing slowly, and last year was the first which saw nuclear electricity generation overtake coal. However, this might not last as three nuclear plants including New York’s Indian Point nuclear plant are set to be decommissioned in 2021, with a fourth plant scheduled for retirement in 2022.
It’s worth noting that while other countries might have a higher share of nuclear energy in their total electricity generation, the U.S. still has the largest nuclear generation capacity worldwide and has generated more nuclear electricity than any other country in the world.
Converting Energy to Electricity
The energy produced by nuclear power plants doesn’t go directly to its end-use sector, rather, 100% of nuclear energy in the U.S. is converted to electricity which is sold to consumers. Along with nuclear, most energy sources aside from petroleum are primarily converted to electricity.
Unfortunately, electricity conversion is a fairly inefficient process, with around 65% of the energy lost in the conversion, transmission, and distribution of electricity.
This necessary but wasteful step allows for the storage of energy in electrical form, ensuring that it can be distributed properly. Working towards more efficient methods of energy to electricity conversion is an often forgotten aspect of reducing wasted energy.
Despite the dip in 2020, both energy production and consumption in the U.S. are forecasted to continue rising. As Biden aims to reduce greenhouse gas emissions by 50% by 2030 (from 2005 emission levels), U.S. energy consumption will inevitably continue to shift away from fossil fuels and towards renewable and nuclear energy.


Energy
Charted: 4 Reasons Why Lithium Could Be the Next Gold Rush
Visual Capitalist has partnered with EnergyX to show why drops in prices and growing demand may make now the right time to invest in lithium.


4 Reasons Why You Should Invest in Lithium
Lithium’s importance in powering EVs makes it a linchpin of the clean energy transition and one of the world’s most precious minerals.
In this graphic, Visual Capitalist partnered with EnergyX to explore why now may be the time to invest in lithium.
1. Lithium Prices Have Dropped
One of the most critical aspects of evaluating an investment is ensuring that the asset’s value is higher than its price would indicate. Lithium is integral to powering EVs, and, prices have fallen fast over the last year:
| Date | LiOH·H₂O* | Li₂CO₃** |
|---|---|---|
| Feb 2023 | $76 | $71 |
| March 2023 | $71 | $61 |
| Apr 2023 | $43 | $33 |
| May 2023 | $43 | $33 |
| June 2023 | $47 | $45 |
| July 2023 | $44 | $40 |
| Aug 2023 | $35 | $35 |
| Sept 2023 | $28 | $27 |
| Oct 2023 | $24 | $23 |
| Nov 2023 | $21 | $21 |
| Dec 2023 | $17 | $16 |
| Jan 2024 | $14 | $15 |
| Feb 2024 | $13 | $14 |
Note: Monthly spot prices were taken as close to the 14th of each month as possible.
*Lithium hydroxide monohydrate MB-LI-0033
**Lithium carbonate MB-LI-0029
2. Lithium-Ion Battery Prices Are Also Falling
The drop in lithium prices is just one reason to invest in the metal. Increasing economies of scale, coupled with low commodity prices, have caused the cost of lithium-ion batteries to drop significantly as well.
In fact, BNEF reports that between 2013 and 2023, the price of a Li-ion battery dropped by 82%.
| Year | Price per KWh |
|---|---|
| 2023 | $139 |
| 2022 | $161 |
| 2021 | $150 |
| 2020 | $160 |
| 2019 | $183 |
| 2018 | $211 |
| 2017 | $258 |
| 2016 | $345 |
| 2015 | $448 |
| 2014 | $692 |
| 2013 | $780 |

3. EV Adoption is Sustainable
One of the best reasons to invest in lithium is that EVs, one of the main drivers behind the demand for lithium, have reached a price point similar to that of traditional vehicle.
According to the Kelly Blue Book, Tesla’s average transaction price dropped by 25% between 2022 and 2023, bringing it in line with many other major manufacturers and showing that EVs are a realistic transport option from a consumer price perspective.
| Manufacturer | September 2022 | September 2023 |
|---|---|---|
| BMW | $69,000 | $72,000 |
| Ford | $54,000 | $56,000 |
| Volkswagon | $54,000 | $56,000 |
| General Motors | $52,000 | $53,000 |
| Tesla | $68,000 | $51,000 |
4. Electricity Demand in Transport is Growing
As EVs become an accessible transport option, there’s an investment opportunity in lithium. But possibly the best reason to invest in lithium is that the IEA reports global demand for the electricity in transport could grow dramatically by 2030:
| Transport Type | 2022 | 2025 | 2030 |
|---|---|---|---|
| Buses 🚌 | 23,000 GWh | 50,000 GWh | 130,000 GWh |
| Cars 🚙 | 65,000 GWh | 200,000 GWh | 570,000 GWh |
| Trucks 🛻 | 4,000 GWh | 15,000 GWh | 94,000 GWh |
| Vans 🚐 | 6,000 GWh | 16,000 GWh | 72,000 GWh |
The Lithium Investment Opportunity
Lithium presents a potentially classic investment opportunity. Lithium and battery prices have dropped significantly, and recently, EVs have reached a price point similar to other vehicles. By 2030, the demand for clean energy, especially in transport, will grow dramatically.
With prices dropping and demand skyrocketing, now is the time to invest in lithium.
EnergyX is poised to exploit lithium demand with cutting-edge lithium extraction technology capable of extracting 300% more lithium than current processes.

-

 Lithium2 days ago
Ranked: The Top 10 EV Battery Manufacturers in 2023
Asia dominates this ranking of the world’s largest EV battery manufacturers in 2023.
-

 Energy1 week ago
The World’s Biggest Nuclear Energy Producers
China has grown its nuclear capacity over the last decade, now ranking second on the list of top nuclear energy producers.
-

 Energy4 weeks ago
The World’s Biggest Oil Producers in 2023
Just three countries accounted for 40% of global oil production last year.
-

 Energy1 month ago
How Much Does the U.S. Depend on Russian Uranium?
Currently, Russia is the largest foreign supplier of nuclear power fuel to the U.S.
-

 Uranium2 months ago
Charted: Global Uranium Reserves, by Country
We visualize the distribution of the world’s uranium reserves by country, with 3 countries accounting for more than half of total reserves.
-

 Energy3 months ago
Visualizing the Rise of the U.S. as Top Crude Oil Producer
Over the last decade, the United States has established itself as the world’s top producer of crude oil, surpassing Saudi Arabia and Russia.


-

 Markets1 week ago
U.S. Debt Interest Payments Reach $1 Trillion
-

 Business2 weeks ago
Charted: Big Four Market Share by S&P 500 Audits
-

 Real Estate2 weeks ago
Ranked: The Most Valuable Housing Markets in America
-

 Money2 weeks ago
Which States Have the Highest Minimum Wage in America?
-

 AI2 weeks ago
Ranked: Semiconductor Companies by Industry Revenue Share
-

 Markets2 weeks ago
Ranked: The World’s Top Flight Routes, by Revenue
-

 Demographics2 weeks ago
Population Projections: The World’s 6 Largest Countries in 2075
-

 Markets2 weeks ago
The Top 10 States by Real GDP Growth in 2023