Technology
Visualizing the Critical Metals in a Smartphone
![]() Subscribe to the Elements free mailing list for more like this
Subscribe to the Elements free mailing list for more like this


Visualizing the Critical Metals in a Smartphone
In an increasingly connected world, smartphones have become an inseparable part of our lives.
Over 60% of the world’s population owns a mobile phone and smartphone adoption continues to rise in developing countries around the world.
While each brand has its own mix of components, whether it’s a Samsung or an iPhone, most smartphones can carry roughly 80% of the stable elements on the periodic table.
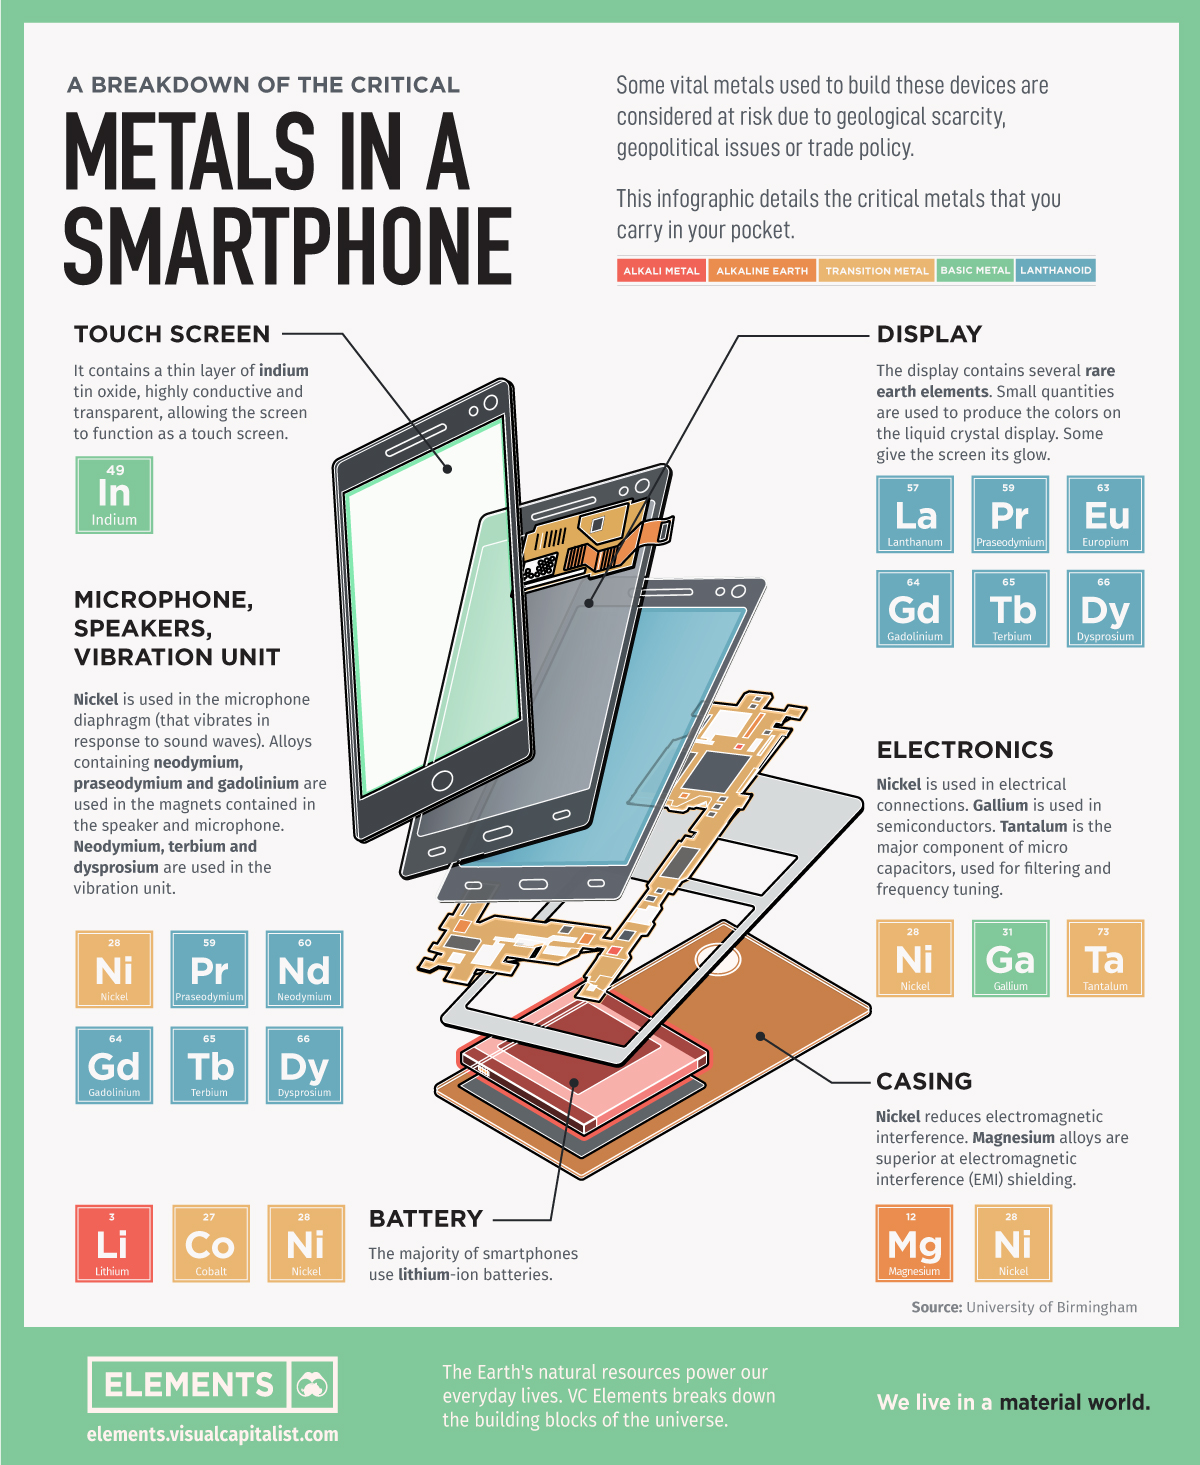
But some of the vital metals to build these devices are considered at risk due to geological scarcity, geopolitical issues, and other factors.
| Smartphone Part | Critical Metal |
|---|---|
| Touch Screen | indium |
| Display | lanthanum; gadolinium; praseodymium; europium; terbium; dysprosium |
| Electronics | nickel, gallium, tantalum |
| Casing | nickel, magnesium |
| Battery | lithium, nickel, cobalt |
| Microphone, speakers, vibration unit | nickel, praseodymium, neodymium, gadolinium, terbium, dysprosium |
What’s in Your Pocket?
This infographic based on data from the University of Birmingham details all the critical metals that you carry in your pocket with your smartphone.
1. Touch Screen
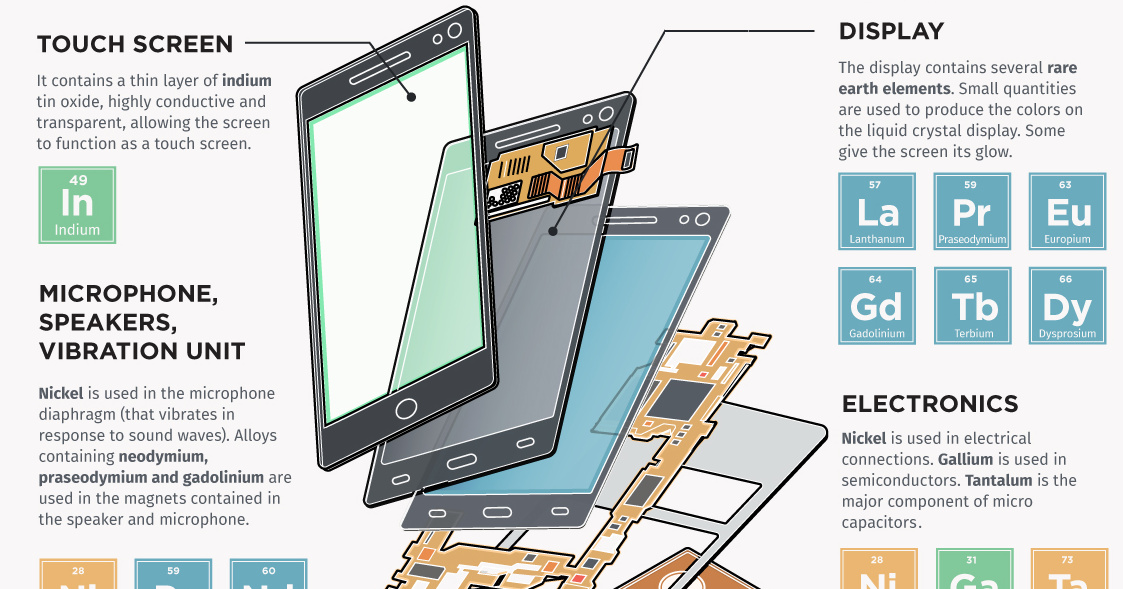
Screens are made up of multiple layers of glass and plastic, coated with a conductor material called indium which is highly conductive and transparent.
Indium responds when contacted by another electrical conductor, like our fingers.
When we touch the screen, an electric circuit is completed where the finger makes contact with the screen, changing the electrical charge at this location. The device registers this electrical charge as a “touch event”, then prompting a response.
2. Display
Smartphones screens display images on a liquid crystal display (LCD). Just like in most TVs and computer monitors, a phone LCD uses an electrical current to adjust the color of each pixel.
Several rare earth elements are used to produce the colors on screen.
3. Electronics
Smartphones employ multiple antenna systems, such as Bluetooth, GPS, and WiFi.
The distance between these antenna systems is usually small making it extremely difficult to achieve flawless performance. Capacitors made of the rare, hard, blue-gray metal tantalum are used for filtering and frequency tuning.
Nickel is also used in capacitors and in mobile phone electrical connections. Another silvery metal, gallium, is used in semiconductors.
4. Microphone, Speakers, Vibration Unit
Nickel is used in the microphone diaphragm (that vibrates in response to sound waves).
Alloys containing rare earths neodymium, praseodymium and gadolinium are used in the magnets contained in the speaker and microphone. Neodymium, terbium and dysprosium are also used in the vibration unit.
5. Casing
There are many materials used to make phone cases, such as plastic, aluminum, carbon fiber, and even gold. Commonly, the cases have nickel to reduce electromagnetic interference (EMI) and magnesium alloys for EMI shielding.
6. Battery
Unless you bought your smartphone a decade ago, your device most likely carries a lithium-ion battery, which is charged and discharged by lithium ions moving between the negative (anode) and positive (cathode) electrodes.
What’s Next?
Smartphones will naturally evolve as consumers look for ever-more useful features. Foldable phones, 5G technology with higher download speeds, and extra cameras are just a few of the changes expected.
As technology continues to improve, so will the demand for the metals necessary for the next generation of smartphones.
This post was originally featured on Elements
Technology
Visualizing AI Patents by Country
See which countries have been granted the most AI patents each year, from 2012 to 2022.


Visualizing AI Patents by Country
This was originally posted on our Voronoi app. Download the app for free on iOS or Android and discover incredible data-driven charts from a variety of trusted sources.
This infographic shows the number of AI-related patents granted each year from 2010 to 2022 (latest data available). These figures come from the Center for Security and Emerging Technology (CSET), accessed via Stanford University’s 2024 AI Index Report.
From this data, we can see that China first overtook the U.S. in 2013. Since then, the country has seen enormous growth in the number of AI patents granted each year.
| Year | China | EU and UK | U.S. | RoW | Global Total |
|---|---|---|---|---|---|
| 2010 | 307 | 137 | 984 | 571 | 1,999 |
| 2011 | 516 | 129 | 980 | 581 | 2,206 |
| 2012 | 926 | 112 | 950 | 660 | 2,648 |
| 2013 | 1,035 | 91 | 970 | 627 | 2,723 |
| 2014 | 1,278 | 97 | 1,078 | 667 | 3,120 |
| 2015 | 1,721 | 110 | 1,135 | 539 | 3,505 |
| 2016 | 1,621 | 128 | 1,298 | 714 | 3,761 |
| 2017 | 2,428 | 144 | 1,489 | 1,075 | 5,136 |
| 2018 | 4,741 | 155 | 1,674 | 1,574 | 8,144 |
| 2019 | 9,530 | 322 | 3,211 | 2,720 | 15,783 |
| 2020 | 13,071 | 406 | 5,441 | 4,455 | 23,373 |
| 2021 | 21,907 | 623 | 8,219 | 7,519 | 38,268 |
| 2022 | 35,315 | 1,173 | 12,077 | 13,699 | 62,264 |
In 2022, China was granted more patents than every other country combined.
While this suggests that the country is very active in researching the field of artificial intelligence, it doesn’t necessarily mean that China is the farthest in terms of capability.
Key Facts About AI Patents
According to CSET, AI patents relate to mathematical relationships and algorithms, which are considered abstract ideas under patent law. They can also have different meaning, depending on where they are filed.
In the U.S., AI patenting is concentrated amongst large companies including IBM, Microsoft, and Google. On the other hand, AI patenting in China is more distributed across government organizations, universities, and tech firms (e.g. Tencent).
In terms of focus area, China’s patents are typically related to computer vision, a field of AI that enables computers and systems to interpret visual data and inputs. Meanwhile America’s efforts are more evenly distributed across research fields.
Learn More About AI From Visual Capitalist
If you want to see more data visualizations on artificial intelligence, check out this graphic that shows which job departments will be impacted by AI the most.

-

 Markets1 week ago
U.S. Debt Interest Payments Reach $1 Trillion
-

 Business2 weeks ago
Charted: Big Four Market Share by S&P 500 Audits
-

 Real Estate2 weeks ago
Ranked: The Most Valuable Housing Markets in America
-

 Money2 weeks ago
Which States Have the Highest Minimum Wage in America?
-

 AI2 weeks ago
Ranked: Semiconductor Companies by Industry Revenue Share
-

 Markets2 weeks ago
Ranked: The World’s Top Flight Routes, by Revenue
-

 Demographics2 weeks ago
Population Projections: The World’s 6 Largest Countries in 2075
-

 Markets2 weeks ago
The Top 10 States by Real GDP Growth in 2023