Mining
Visualizing the Abundance of Elements in the Earth’s Crust
![]() Subscribe to the Elements free mailing list for more like this
Subscribe to the Elements free mailing list for more like this


Visualizing the Abundance of Elements in the Earth’s Crust
This was originally posted on Elements. Sign up to the free mailing list to get beautiful visualizations on natural resource megatrends in your email every week.
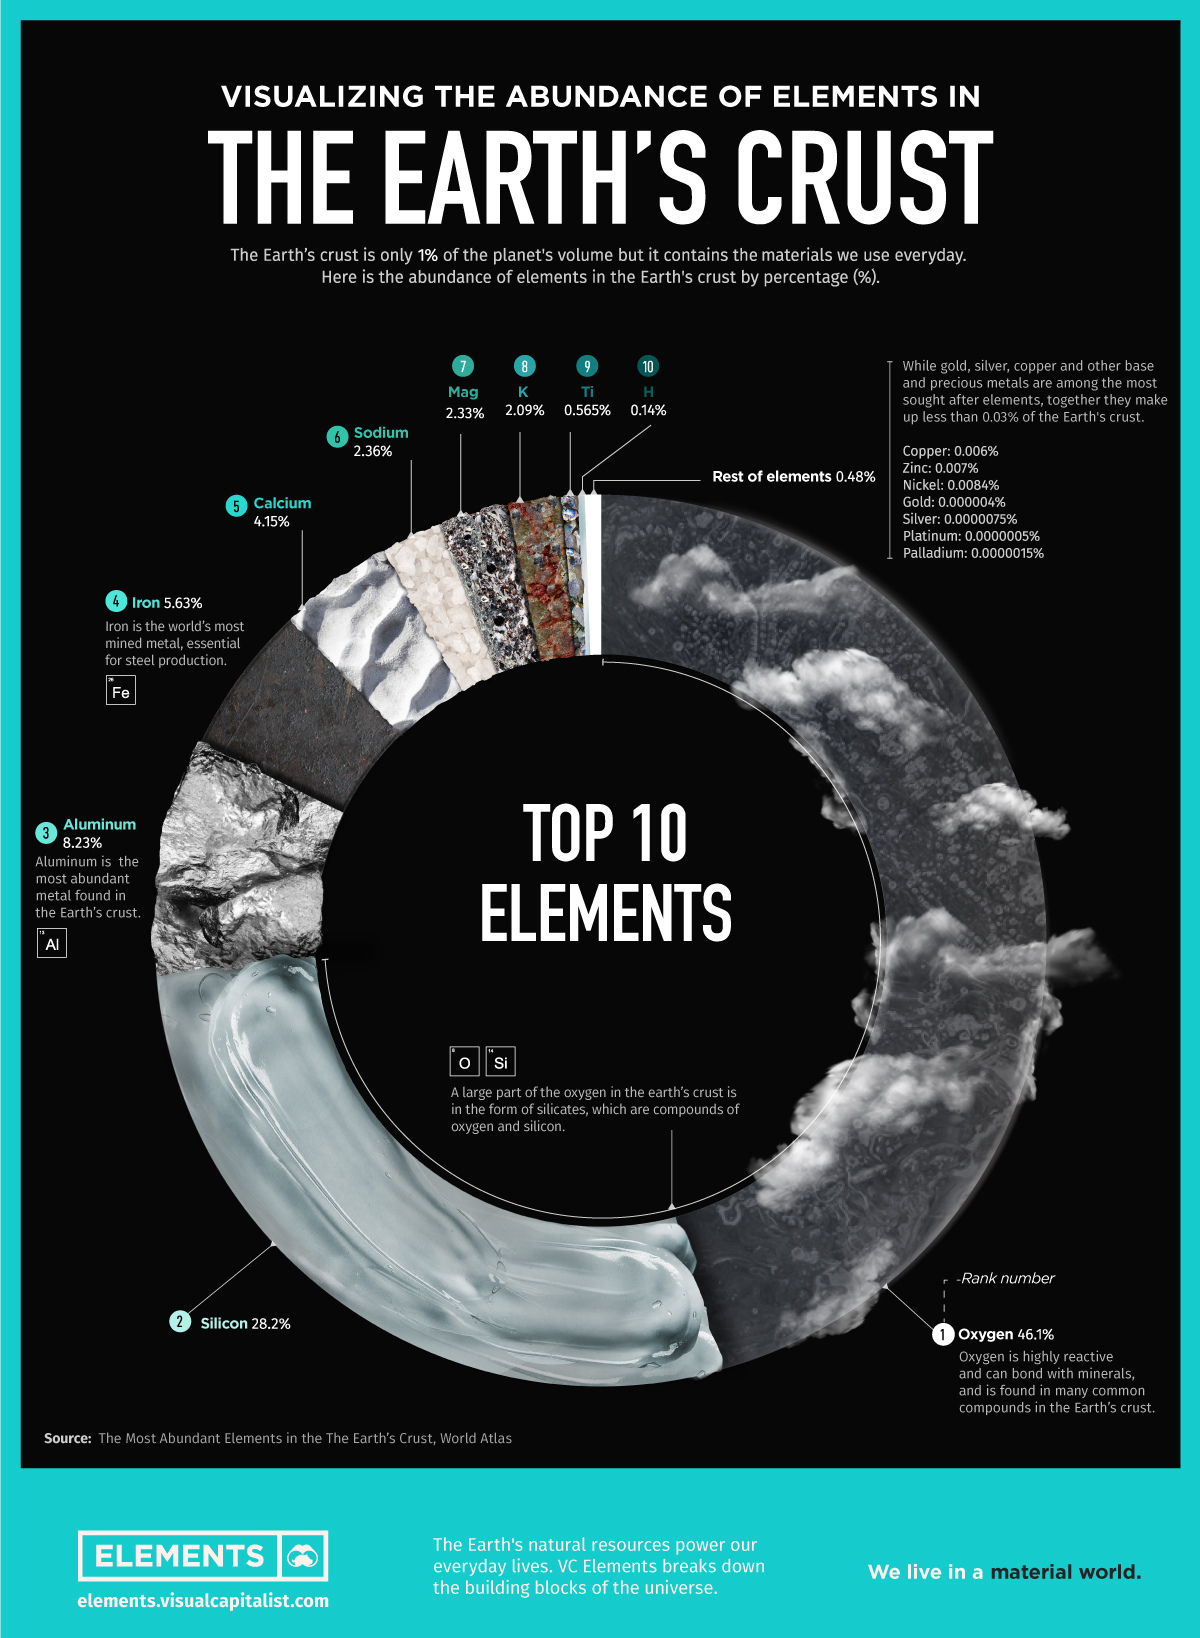
Elements in the Earth’s crust provide all the basic building blocks for mankind.
But even though the crust is the source of everything we find, mine, refine, and build, it really is just scratching the surface of our planet.
After all, the innermost layer of the Earth, the core, represents 15% of the planet’s volume, whereas the mantle occupies 84%. Representing the remaining 1% is the crust, a thin layer that ranges in depth from approximately 5-70 km (~3-44 miles).
This infographic takes a look at what elements make up this 1%, based on data from WorldAtlas.
Earth’s Crust Elements
The crust is a rigid surface containing both the oceans and landmasses. Most elements are found in only trace amounts within the Earth’s crust, but several are abundant.
The Earth’s crust comprises about 95% igneous and metamorphic rocks, 4% shale, 0.75% sandstone, and 0.25% limestone.
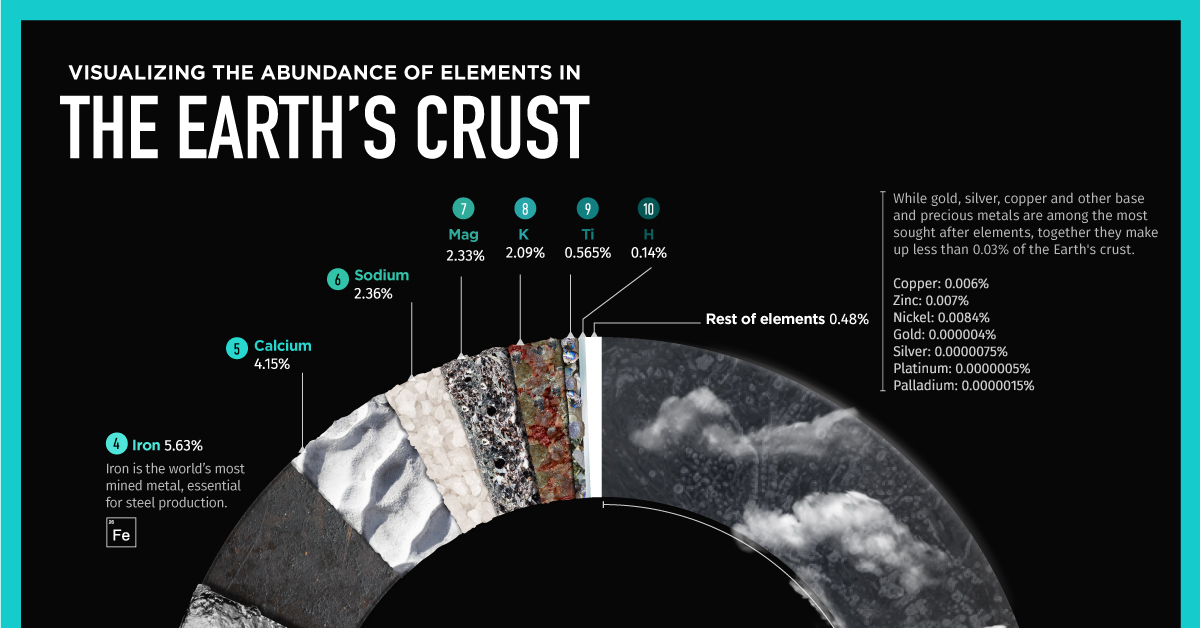
Oxygen, silicon, aluminum, and iron account for 88.1% of the mass of the Earth’s crust, while another 90 elements make up the remaining 11.9%.
| Rank | Element | % of Earth's Crust |
|---|---|---|
| 1 | Oxygen (O) | 46.1% |
| 2 | Silicon (Si) | 28.2% |
| 3 | Aluminum (Al) | 8.2% |
| 4 | Iron (Fe) | 5.6% |
| 5 | Calcium (Ca) | 4.1% |
| 6 | Sodium (Na) | 2.3% |
| 7 | Magnesium (Mg) | 2.3% |
| 8 | Potassium (K) | 2.0% |
| 9 | Titanium (Ti) | 0.5% |
| 10 | Hydrogen (H) | 0.1% |
| Other elements | 0.5% | |
| Total | 100.0% |
While gold, silver, copper and other base and precious metals are among the most sought after elements, together they make up less than 0.03% of the Earth’s crust by mass.
#1: Oxygen
Oxygen is by far the most abundant element in the Earth’s crust, making up 46% of mass—coming up just short of half of the total.
Oxygen is a highly reactive element that combines with other elements, forming oxides. Some examples of common oxides are minerals such as granite and quartz (oxides of silicon), rust (oxides of iron), and limestone (oxide of calcium and carbon).
#2: Silicon
More than 90% of the Earth’s crust is composed of silicate minerals, making silicon the second most abundant element in the Earth’s crust.
Silicon links up with oxygen to form the most common minerals on Earth. For example, in most places, sand primarily consists of silica (silicon dioxide) usually in the form of quartz. Silicon is an essential semiconductor, used in manufacturing electronics and computer chips.
#3: Aluminum
Aluminum is the third most common element in the Earth’s crust.
Because of its strong affinity for oxygen, aluminum is rarely found in its elemental state. Aluminum oxide (Al2O3), aluminum hydroxide (Al(OH)3) and potassium aluminum sulphate (KAl(SO4)2) are common aluminum compounds.
Aluminum and aluminum alloys have a variety of uses, from kitchen foil to rocket manufacturing.
#4: Iron
The fourth most common element in the Earth’s crust is iron, accounting for over 5% of the mass of the Earth’s crust.
Iron is obtained chiefly from the minerals hematite and magnetite. Of all the metals we mine, over 90% is iron, mainly to make steel, an alloy of carbon and iron. Iron is also an essential nutrient in the human body.
#5: Calcium
Calcium makes up about 4.2% of the planet’s crust by weight.
In its pure elemental state, calcium is a soft, silvery-white alkaline earth metal. It is never found in its isolated state in nature but exists instead in compounds. Calcium compounds can be found in a variety of minerals, including limestone (calcium carbonate), gypsum (calcium sulphate) and fluorite (calcium fluoride).
Calcium compounds are widely used in the food and pharmaceutical industries for supplementation. They are also used as bleaches in the paper industry, as components in cement and electrical insulators, and in manufacturing soaps.
Digging the Earth’s Crust
Despite Jules Verne’s novel, no one has ever journeyed to the center of Earth.
In fact, the deepest hole ever dug by humanity reaches approximately 12 km (7.5 miles) below the Earth’s surface, about one-third of the way to the Earth’s mantle. This incredible depth took about 20 years to reach.
Although mankind is constantly making new discoveries and reaching for the stars, there is still a lot to explore about the Earth we stand on.


Lithium
Ranked: The Top 10 EV Battery Manufacturers in 2023
Asia dominates this ranking of the world’s largest EV battery manufacturers in 2023.


The Top 10 EV Battery Manufacturers in 2023
This was originally posted on our Voronoi app. Download the app for free on iOS or Android and discover incredible data-driven charts from a variety of trusted sources.
Despite efforts from the U.S. and EU to secure local domestic supply, all major EV battery manufacturers remain based in Asia.
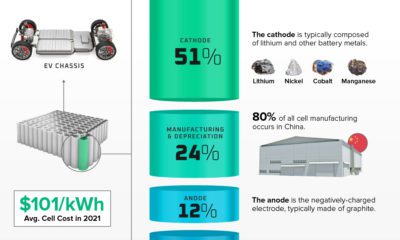
In this graphic we rank the top 10 EV battery manufacturers by total battery deployment (measured in megawatt-hours) in 2023. The data is from EV Volumes.
Chinese Dominance
Contemporary Amperex Technology Co. Limited (CATL) has swiftly risen in less than a decade to claim the title of the largest global battery group.
The Chinese company now has a 34% share of the market and supplies batteries to a range of made-in-China vehicles, including the Tesla Model Y, SAIC’s MG4/Mulan, and various Li Auto models.
| Company | Country | 2023 Production (megawatt-hour) | Share of Total Production |
|---|---|---|---|
| CATL | 🇨🇳 China | 242,700 | 34% |
| BYD | 🇨🇳 China | 115,917 | 16% |
| LG Energy Solution | 🇰🇷 Korea | 108,487 | 15% |
| Panasonic | 🇯🇵 Japan | 56,560 | 8% |
| SK On | 🇰🇷 Korea | 40,711 | 6% |
| Samsung SDI | 🇰🇷 Korea | 35,703 | 5% |
| CALB | 🇨🇳 China | 23,493 | 3% |
| Farasis Energy | 🇨🇳 China | 16,527 | 2% |
| Envision AESC | 🇨🇳 China | 8,342 | 1% |
| Sunwoda | 🇨🇳 China | 6,979 | 1% |
| Other | - | 56,040 | 8% |
In 2023, BYD surpassed LG Energy Solution to claim second place. This was driven by demand from its own models and growth in third-party deals, including providing batteries for the made-in-Germany Tesla Model Y, Toyota bZ3, Changan UNI-V, Venucia V-Online, as well as several Haval and FAW models.
The top three battery makers (CATL, BYD, LG) collectively account for two-thirds (66%) of total battery deployment.
Once a leader in the EV battery business, Panasonic now holds the fourth position with an 8% market share, down from 9% last year. With its main client, Tesla, now sourcing batteries from multiple suppliers, the Japanese battery maker seems to be losing its competitive edge in the industry.
Overall, the global EV battery market size is projected to grow from $49 billion in 2022 to $98 billion by 2029, according to Fortune Business Insights.

-

 Green1 week ago
Ranked: The Countries With the Most Air Pollution in 2023
-

 Automotive2 weeks ago
Almost Every EV Stock is Down After Q1 2024
-

 AI2 weeks ago
The Stock Performance of U.S. Chipmakers So Far in 2024
-

 Markets2 weeks ago
Charted: Big Four Market Share by S&P 500 Audits
-

 Real Estate2 weeks ago
Ranked: The Most Valuable Housing Markets in America
-

 Money2 weeks ago
Which States Have the Highest Minimum Wage in America?
-

 AI2 weeks ago
Ranked: Semiconductor Companies by Industry Revenue Share
-

 Travel2 weeks ago
Ranked: The World’s Top Flight Routes, by Revenue