Money
Visualizing the $94 Trillion World Economy in One Chart
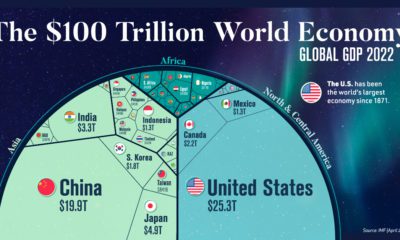
Check out the latest 2023 update of the world economy in one chart.

View the expanded version of this infographic to see all countries.
 Can I share this graphic?
 When do I need a license?
 Interested in this piece?
The $94 Trillion World Economy in One Chart
Check out the latest 2023 update of the world economy in one chart.
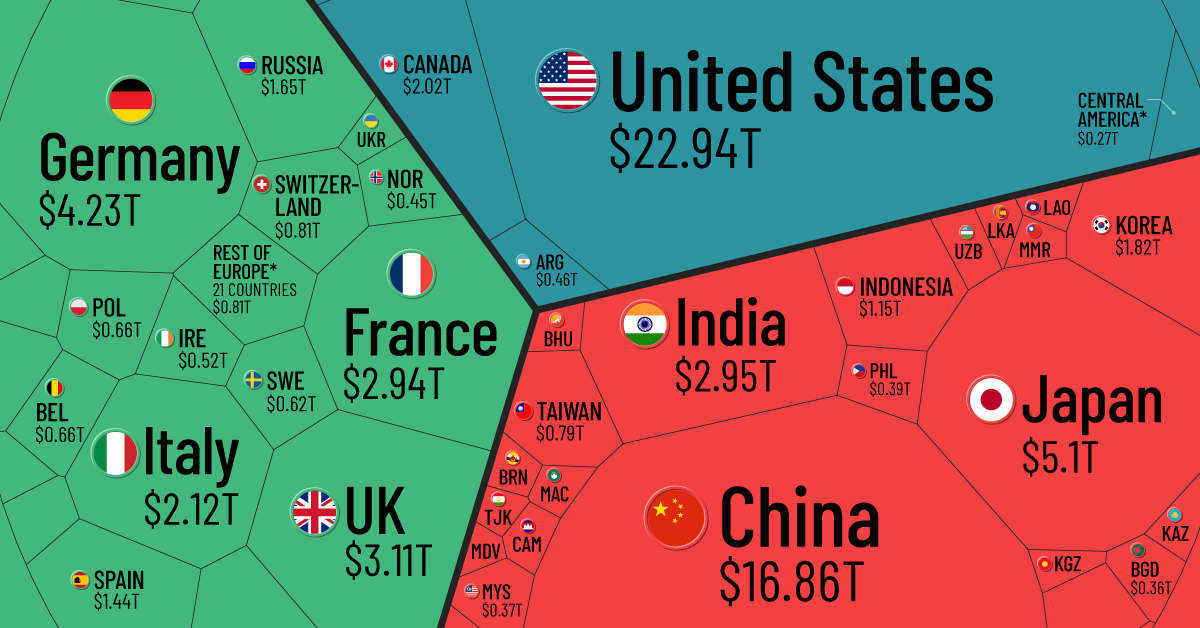
Just four countries—the U.S., China, Japan, and Germany—make up over half of the world’s economic output by gross domestic product (GDP) in nominal terms. In fact, the GDP of the U.S. alone is greater than the combined GDP of 170 countries.
How do the different economies of the world compare? In this visualization we look at GDP by country in 2021, using data and estimates from the International Monetary Fund (IMF).
An Overview of GDP
GDP serves as a broad indicator for a country’s economic output. It measures the total market value of final goods and services produced in a country in a specific timeframe, such as a quarter or year. In addition, GDP also takes into consideration the output of services provided by the government, such as money spent on defense, healthcare, or education.
Generally speaking, when GDP is increasing in a country, it is a sign of greater economic activity that benefits workers and businesses (while the reverse is true for a decline).
The World Economy: Top 50 Countries
Who are the biggest contributors to the global economy? Here is the ranking of the 50 largest countries by GDP in 2021:
| Rank | Country | GDP ($T) | % of Global GDP |
|---|---|---|---|
| 1 | 🇺🇸 U.S. | $22.9 | 24.4% |
| 2 | 🇨🇳 China | $16.9 | 17.9% |
| 3 | 🇯🇵 Japan | $5.1 | 5.4% |
| 4 | 🇩🇪 Germany | $4.2 | 4.5% |
| 5 | 🇬🇧 UK | $3.1 | 3.3% |
| 6 | 🇮🇳 India | $2.9 | 3.1% |
| 7 | 🇫🇷 France | $2.9 | 3.1% |
| 8 | 🇮🇹 Italy | $2.1 | 2.3% |
| 9 | 🇨🇦 Canada | $2.0 | 2.1% |
| 10 | 🇰🇷 Korea | $1.8 | 1.9% |
| 11 | 🇷🇺 Russia | $1.6 | 1.7% |
| 12 | 🇧🇷 Brazil | $1.6 | 1.7% |
| 13 | 🇦🇺 Australia | $1.6 | 1.7% |
| 14 | 🇪🇸 Spain | $1.4 | 1.5% |
| 15 | 🇲🇽 Mexico | $1.3 | 1.4% |
| 16 | 🇮🇩 Indonesia | $1.2 | 1.2% |
| 17 | 🇮🇷 Iran | $1.1 | 1.1% |
| 18 | 🇳🇱 Netherlands | $1.0 | 1.1% |
| 19 | 🇸🇦 Saudi Arabia | $0.8 | 0.9% |
| 20 | 🇨🇭 Switzerland | $0.8 | 0.9% |
| 21 | 🇹🇷 Turkey | $0.8 | 0.8% |
| 22 | 🇹🇼 Taiwan | $0.8 | 0.8% |
| 23 | 🇵🇱 Poland | $0.7 | 0.7% |
| 24 | 🇸🇪 Sweden | $0.6 | 0.7% |
| 25 | 🇧🇪 Belgium | $0.6 | 0.6% |
| 26 | 🇹🇭 Thailand | $0.5 | 0.6% |
| 27 | 🇮🇪 Ireland | $0.5 | 0.5% |
| 28 | 🇦🇹 Austria | $0.5 | 0.5% |
| 29 | 🇳🇬 Nigeria | $0.5 | 0.5% |
| 30 | 🇮🇱 Israel | $0.5 | 0.5% |
| 31 | 🇦🇷 Argentina | $0.5 | 0.5% |
| 32 | 🇳🇴 Norway | $0.4 | 0.5% |
| 33 | 🇿🇦 South Africa | $0.4 | 0.4% |
| 34 | 🇦🇪 UAE | $0.4 | 0.4% |
| 35 | 🇩🇰 Denmark | $0.4 | 0.4% |
| 36 | 🇪🇬 Egypt | $0.4 | 0.4% |
| 37 | 🇵🇭 Philippines | $0.4 | 0.4% |
| 38 | 🇸🇬 Singapore | $0.4 | 0.4% |
| 39 | 🇲🇾 Malaysia | $0.4 | 0.4% |
| 40 | 🇭🇰 Hong Kong SAR | $0.4 | 0.4% |
| 41 | 🇻🇳 Vietnam | $0.4 | 0.4% |
| 42 | 🇧🇩 Bangladesh | $0.4 | 0.4% |
| 43 | 🇨🇱 Chile | $0.3 | 0.4% |
| 44 | 🇨🇴 Colombia | $0.3 | 0.3% |
| 45 | 🇫🇮 Finland | $0.3 | 0.3% |
| 46 | 🇷🇴 Romania | $0.3 | 0.3% |
| 47 | 🇨🇿 Czech Republic | $0.3 | 0.3% |
| 48 | 🇵🇹 Portugal | $0.3 | 0.3% |
| 49 | 🇵🇰 Pakistan | $0.3* | 0.3% |
| 50 | 🇳🇿 New Zealand | $0.2 | 0.3% |
*2020 GDP (latest available) used where IMF estimates for 2021 were unavailable.
At $22.9 trillion, the U.S. GDP accounts for roughly 25% of the global economy, a share that has actually changed significantly over the last 60 years. The finance, insurance, and real estate ($4.7 trillion) industries add the most to the country’s economy, followed by professional and business services ($2.7 trillion) and government ($2.6 trillion).
China’s economy is second in nominal terms, hovering at near $17 trillion in GDP. It remains the largest manufacturer worldwide based on output with extensive production of steel, electronics, and robotics, among others.
The largest economy in Europe is Germany, which exports roughly 20% of the world’s motor vehicles. In 2019, overall trade equaled nearly 90% of the country’s GDP.
The World Economy: 50 Smallest Countries
On the other end of the spectrum are the world’s smallest economies by GDP, primarily developing and island nations.
With a GDP of $70 million, Tuvalu is the smallest economy in the world. Situated between Hawaii and Australia, the largest industry of this volcanic archipelago relies on territorial fishing rights.
In addition, the country earns significant revenue from its “.tv” web domain. Between 2011 and 2019, it earned $5 million annually from companies—including Amazon-owned Twitch to license the Twitch.tv domain name—equivalent to roughly 7% of the country’s GDP.
| Countries | Region | GDP (B) |
|---|---|---|
| 🇹🇻 Tuvalu | Oceania | $0.07 |
| 🇳🇷 Nauru | Oceania | $0.1 |
| 🇵🇼 Palau | Oceania | $0.2 |
| 🇰🇮 Kiribati | Oceania | $0.2 |
| 🇲🇭 Marshall Islands | Oceania | $0.2 |
| 🇫🇲 Micronesia | Oceania | $0.4 |
| 🇨🇰 Cook Islands | Oceania | $0.4* |
| 🇹🇴 Tonga | Oceania | $0.5 |
| 🇸🇹 São Tomé and Príncipe | Africa | $0.5 |
| 🇩🇲 Dominica | Caribbean | $0.6 |
| 🇻🇨 St. Vincent and the Grenadines | Caribbean | $0.8 |
| 🇼🇸 Samoa | Oceania | $0.8 |
| 🇰🇳 St. Kitts and Nevis | Caribbean | $1.0 |
| 🇻🇺 Vanuatu | Oceania | $1.0 |
| 🇬🇩 Grenada | Caribbean | $1.1 |
| 🇰🇲 Comoros | Africa | $1.3 |
| 🇸🇨 Seychelles | Africa | $1.3 |
| 🇦🇬 Antigua and Barbuda | Caribbean | $1.4 |
| 🇬🇼 Guinea-Bissau | Africa | $1.6 |
| 🇸🇧 Solomon Islands | Oceania | $1.7 |
| 🇹🇱 Timor-Leste | Asia | $1.7 |
| 🇱🇨 St. Lucia | Caribbean | $1.7 |
| 🇸🇲 San Marino | Europe | $1.7 |
| 🇨🇻 Cabo Verde | Africa | $1.9 |
| 🇧🇿 Belize | Central America | $1.9 |
| 🇬🇲 Gambia | Africa | $2.0 |
| 🇪🇷 Eritrea | Africa | $2.3 |
| 🇱🇸 Lesotho | Africa | $2.5 |
| 🇧🇹 Bhutan | Asia | $2.5 |
| 🇨🇫 Central African Republic | Africa | $2.6 |
| 🇸🇷 Suriname | South America | $2.8 |
| 🇦🇼 Aruba | Caribbean | $2.9 |
| 🇧🇮 Burundi | Africa | $3.2 |
| 🇦🇩 Andorra | Europe | $3.2 |
| 🇸🇸 South Sudan | Africa | $3.3 |
| 🇱🇷 Liberia | Africa | $3.4 |
| 🇩🇯 Djibouti | Africa | $3.7 |
| 🇸🇱 Sierra Leone | Africa | $4.4 |
| 🇸🇿 Eswatini | Africa | $4.5 |
| 🇲🇻 Maldives | Asia | $4.6 |
| 🇫🇯 Fiji | Oceania | $4.6 |
| 🇧🇧 Barbados | Caribbean | $4.7 |
| 🇸🇴 Somalia | Africa | $5.4 |
| 🇲🇪 Montenegro | Europe | $5.5 |
| 🇱🇮 Liechtenstein | Europe | $6.8* |
| 🇬🇾 Guyana | South America | $7.4 |
| 🇲🇨 Monaco | Europe | $7.4* |
| 🇹🇯 Tajikistan | Asia | $8.1 |
| 🇰🇬 Kyrgyz Republic | Asia | $8.2 |
| 🇹🇬 Togo | Africa | $8.5 |
*2019 GDP (latest available) used where IMF estimates for 2021 were unavailable.
Like Tuvalu, many of the world’s smallest economies are in Oceania, including Nauru, Palau, and Kiribati. Additionally, several countries above rely on the tourism industry for over one-third of their employment.
The Fastest Growing Economies in the World in 2021
With 123% projected GDP growth, Libya’s economy is estimated to have the sharpest rise.
Oil is propelling its growth, with 1.2 million barrels being pumped in the country daily. Along with this, exports and a depressed currency are among the primary factors behind its recovery.
| Rank | Country | Region | 2021 Real GDP Growth (Annual % Change) |
|---|---|---|---|
| 1 | 🇱🇾 Libya | Africa | 123.2% |
| 2 | 🇬🇾 Guyana | South America | 20.4% |
| 3 | 🇲🇴 Macao | Asia | 20.4% |
| 4 | 🇲🇻 Maldives | Asia | 18.9% |
| 5 | 🇮🇪 Ireland | Europe | 13.0% |
| 6 | 🇦🇼 Aruba | Caribbean | 12.8% |
| 7 | 🇵🇦 Panama | Central America | 12.0% |
| 8 | 🇨🇱 Chile | South America | 11.0% |
| 9 | 🇵🇪 Peru | South America | 10.0% |
| 10 | 🇩🇴 Dominican Republic | Caribbean | 9.5% |
Ireland’s economy, with a projected 13% real GDP growth, is being supported by the largest multinational corporations in the world. Facebook, TikTok, Google, Apple, and Pfizer all have their European headquarters in the country, which has a 12.5% corporate tax rate—or about half the global average. But these rates are set to change soon, as Ireland joined the OECD 15% minimum corporate tax rate agreement which was finalized in October 2021.
Macao’s economy bounced back after COVID-19 restrictions began to lift, but more storm clouds are on the horizon for the Chinese district. The CCP’s anti-corruption campaign and recent arrests could signal a more strained relationship between Mainland China and the world’s largest gambling hub.
Looking Ahead at the World’s GDP
The global GDP figure of $94 trillion may seem massive to us today, but such a total might seem much more modest in the future.
In 1970, the world economy was only about $3 trillion in GDP—or 30 times smaller than it is today. Over the next thirty years, the global economy is expected to more or less double again. By 2050, global GDP could total close to $180 trillion.
Correction: In earlier versions of this graphic, countries such as Vietnam and Pakistan were inadvertently not included in the visualization. They have now been added. In cases where the IMF has no data for 2021 (specifically Pakistan, Syria, Afghanistan, and Lebanon), the latest available data is used.


Money
Charted: Who Has Savings in This Economy?
Older, better-educated adults are winning the savings game, reveals a January survey by the National Opinion Research Center at the University of Chicago.


Who Has Savings in This Economy?
This was originally posted on our Voronoi app. Download the app for free on iOS or Android and discover incredible data-driven charts from a variety of trusted sources.
Two full years of inflation have taken their toll on American households. In 2023, the country’s collective credit card debt crossed $1 trillion for the first time. So who is managing to save money in the current economic environment?
We visualize the percentage of respondents to the statement “I have money leftover at the end of the month” categorized by age and education qualifications. Data is sourced from a National Endowment for Financial Education (NEFE) report, published last month.
The survey for NEFE was conducted from January 12-14, 2024, by the National Opinion Research Center at the University of Chicago. It involved 1,222 adults aged 18+ and aimed to be representative of the U.S. population.
Older Americans Save More Than Their Younger Counterparts
General trends from this dataset indicate that as respondents get older, a higher percentage of them are able to save.
| Age | Always/Often | Sometimes | Rarely/Never |
|---|---|---|---|
| 18–29 | 29% | 33% | 38% |
| 30–44 | 36% | 27% | 37% |
| 45–59 | 39% | 23% | 38% |
| Above 60 | 49% | 28% | 23% |
| All Adults | 39% | 33% | 27% |
Note: Percentages are rounded and may not sum to 100.
Perhaps not surprisingly, those aged 60+ are the age group with the highest percentage saying they have leftover money at the end of the month. This age group spent the most time making peak earnings in their careers, are more likely to have investments, and are more likely to have paid off major expenses like a mortgage or raising a family.
The Impact of Higher Education on Earnings and Savings
Based on this survey, higher education dramatically improves one’s ability to save. Shown in the table below, those with a bachelor’s degree or higher are three times more likely to have leftover money than those without a high school diploma.
| Education | Always/Often | Sometimes | Rarely/Never |
|---|---|---|---|
| No HS Diploma | 18% | 26% | 56% |
| HS Diploma | 28% | 33% | 39% |
| Associate Degree | 33% | 31% | 36% |
| Bachelor/Higher Degree | 59% | 21% | 20% |
| All Adults | 39% | 33% | 27% |
Note: Percentages are rounded and may not sum to 100.
As the Bureau of Labor Statistics notes, earnings improve with every level of education completed.
For example, those with a high school diploma made 25% more than those without in 2022. And as the qualifications increase, the effects keep stacking.
Meanwhile, a Federal Reserve study also found that those with more education tended to make financial decisions that contributed to building wealth, of which the first step is to save.

-

 Green1 week ago
Ranked: The Countries With the Most Air Pollution in 2023
-

 Automotive2 weeks ago
Almost Every EV Stock is Down After Q1 2024
-

 AI2 weeks ago
The Stock Performance of U.S. Chipmakers So Far in 2024
-

 Markets2 weeks ago
Charted: Big Four Market Share by S&P 500 Audits
-

 Real Estate2 weeks ago
Ranked: The Most Valuable Housing Markets in America
-

 Money2 weeks ago
Which States Have the Highest Minimum Wage in America?
-

 AI2 weeks ago
Ranked: Semiconductor Companies by Industry Revenue Share
-

 Travel2 weeks ago
Ranked: The World’s Top Flight Routes, by Revenue