Business
Visualizing Tech Company Layoffs in 2022


Visualizing Tech Company Layoffs in 2022
Layoffs are happening so frequently in 2022 that everyone from Crunchbase to Indian tech website Inc42 are now keeping track.
There is even a standalone website tracking all tech layoffs in the United States.
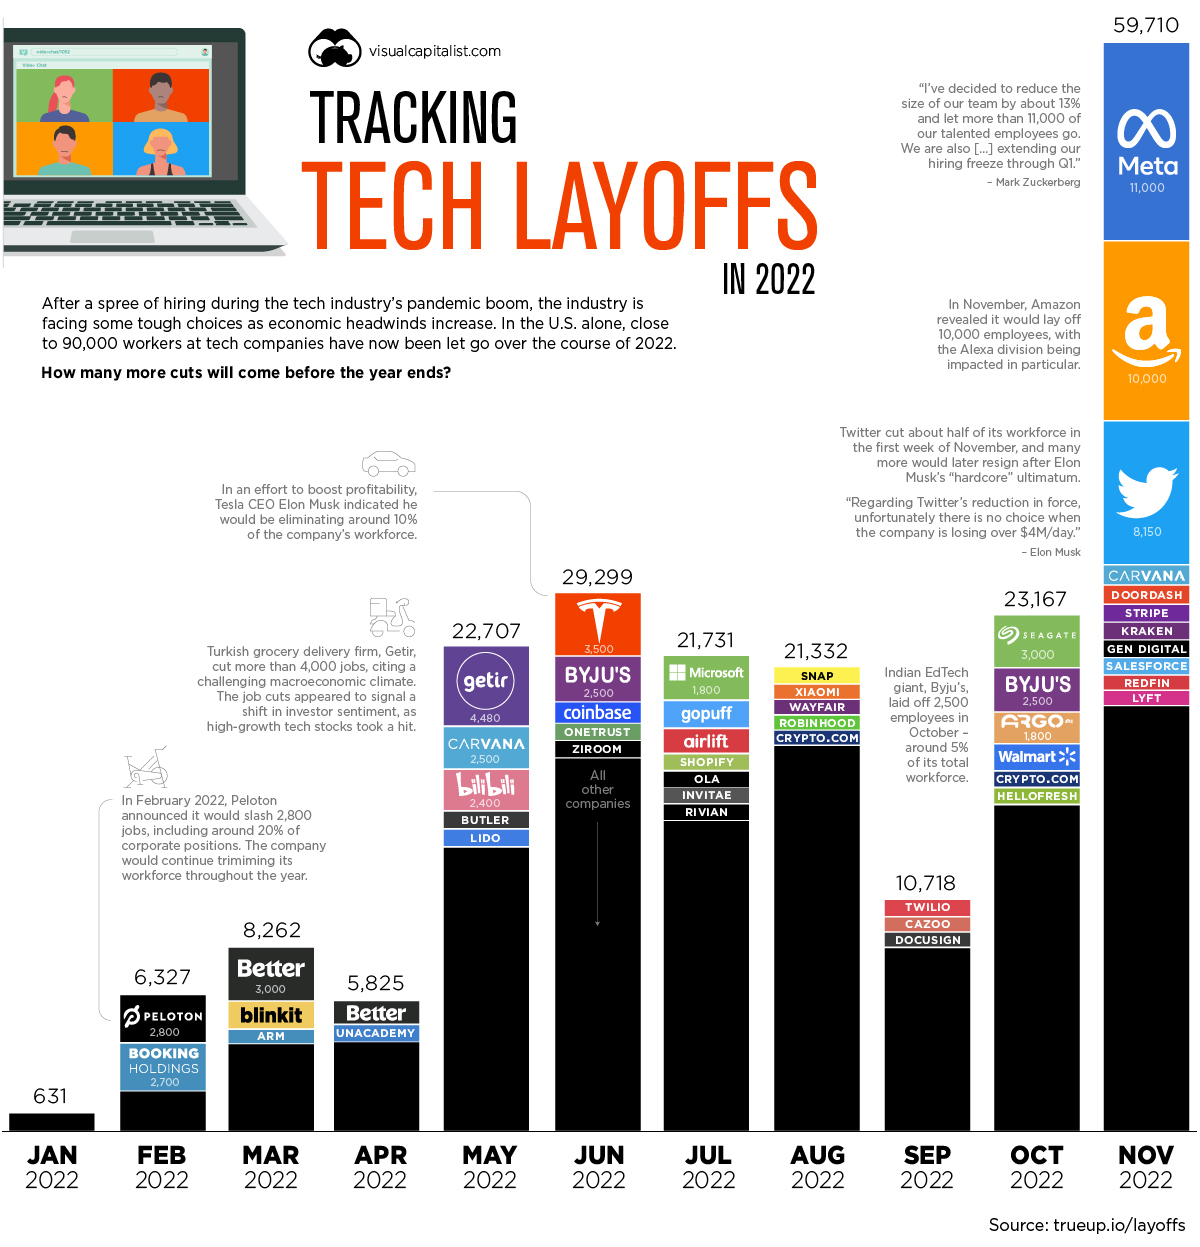
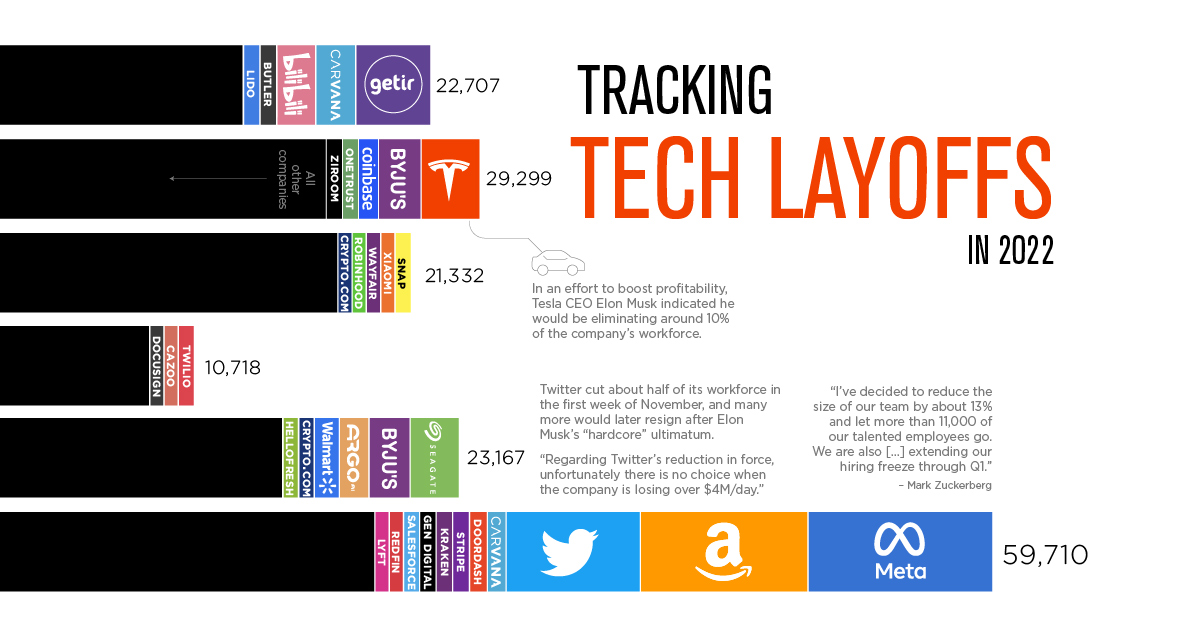
For the purposes of this infographic, we’ve used data from trueup.io which includes a mix of U.S. and international tech companies that have let workers go in 2022.
A Thousand Cuts: Mass Layoffs by Tech Companies
Layoffs are having an impact on the entire tech industry, and the phenomenon is global. Here are some of the most high-profile examples of mass layoffs in 2022:
Meta: The social media giant faces competition from upstarts like TikTok, as well as a pool of ad dollars that is shrinking in the face of a faltering economy. Although this reduction in headcount is painful for Meta, it’s worth considering a more broad perspective. In close to two decades of doing business, these will be the company’s first wide-scale job cuts.
Twitter: Though Meta wins with sheer volume of cuts, Twitter’s mass layoffs are surely the most dramatic. In early November, the company’s iconoclastic new owner, Elon Musk, slashed 50% of the workforce, and soon after, thousands of contractors also suddenly lost their jobs. Estimating how many employees remain at the company will remain a challenge until the dust settles.
Byju’s: Layoffs are not just confined to the United States. India’s sizable tech sector is also facing cuts. EdTech giant, Byju’s, laid off 2,500 employees in October—around 5% of its total workforce.
Peloton: The high-end workout equipment company has been dropping its headcount throughout the year. In the visualization above, companies like Meta stand out as they eliminated thousands of employees all at once. Peloton, however, executed its layoffs in stages throughout the year. After strong growth during the pandemic began to stagnate, the company is slimming down to regain profitability.
Why are Tech Companies Laying Off so Many People?
The stated reasons for letting so many workers go are economic uncertainty (external factors) and poor performance (internal factors).
Goldman Sachs Research points out that “higher interest rates and tighter financial conditions disproportionately impact the sector because tech company profits are typically expected further out in the future and therefore subject to greater duration risk.”
Shrinking advertising budgets and the implosion of the cryptocurrency market are also factors that may have influenced the decision to cut headcounts. Twitter and Snapchat fall into the former bucket, while Coinbase and Kraken fall into the latter.
What Do These Job Cuts Mean for the Economy?
At face value, widespread layoffs in the tech sector might appear to be a bad omen for the wider economy—especially given the outsize influence tech companies have on the markets.
Thankfully, this does not appear to be the case. Payroll and wage data from the U.S. government have exceeded expectations, and the country’s unemployment rate is close to a half-century low.
So, why the disconnect?
First off, tech jobs only account for less than 3% of total employment in America. As well, tech workers who’ve lost their jobs have a high likelihood of securing a new job in short order.
It remains to be seen whether November will be the peak of job cuts. Employers generally try to avoid letting people go right before the holiday season. One week into December, Trueup.io has tracked 7,600 more layoffs.


Brands
How Tech Logos Have Evolved Over Time
From complete overhauls to more subtle tweaks, these tech logos have had quite a journey. Featuring: Google, Apple, and more.


How Tech Logos Have Evolved Over Time
This was originally posted on our Voronoi app. Download the app for free on iOS or Android and discover incredible data-driven charts from a variety of trusted sources.
One would be hard-pressed to find a company that has never changed its logo. Granted, some brands—like Rolex, IBM, and Coca-Cola—tend to just have more minimalistic updates. But other companies undergo an entire identity change, thus necessitating a full overhaul.
In this graphic, we visualized the evolution of prominent tech companies’ logos over time. All of these brands ranked highly in a Q1 2024 YouGov study of America’s most famous tech brands. The logo changes are sourced from 1000logos.net.
How Many Times Has Google Changed Its Logo?
Google and Facebook share a 98% fame rating according to YouGov. But while Facebook’s rise was captured in The Social Network (2010), Google’s history tends to be a little less lionized in popular culture.
For example, Google was initially called “Backrub” because it analyzed “back links” to understand how important a website was. Since its founding, Google has undergone eight logo changes, finally settling on its current one in 2015.
| Company | Number of Logo Changes |
|---|---|
| 8 | |
| HP | 8 |
| Amazon | 6 |
| Microsoft | 6 |
| Samsung | 6 |
| Apple | 5* |
Note: *Includes color changes. Source: 1000Logos.net
Another fun origin story is Microsoft, which started off as Traf-O-Data, a traffic counter reading company that generated reports for traffic engineers. By 1975, the company was renamed. But it wasn’t until 2012 that Microsoft put the iconic Windows logo—still the most popular desktop operating system—alongside its name.
And then there’s Samsung, which started as a grocery trading store in 1938. Its pivot to electronics started in the 1970s with black and white television sets. For 55 years, the company kept some form of stars from its first logo, until 1993, when the iconic encircled blue Samsung logo debuted.
Finally, Apple’s first logo in 1976 featured Isaac Newton reading under a tree—moments before an apple fell on his head. Two years later, the iconic bitten apple logo would be designed at Steve Jobs’ behest, and it would take another two decades for it to go monochrome.

-

 Green1 week ago
Ranked: The Countries With the Most Air Pollution in 2023
-

 Automotive2 weeks ago
Almost Every EV Stock is Down After Q1 2024
-

 AI2 weeks ago
The Stock Performance of U.S. Chipmakers So Far in 2024
-

 Markets2 weeks ago
Charted: Big Four Market Share by S&P 500 Audits
-

 Real Estate2 weeks ago
Ranked: The Most Valuable Housing Markets in America
-

 Money2 weeks ago
Which States Have the Highest Minimum Wage in America?
-

 AI2 weeks ago
Ranked: Semiconductor Companies by Industry Revenue Share
-

 Travel2 weeks ago
Ranked: The World’s Top Flight Routes, by Revenue