Misc
Which College Degrees Get the Highest Salaries?
Which College Degrees Get the Highest Salaries?
If you’re a college graduate, you likely went to school to pursue an important passion of yours.
But as we all know, what we major in has consequences that extend far beyond the foundation of knowledge we build in our early years. Any program we choose to enroll in also sets up a track to meet future friends, career opportunities, and connections.
Even further, the college degree you choose will partially dictate your future earning potential – especially in the first decade after school. If jobs in your field are in high demand, it can even set you up for long-term financial success, enabling you to pay off costly student loans and build up savings potential.
Data Backgrounder
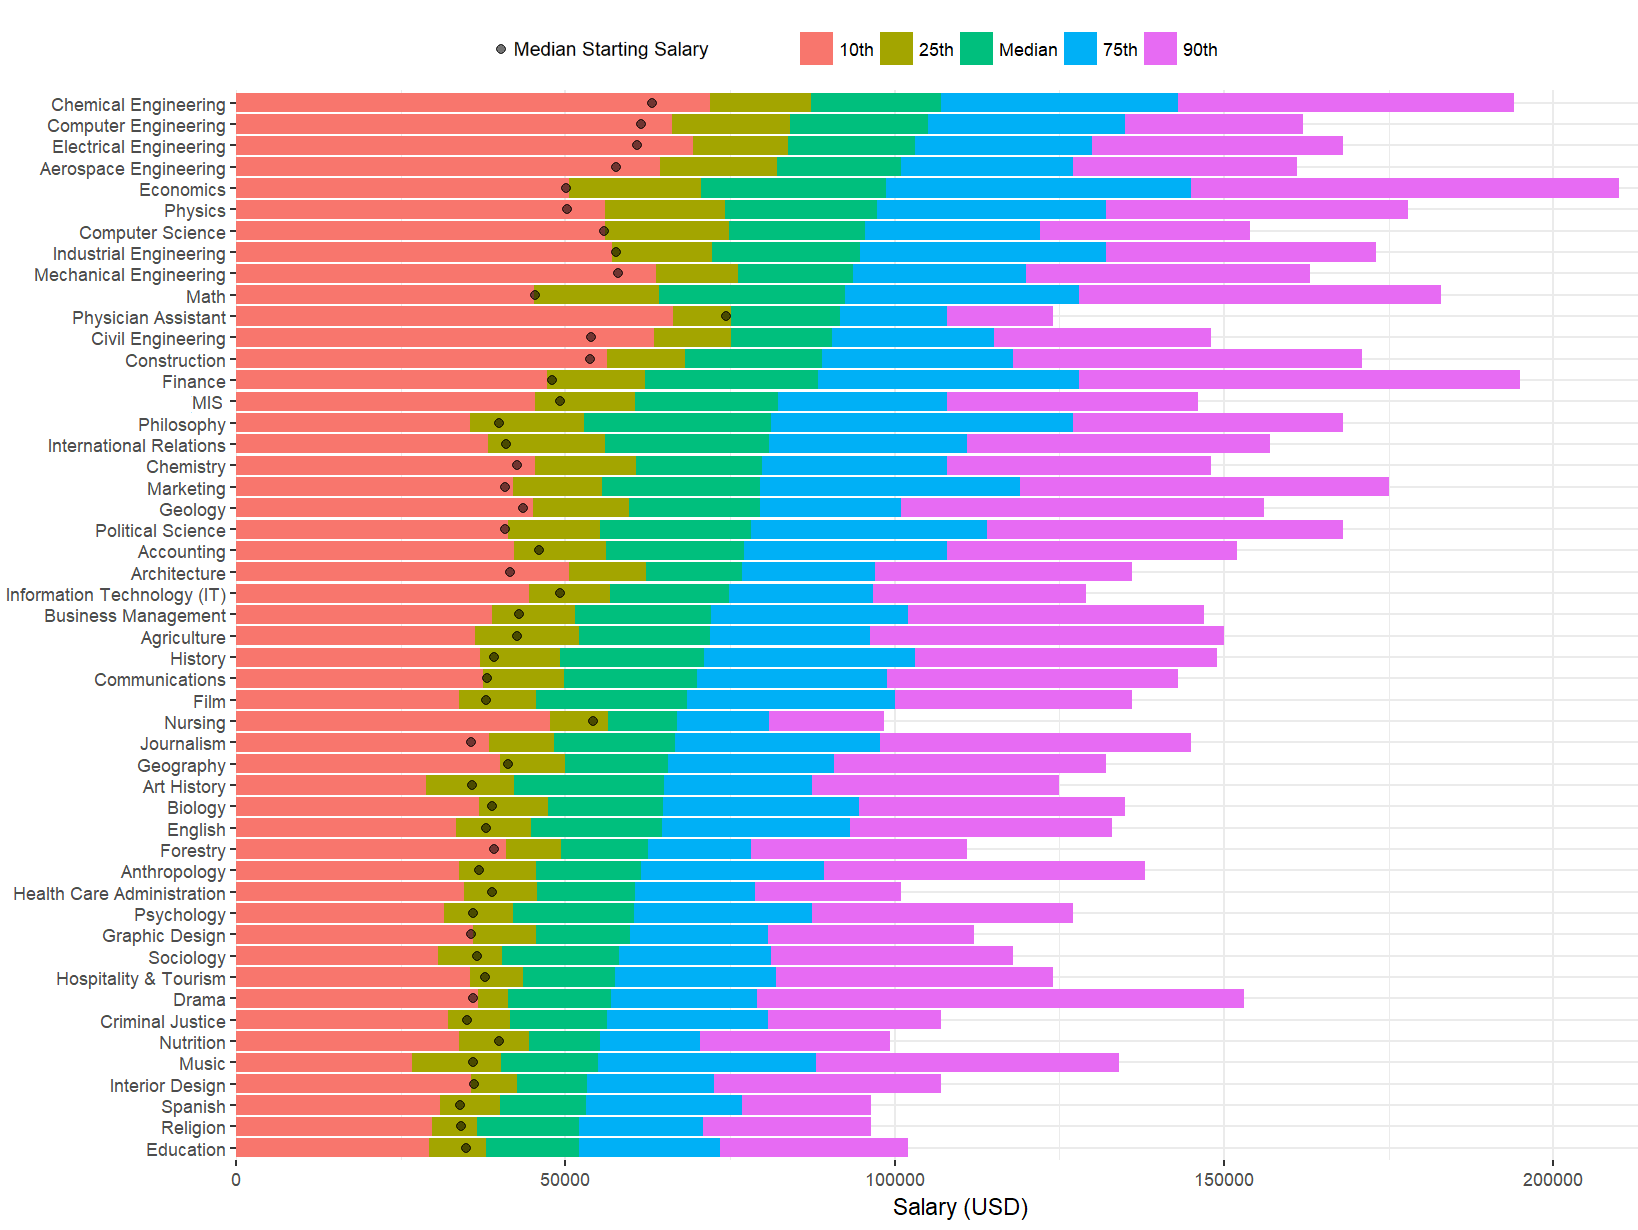
Today’s chart comes to us from Reddit user /r/SportsAnalyticsGuy, and it’s based on PayScale’s year-long survey of 1.2 million users that graduated only with a bachelor degree in the United States. You can access the full set of data here.
The data covers two different salary categories:
Starting median salary: The median of what people were earning after they graduated with their degree.
Mid-career Percentiles: Salary data from 10 years after graduation, sorted by percentile (10th, 25th, Median, 75th, and 90th)
In other words, the starting median salary represents what people started making after they graduated, and the rest of the chart depicts the range that people were making 10 years after they got their degree. Lower earners (10th percentile) are the lower bound, and higher earners (90th) are the upper bound.
College Degrees, by Salary
What college majors win out?
Here’s all 50 majors from the data set, sorted by mid-career median salary (10 years in):
| Rank | Undergraduate Major | Starting Median | Mid-Career Median | % Change |
|---|---|---|---|---|
| #1 | Chemical Engineering | $63,200 | $107,000 | 69.3% |
| #2 | Computer Engineering | $61,400 | $105,000 | 71.0% |
| #3 | Electrical Engineering | $60,900 | $103,000 | 69.1% |
| #4 | Aerospace Engineering | $57,700 | $101,000 | 75.0% |
| #5 | Economics | $50,100 | $98,600 | 96.8% |
| #6 | Physics | $50,300 | $97,300 | 93.4% |
| #7 | Computer Science | $55,900 | $95,500 | 70.8% |
| #8 | Industrial Engineering | $57,700 | $94,700 | 64.1% |
| #9 | Mechanical Engineering | $57,900 | $93,600 | 61.7% |
| #10 | Math | $45,400 | $92,400 | 103.5% |
| #11 | Physician Assistant | $74,300 | $91,700 | 23.4% |
| #12 | Civil Engineering | $53,900 | $90,500 | 67.9% |
| #13 | Construction | $53,700 | $88,900 | 65.5% |
| #14 | Finance | $47,900 | $88,300 | 84.3% |
| #15 | Management Information Systems (MIS) | $49,200 | $82,300 | 67.3% |
| #16 | Philosophy | $39,900 | $81,200 | 103.5% |
| #17 | International Relations | $40,900 | $80,900 | 97.8% |
| #18 | Chemistry | $42,600 | $79,900 | 87.6% |
| #19 | Marketing | $40,800 | $79,600 | 95.1% |
| #20 | Geology | $43,500 | $79,500 | 82.8% |
| #21 | Political Science | $40,800 | $78,200 | 91.7% |
| #22 | Accounting | $46,000 | $77,100 | 67.6% |
| #23 | Architecture | $41,600 | $76,800 | 84.6% |
| #24 | Information Technology (IT) | $49,100 | $74,800 | 52.3% |
| #25 | Business Management | $43,000 | $72,100 | 67.7% |
| #26 | Agriculture | $42,600 | $71,900 | 68.8% |
| #27 | History | $39,200 | $71,000 | 81.1% |
| #28 | Communications | $38,100 | $70,000 | 83.7% |
| #29 | Film | $37,900 | $68,500 | 80.7% |
| #30 | Nursing | $54,200 | $67,000 | 23.6% |
| #31 | Journalism | $35,600 | $66,700 | 87.4% |
| #32 | Geography | $41,200 | $65,500 | 59.0% |
| #33 | Art History | $35,800 | $64,900 | 81.3% |
| #34 | Biology | $38,800 | $64,800 | 67.0% |
| #35 | English | $38,000 | $64,700 | 70.3% |
| #36 | Forestry | $39,100 | $62,600 | 60.1% |
| #37 | Anthropology | $36,800 | $61,500 | 67.1% |
| #38 | Health Care Administration | $38,800 | $60,600 | 56.2% |
| #39 | Psychology | $35,900 | $60,400 | 68.2% |
| #40 | Graphic Design | $35,700 | $59,800 | 67.5% |
| #41 | Sociology | $36,500 | $58,200 | 59.5% |
| #42 | Hospitality & Tourism | $37,800 | $57,500 | 52.1% |
| #43 | Drama | $35,900 | $56,900 | 58.5% |
| #44 | Criminal Justice | $35,000 | $56,300 | 60.9% |
| #45 | Nutrition | $39,900 | $55,300 | 38.6% |
| #46 | Music | $35,900 | $55,000 | 53.2% |
| #47 | Interior Design | $36,100 | $53,200 | 47.4% |
| #48 | Spanish | $34,000 | $53,100 | 56.2% |
| #49 | Education | $34,900 | $52,000 | 49.0% |
| #50 | Religion | $34,100 | $52,000 | 52.5% |
Based on this data, there are a few interesting things to point out.
The top earning specialization out of college is for Physician Assistants, with a median starting salary of $74,300. The downside of this degree is that earning potential levels out quickly, only showing a 23.4% increase in earning power 10 years in.
In contrast, the biggest increases in earning power go to Math, Philosophy, Economics, Marketing, Physics, Political Science, and International Relations majors. All these degrees see a 90% or higher increase from median starting salary to median mid-career salary.
In absolute terms, the majors that saw the highest median mid-career salaries were all along the engineering spectrum: chemical engineering, computer engineering, electrical engineering, and aerospace engineering all came in above $100,000. They also generally had very high starting salaries.
As a final note, it’s important to recognize that this data does not necessarily correlate to today’s degrees or job market. The data set is based on people that graduated at least a decade ago – and therefore, it does not necessarily represent what grads may experience as they are starting their careers today.


Education
How Hard Is It to Get Into an Ivy League School?
We detail the admission rates and average annual cost for Ivy League schools, as well as the median SAT scores required to be accepted.


How Hard Is It to Get Into an Ivy League School?
This was originally posted on our Voronoi app. Download the app for free on iOS or Android and discover incredible data-driven charts from a variety of trusted sources.
Ivy League institutions are renowned worldwide for their academic excellence and long-standing traditions. But how hard is it to get into one of the top universities in the U.S.?
In this graphic, we detail the admission rates and average annual cost for Ivy League schools, as well as the median SAT scores required to be accepted. The data comes from the National Center for Education Statistics and was compiled by 24/7 Wall St.
Note that “average annual cost” represents the net price a student pays after subtracting the average value of grants and/or scholarships received.
Harvard is the Most Selective
The SAT is a standardized test commonly used for college admissions in the United States. It’s taken by high school juniors and seniors to assess their readiness for college-level academic work.
When comparing SAT scores, Harvard and Dartmouth are among the most challenging universities to gain admission to. The median SAT scores for their students are 760 for reading and writing and 790 for math. Still, Harvard has half the admission rate (3.2%) compared to Dartmouth (6.4%).
| School | Admission rate (%) | SAT Score: Reading & Writing | SAT Score: Math | Avg Annual Cost* |
|---|---|---|---|---|
| Harvard University | 3.2 | 760 | 790 | $13,259 |
| Columbia University | 3.9 | 750 | 780 | $12,836 |
| Yale University | 4.6 | 760 | 780 | $16,341 |
| Brown University | 5.1 | 760 | 780 | $26,308 |
| Princeton University | 5.7 | 760 | 780 | $11,080 |
| Dartmouth College | 6.4 | 760 | 790 | $33,023 |
| University of Pennsylvania | 6.5 | 750 | 790 | $14,851 |
| Cornell University | 7.5 | 750 | 780 | $29,011 |
*Costs after receiving federal financial aid.
Additionally, Dartmouth has the highest average annual cost at $33,000. Princeton has the lowest at $11,100.
While student debt has surged in the United States in recent years, hitting $1.73 trillion in 2023, the worth of obtaining a degree from any of the schools listed surpasses mere academics. This is evidenced by the substantial incomes earned by former students.
Harvard grads, for example, have the highest average starting salary in the country, at $91,700.

-

 Maps2 weeks ago
Mapped: Average Wages Across Europe
-

 Money1 week ago
Which States Have the Highest Minimum Wage in America?
-

 Real Estate1 week ago
Ranked: The Most Valuable Housing Markets in America
-

 Markets1 week ago
Charted: Big Four Market Share by S&P 500 Audits
-

 AI1 week ago
The Stock Performance of U.S. Chipmakers So Far in 2024
-

 Automotive1 week ago
Almost Every EV Stock is Down After Q1 2024
-

 Money2 weeks ago
Where Does One U.S. Tax Dollar Go?
-

 Green2 weeks ago
Ranked: Top Countries by Total Forest Loss Since 2001