Green
Visualizing Mismanaged Plastic Waste by Country


Visualizing Mismanaged Plastic Waste by Country
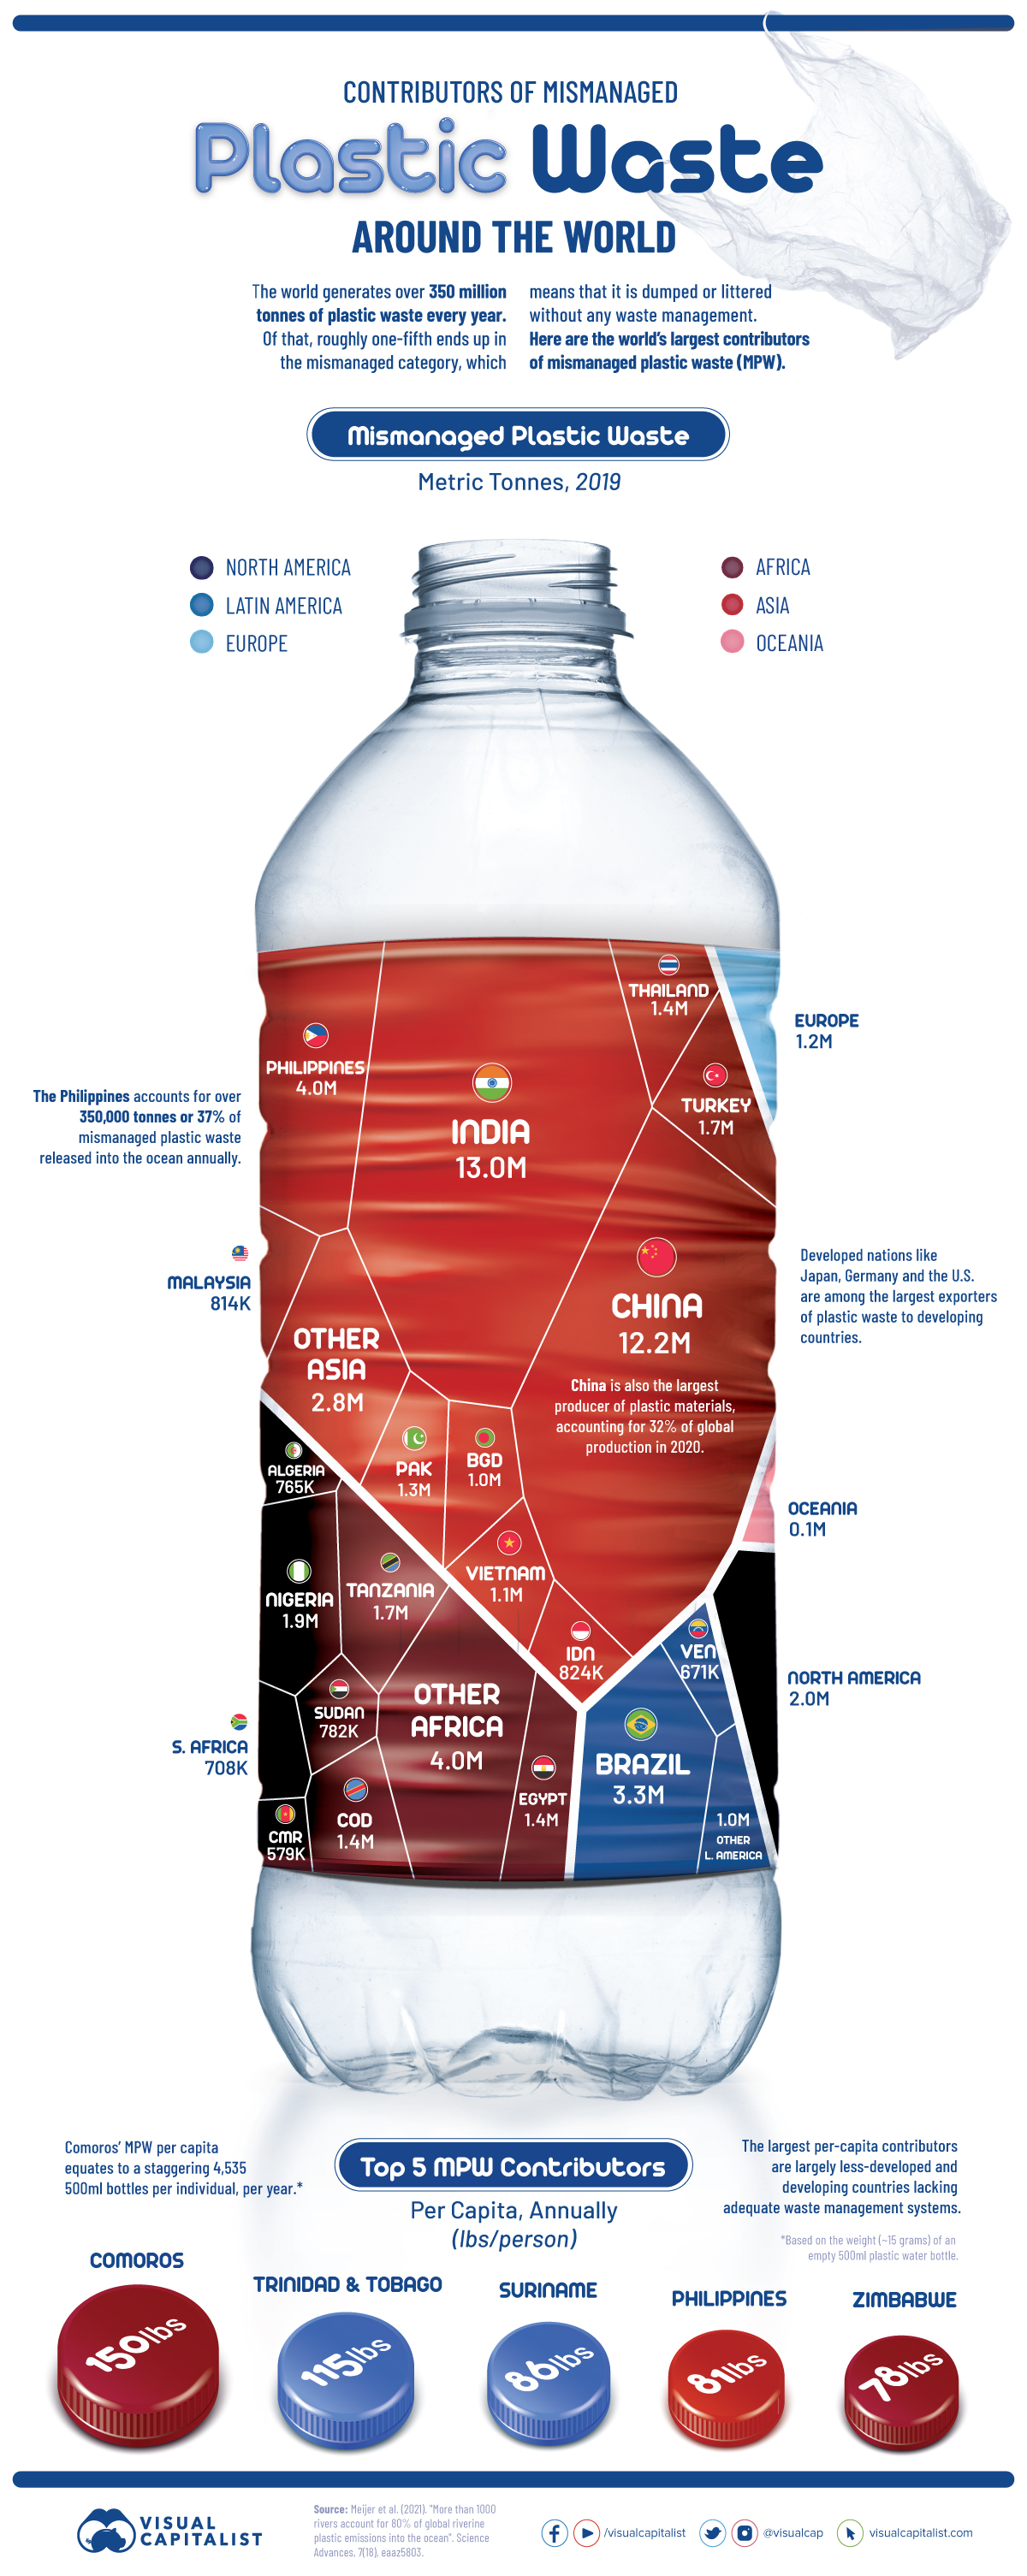
Plastic is one of the most useful materials around, but its proliferating use has created a ballooning heap of plastic waste, with more than 350 million tonnes generated each year.
Only a fraction of plastic waste is recycled, and about one-fifth ends up in the mismanaged category, meaning that it is dumped or littered without proper waste management practices. Mismanaged plastic waste threatens the land and marine environments, and most of it doesn’t decompose, polluting the environment for hundreds of years.
The above infographic visualizes the largest contributors of mismanaged plastic waste in 2019, based on data from a study by Meijer et al. published in the Science Advances journal.
The Largest Contributors of Mismanaged Plastic Waste
Asian countries account for the majority of global mismanaged plastic waste (MPW), and many of the top plastic-emitting rivers are concentrated in the region.
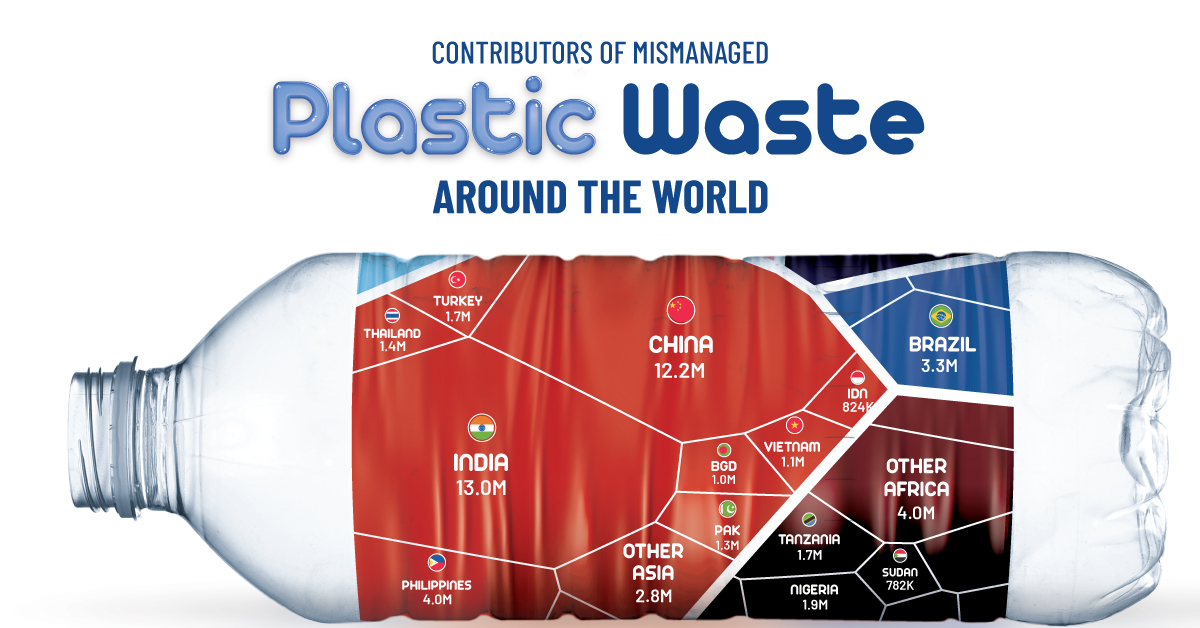
India and China are the only countries to account for over 10 million tonnes of MPW, although that could partly be driven by their sheer population numbers.
| Country/Region | MPW created in 2019 (tonnes) | % of total |
|---|---|---|
| India 🇮🇳 | 12,994,100 | 21% |
| China 🇨🇳 | 12,272,200 | 20% |
| Philippines 🇵🇭 | 4,025,300 | 7% |
| Brazil 🇧🇷 | 3,296,700 | 5% |
| Nigeria 🇳🇬 | 1,948,950 | 3% |
| North America 🌎 | 1,927,484 | 3% |
| Tanzania 🇹🇿 | 1,716,400 | 3% |
| Turkey 🇹🇷 | 1,656,110 | 3% |
| Egypt 🇪🇬 | 1,435,510 | 2% |
| DR Congo 🇨🇩 | 1,369,730 | 2% |
| Thailand 🇹🇭 | 1,361,690 | 2% |
| Pakistan 🇵🇰 | 1,346,460 | 2% |
| Europe 🌍 | 1,179,881 | 2% |
| Vietnam 🇻🇳 | 1,112,790 | 2% |
| Bangladesh 🇧🇩 | 1,021,990 | 2% |
| Indonesia 🇮🇩 | 824,234 | 1% |
| Malaysia 🇲🇾 | 814,454 | 1% |
| Sudan 🇸🇩 | 781,625 | 1% |
| Algeria 🇩🇿 | 764,578 | 1% |
| South Africa 🇿🇦 | 708,467 | 1% |
| Venezuela 🇻🇪 | 671,431 | 1% |
| Cameroon 🇨🇲 | 578,798 | 1% |
| Oceania 🌎 | 136,506 | 0.2% |
| Other 🗺 | 7,828,312 | 13% |
| Total | 61,773,700 | 100% |
Generally, the top countries in the above table are developing economies that tend to have inadequate waste management infrastructure.
The Philippines is the third-largest contributor and accounts for 37% of all MPW released into the ocean at over 350,000 tonnes per year. Solid waste management remains a major environmental issue in the Philippines. The country recently closed down 335 illegal dumpsites to encourage the use of sanitary landfills and proper waste segregation.
The three continents of North America, Europe, and Oceania together account for just 5% of global mismanaged plastic waste. However, it’s important to note that these figures do not reflect the amount of waste that is exported overseas, and many rich nations are known to export some portions of their waste to poorer nations.
The State of Plastic Waste Trade
In 2019, the Philippines famously shipped back 69 containers of dumped garbage back to Canada, joining other nations in rejecting waste from rich countries.
Until 2017, China was the largest importer of overseas plastic waste, accounting for roughly 50% of global plastic waste imports. Then, it imposed an import ban on almost all types of plastic waste, resulting in a decline in the overall global plastic scrap trade.
In 2021, global plastic waste imports were just over one-third of 2017 levels. However, countries including Malaysia, Indonesia, and Vietnam have been importing more plastic waste since China’s ban, slightly offsetting the impact.
Mismanaged Plastic Waste Per Capita
On a per capita basis, the archipelago of Comoros in East Africa tops the list. Its per capita MPW is equivalent to over 4,500 empty 500ml plastic bottles per person, per year.
| Country | MPW per capita | GDP per capita (2021, current US$) |
|---|---|---|
| Comoros 🇰🇲 | 150lbs (68kg) | $1,495 |
| Trinidad and Tobago 🇹🇹 | 115lbs (52kg) | $15,243 |
| Suriname 🇸🇷 | 86lbs (39kg) | $4,836 |
| Philippines 🇵🇭 | 81lbs (37kg) | $3,549 |
| Zimbabwe 🇿🇼 | 78lbs (35kg) | $1,737 |
While there isn’t much information available on waste management in Comoros, it is one of the world’s least-developed nations. In fact, household consumption accounts for almost 100% of its annual gross domestic product.
Trinidad and Tobago is an outlier due to its high-income status, but a lack of waste segregation among households, alongside inefficient waste management systems, contributes to its high per capita figure.
The Impact of Plastic Waste
Plastic waste has various negative implications for the environment, especially as it can take hundreds of years to decompose.
Millions of tonnes of plastic waste flows into the oceans every year, accounting for at least 85% of all marine garbage. This poses a major threat to aquatic life because fish and other organisms can get entangled in plastic waste and ingest plastics.
On land, plastic waste threatens the quality of the soil and its surrounding ecosystem. Additionally, burning plastic waste releases toxic particles that have a detrimental impact on air quality.
If current trends continue, over 12 billion tonnes of plastic waste is expected to end up in landfills by 2050. Although recycling rates are expected to improve, increasing the availability of adequate waste management systems will be important in preventing plastic waste from entering the environment.


Green
Ranking the Top 15 Countries by Carbon Tax Revenue
This graphic highlights France and Canada as the global leaders when it comes to generating carbon tax revenue.


Top 15 Countries by Carbon Tax Revenue
This was originally posted on our Voronoi app. Download the app for free on iOS or Android and discover incredible data-driven charts from a variety of trusted sources.
Carbon taxes are designed to discourage CO2 emissions by increasing the cost of carbon-intensive activities and incentivizing the adoption of cleaner energy alternatives.
In this graphic we list the top 15 countries by carbon tax revenue as of 2022. The data is from the World Bank’s State and Trends of Carbon Pricing Report, published in April 2023.
France and Canada Lead in Global Carbon Tax Revenue
In 2022, the top 15 countries generated approximately $30 billion in revenue from carbon taxes.
France and Canada lead in this regard, accounting for over half of the total amount. Both countries have implemented comprehensive carbon pricing systems that cover a wide range of sectors, including transportation and industry, and they have set relatively high carbon tax rates.
| Country | Government revenue in 2022 ($ billions) |
|---|---|
| 🇫🇷 France | $8.9 |
| 🇨🇦 Canada | $7.8 |
| 🇸🇪 Sweden | $2.3 |
| 🇳🇴 Norway | $2.1 |
| 🇯🇵 Japan | $1.8 |
| 🇫🇮 Finland | $1.7 |
| 🇨🇭 Switzerland | $1.6 |
| 🇬🇧 United Kingdom | $0.9 |
| 🇮🇪 Ireland | $0.7 |
| 🇩🇰 Denmark | $0.5 |
| 🇵🇹 Portugal | $0.5 |
| 🇦🇷 Argentina | $0.3 |
| 🇲🇽 Mexico | $0.2 |
| 🇸🇬 Singapore | $0.1 |
| 🇿🇦 South Africa | $0.1 |
In Canada, the total carbon tax revenue includes both national and provincial taxes.
While carbon pricing has been recognized internationally as one of the more efficient mechanisms for reducing CO2 emissions, research is divided over what the global average carbon price should be to achieve the goals of the Paris Climate Agreement, which aims to limit global warming to 1.5–2°C by 2100 relative to pre-industrial levels.
A recent study has shown that carbon pricing must be supported by other policy measures and innovations. According to a report from Queen’s University, there is no feasible carbon pricing scenario that is high enough to limit emissions sufficiently to achieve anything below 2.4°C warming on its own.

-

 Green2 weeks ago
Ranked: Top Countries by Total Forest Loss Since 2001
-

 Travel1 week ago
Ranked: The World’s Top Flight Routes, by Revenue
-

 Technology1 week ago
Ranked: Semiconductor Companies by Industry Revenue Share
-

 Money2 weeks ago
Which States Have the Highest Minimum Wage in America?
-

 Real Estate2 weeks ago
Ranked: The Most Valuable Housing Markets in America
-

 Markets2 weeks ago
Charted: Big Four Market Share by S&P 500 Audits
-

 AI2 weeks ago
The Stock Performance of U.S. Chipmakers So Far in 2024
-

 Automotive2 weeks ago
Almost Every EV Stock is Down After Q1 2024