Economy
Visualizing the Most Miserable Countries in the World
Presented by: 

Visualizing the Most Miserable Countries in the World
The Money Project is an ongoing collaboration between Visual Capitalist and Texas Precious Metals that seeks to use intuitive visualizations to explore the origins, nature, and use of money.
Every year, the Cato Institute publishes a list of the world’s most “miserable countries” by using a simple economic formula to calculate the scores. Described as a Misery Index, the tally for each country can be found by adding the unemployment rate, inflation, and lending rate together, and then subtracting the change in real GDP per capita.
Disaster in Venezuela
According to the think tank, countries with misery scores over 20 are “ripe for reform”. If that’s true, then socialist Venezuela is way overdue.
The troubled nation finished with a misery score of 214.9, the highest marker in 2015 by far. Unfortunately, the number is not looking better for this year, as the IMF has projected that hyperinflation will top 720% by the end of 2016. For the average Venezuelan, that means that food staples and other necessities will be doubling in price every four months.
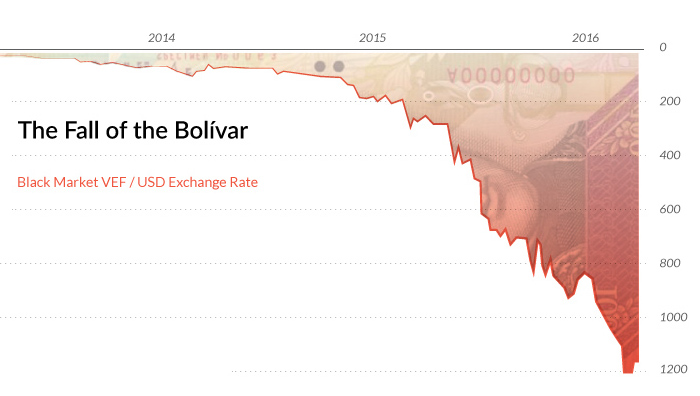
Hyperinflation has taken its toll on citizens already. Three years ago, one US dollar could buy four Venezuelan bolivars. Today, one dollar can buy more than 1,000 bolivars on the black market. If the inflation rate keeps accelerating, the situation could approach a similar trajectory to hyperinflation in Weimar Germany, where rates eventually catapulted to one trillion percent after six years.
While hyperinflation is certainly one of Venezuela’s biggest concerns, the nation has also been short on luck lately. The Zika virus has hit the country hard, and the oil crash has created political, economic, and social tensions in a nation that depends on oil exports to balance the budget. Three in four Venezuelans have fallen into poverty, and the country’s GDP is expected to contract 8% in 2016.
Venezuelans are now facing dire shortages for many necessities, including power. Droughts have caused mayhem on the country’s hydro reservoirs, making blackouts common and widespread. Food, medical supplies, and toilet paper are in short supply, and even beer production has been shut down.
Key Stats:
- Approval Rating of Nicolas Maduro: 26.8%
- People in poverty: 76%
- Oil exports, as a percent of total revenue: 96%
- Homicides per capita: 2nd highest in world
- Good shortages: Power, medical supplies, food, toilet paper, beer
- Fiscal deficit: 20% of GDP
Recent measures taken to dampen the crisis in Venezuela have been bold.
The government has moved entire time zones while reducing the work week of public sector workers to try and work around power deficiencies. Meanwhile, minimum wage earners have been given a 30% raise to keep up with inflation.
However, the crisis may be coming to a head. A recent survey shows that 87% of Venezuelans do not have enough money to purchase enough food to meet their needs, and people are getting restless.
In early May, the opposition party submitted a list 1.85 million signatures to the electoral commission to seek a recall referendum against President Nicolas Maduro. Days after the submission, the leader of an opposition party was found dead after being shot in the head.
Unless the country gets ruled with an iron fist, the level of misery can only reach a certain point before the people take decisive action.
About the Money Project
The Money Project aims to use intuitive visualizations to explore ideas around the very concept of money itself. Founded in 2015 by Visual Capitalist and Texas Precious Metals, the Money Project will look at the evolving nature of money, and will try to answer the difficult questions that prevent us from truly understanding the role that money plays in finance, investments, and accumulating wealth.


Economy
Economic Growth Forecasts for G7 and BRICS Countries in 2024
The IMF has released its economic growth forecasts for 2024. How do the G7 and BRICS countries compare?


G7 & BRICS Real GDP Growth Forecasts for 2024
The International Monetary Fund’s (IMF) has released its real gross domestic product (GDP) growth forecasts for 2024, and while global growth is projected to stay steady at 3.2%, various major nations are seeing declining forecasts.
This chart visualizes the 2024 real GDP growth forecasts using data from the IMF’s 2024 World Economic Outlook for G7 and BRICS member nations along with Saudi Arabia, which is still considering an invitation to join the bloc.
Get the Key Insights of the IMF’s World Economic Outlook
Want a visual breakdown of the insights from the IMF’s 2024 World Economic Outlook report?
This visual is part of a special dispatch of the key takeaways exclusively for VC+ members.
Get the full dispatch of charts by signing up to VC+.
Mixed Economic Growth Prospects for Major Nations in 2024
Economic growth projections by the IMF for major nations are mixed, with the majority of G7 and BRICS countries forecasted to have slower growth in 2024 compared to 2023.
Only three BRICS-invited or member countries, Saudi Arabia, the UAE, and South Africa, have higher projected real GDP growth rates in 2024 than last year.
| Group | Country | Real GDP Growth (2023) | Real GDP Growth (2024P) |
|---|---|---|---|
| G7 | 🇺🇸 U.S. | 2.5% | 2.7% |
| G7 | 🇨🇦 Canada | 1.1% | 1.2% |
| G7 | 🇯🇵 Japan | 1.9% | 0.9% |
| G7 | 🇫🇷 France | 0.9% | 0.7% |
| G7 | 🇮🇹 Italy | 0.9% | 0.7% |
| G7 | 🇬🇧 UK | 0.1% | 0.5% |
| G7 | 🇩🇪 Germany | -0.3% | 0.2% |
| BRICS | 🇮🇳 India | 7.8% | 6.8% |
| BRICS | 🇨🇳 China | 5.2% | 4.6% |
| BRICS | 🇦🇪 UAE | 3.4% | 3.5% |
| BRICS | 🇮🇷 Iran | 4.7% | 3.3% |
| BRICS | 🇷🇺 Russia | 3.6% | 3.2% |
| BRICS | 🇪🇬 Egypt | 3.8% | 3.0% |
| BRICS-invited | 🇸🇦 Saudi Arabia | -0.8% | 2.6% |
| BRICS | 🇧🇷 Brazil | 2.9% | 2.2% |
| BRICS | 🇿🇦 South Africa | 0.6% | 0.9% |
| BRICS | 🇪🇹 Ethiopia | 7.2% | 6.2% |
| 🌍 World | 3.2% | 3.2% |
China and India are forecasted to maintain relatively high growth rates in 2024 at 4.6% and 6.8% respectively, but compared to the previous year, China is growing 0.6 percentage points slower while India is an entire percentage point slower.
On the other hand, four G7 nations are set to grow faster than last year, which includes Germany making its comeback from its negative real GDP growth of -0.3% in 2023.
Faster Growth for BRICS than G7 Nations
Despite mostly lower growth forecasts in 2024 compared to 2023, BRICS nations still have a significantly higher average growth forecast at 3.6% compared to the G7 average of 1%.
While the G7 countries’ combined GDP is around $15 trillion greater than the BRICS nations, with continued higher growth rates and the potential to add more members, BRICS looks likely to overtake the G7 in economic size within two decades.
BRICS Expansion Stutters Before October 2024 Summit
BRICS’ recent expansion has stuttered slightly, as Argentina’s newly-elected president Javier Milei declined its invitation and Saudi Arabia clarified that the country is still considering its invitation and has not joined BRICS yet.
Even with these initial growing pains, South Africa’s Foreign Minister Naledi Pandor told reporters in February that 34 different countries have submitted applications to join the growing BRICS bloc.
Any changes to the group are likely to be announced leading up to or at the 2024 BRICS summit which takes place October 22-24 in Kazan, Russia.
Get the Full Analysis of the IMF’s Outlook on VC+
This visual is part of an exclusive special dispatch for VC+ members which breaks down the key takeaways from the IMF’s 2024 World Economic Outlook.
For the full set of charts and analysis, sign up for VC+.

-

 Mining1 week ago
Gold vs. S&P 500: Which Has Grown More Over Five Years?
-

 Markets2 weeks ago
Ranked: The Most Valuable Housing Markets in America
-

 Money2 weeks ago
Which States Have the Highest Minimum Wage in America?
-

 AI2 weeks ago
Ranked: Semiconductor Companies by Industry Revenue Share
-

 Markets2 weeks ago
Ranked: The World’s Top Flight Routes, by Revenue
-

 Countries2 weeks ago
Population Projections: The World’s 6 Largest Countries in 2075
-

 Markets2 weeks ago
The Top 10 States by Real GDP Growth in 2023
-

 Demographics2 weeks ago
The Smallest Gender Wage Gaps in OECD Countries