Markets
Visualizing the Longest Bull Markets of the Modern Era
Visualizing the Longest Bull Markets of the Modern Era
The Chart of the Week is a weekly Visual Capitalist feature on Fridays.
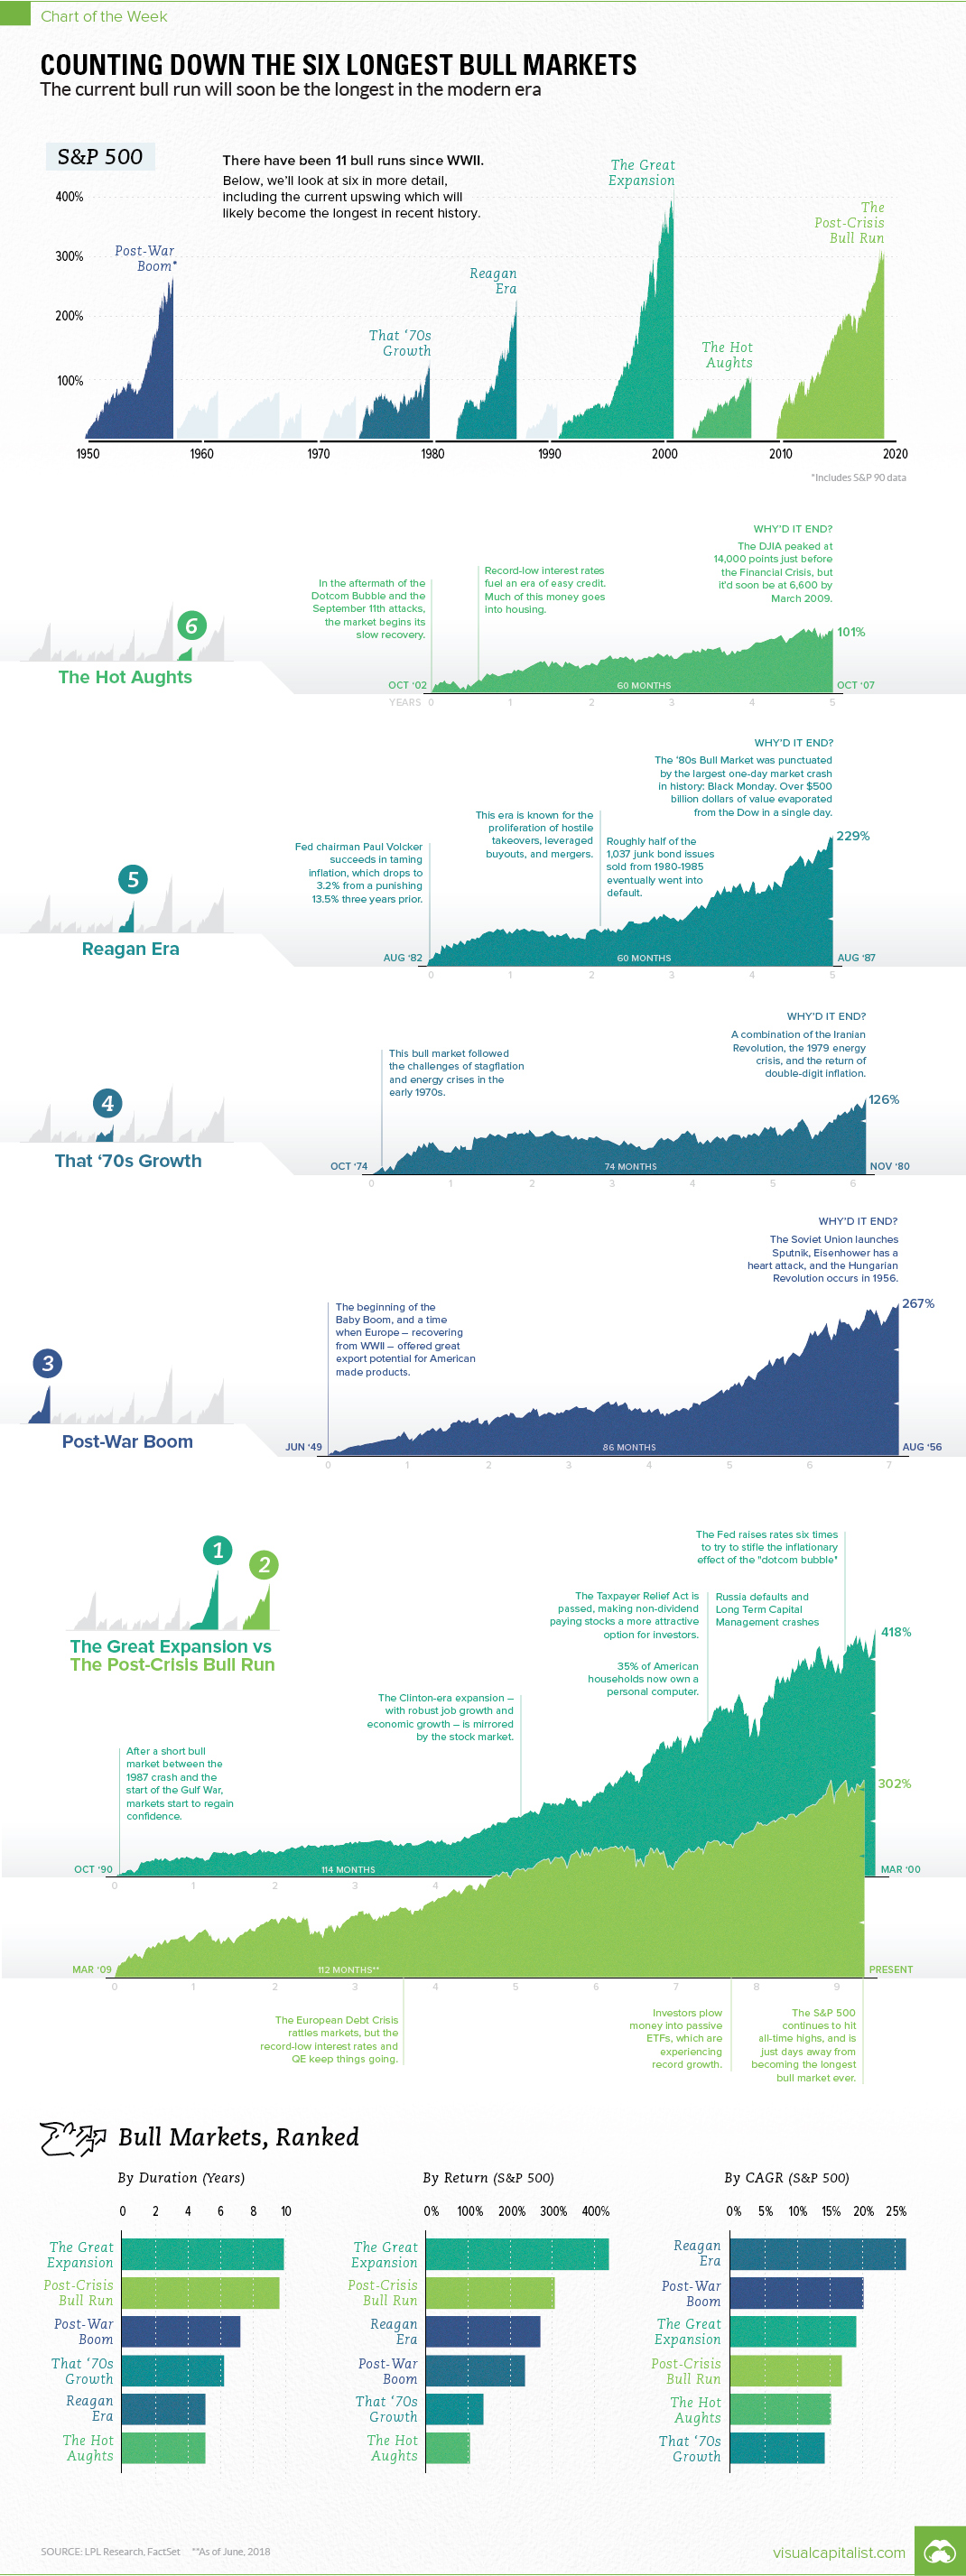
During the longest bull market in modern history, the S&P 500 surged a whopping 418% over the 9.5 years between November 1990 and March 2000.
This was during the famous economic expansion that took place during the Clinton era, in which job growth was robust, oil prices fell, stocks soared, and making money was as easy as throwing it in the stock market.
In mere months, this famed bull market may lose its title as the “longest” in the modern era.
That’s because, according to data and analysis from LDL Research, the current bull market will take over the claim to fame in late August 2018.
Ranking the Bulls
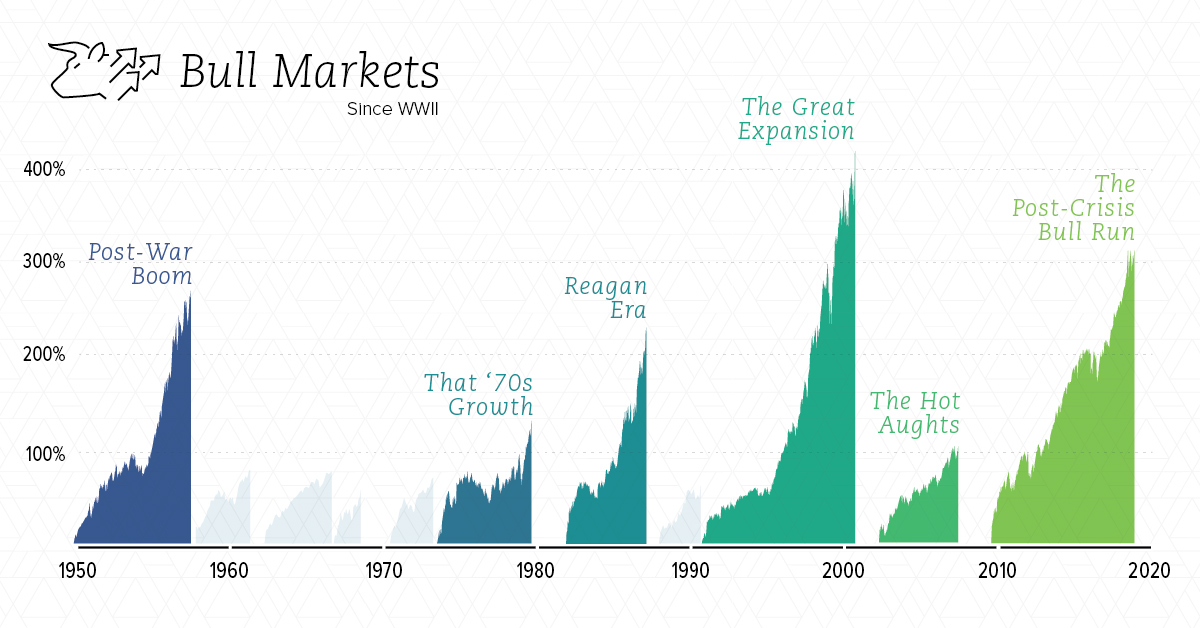
In today’s chart, we show every bull market since WWII, including the top six which are covered in more detail:
| Rank | Bull Market | Dates | Months | S&P 500 Return | Annualized Return |
|---|---|---|---|---|---|
| 1 | Great Expansion | '90-'00 | 114 | 418% | 19.0% |
| 2 | Post-Crisis Bull Run | '09-'18* | 112* | 302% | 16.7% |
| 3 | Post-War Boom | '49-'56 | 86 | 267% | 20.0% |
| 4 | That '70s Growth | '74-'80 | 74 | 126% | 14.1% |
| 5 | Reagan Era | '82-'87 | 60 | 229% | 26.7% |
| 6 | The Hot Aughts | '02-'07 | 60 | 101% | 15.0% |
*Still in progress.
By looking at duration, total rate of return, and annualized rate of return, it really gives a sense of how these bull markets compare.
The current run, which will soon become the longest, didn’t have the same level of intensity as other high-ranking bull markets. Critics would say that it was artificially propped up by ultra-low rates, QE, and other government actions that will make the market ultimately less robust heading forward.
Regardless, the current run ranks in fourth place among the markets above in terms of annualized return.
What Ended Each Bull?
The market psychology behind bull and bear markets can be fascinating.
Below we look at the events credited with “ending” each bull market – though of course, it is actually the actions of investors (buying or selling) that ultimately dictates market direction.
1. The Great Expansion
The bull run lasted 9.5 years, ultimately capitulating when the Dotcom Bubble burst. From the span of June 1999 and May 2000, the Fed raised interest rates six times to try and get a “soft landing”. Market uncertainty was worsened by the 9/11 attacks that occurred the year after.
2. The Post-Crisis Bull Run
Still ongoing…
3. The Post-War Boom
This boom occurred after WWII, and it ended in 1956. Some of the sources we looked at credited the launch of Sputnik, Eisenhower’s heart attack, and the Hungarian Revolution as possible sources of market fear.
4. That ’70s Growth
The Iranian Revolution, the 1979 Energy Crisis, and the return of double-digit inflation were the factors blamed for the end of this bull.
5. Reagan Era
This bull market had the highest annualized return at 26.7%, but the party came to an end on Black Monday in 1987 – one of the most infamous market crashes ever. Some of the causes cited for the crash: program trading, overvaluation, illiquidity and market psychology.
6. The Hot Aughts
Stocks did decently well during the era of cheap credit and rising housing prices. However, the Financial Crisis put an end to this growth, and would cut the DJIA from 14,000 points to below 6,600 points.


Markets
U.S. Debt Interest Payments Reach $1 Trillion
U.S. debt interest payments have surged past the $1 trillion dollar mark, amid high interest rates and an ever-expanding debt burden.


U.S. Debt Interest Payments Reach $1 Trillion
This was originally posted on our Voronoi app. Download the app for free on iOS or Android and discover incredible data-driven charts from a variety of trusted sources.
The cost of paying for America’s national debt crossed the $1 trillion dollar mark in 2023, driven by high interest rates and a record $34 trillion mountain of debt.
Over the last decade, U.S. debt interest payments have more than doubled amid vast government spending during the pandemic crisis. As debt payments continue to soar, the Congressional Budget Office (CBO) reported that debt servicing costs surpassed defense spending for the first time ever this year.
This graphic shows the sharp rise in U.S. debt payments, based on data from the Federal Reserve.
A $1 Trillion Interest Bill, and Growing
Below, we show how U.S. debt interest payments have risen at a faster pace than at another time in modern history:
| Date | Interest Payments | U.S. National Debt |
|---|---|---|
| 2023 | $1.0T | $34.0T |
| 2022 | $830B | $31.4T |
| 2021 | $612B | $29.6T |
| 2020 | $518B | $27.7T |
| 2019 | $564B | $23.2T |
| 2018 | $571B | $22.0T |
| 2017 | $493B | $20.5T |
| 2016 | $460B | $20.0T |
| 2015 | $435B | $18.9T |
| 2014 | $442B | $18.1T |
| 2013 | $425B | $17.2T |
| 2012 | $417B | $16.4T |
| 2011 | $433B | $15.2T |
| 2010 | $400B | $14.0T |
| 2009 | $354B | $12.3T |
| 2008 | $380B | $10.7T |
| 2007 | $414B | $9.2T |
| 2006 | $387B | $8.7T |
| 2005 | $355B | $8.2T |
| 2004 | $318B | $7.6T |
| 2003 | $294B | $7.0T |
| 2002 | $298B | $6.4T |
| 2001 | $318B | $5.9T |
| 2000 | $353B | $5.7T |
| 1999 | $353B | $5.8T |
| 1998 | $360B | $5.6T |
| 1997 | $368B | $5.5T |
| 1996 | $362B | $5.3T |
| 1995 | $357B | $5.0T |
| 1994 | $334B | $4.8T |
| 1993 | $311B | $4.5T |
| 1992 | $306B | $4.2T |
| 1991 | $308B | $3.8T |
| 1990 | $298B | $3.4T |
| 1989 | $275B | $3.0T |
| 1988 | $254B | $2.7T |
| 1987 | $240B | $2.4T |
| 1986 | $225B | $2.2T |
| 1985 | $219B | $1.9T |
| 1984 | $205B | $1.7T |
| 1983 | $176B | $1.4T |
| 1982 | $157B | $1.2T |
| 1981 | $142B | $1.0T |
| 1980 | $113B | $930.2B |
| 1979 | $96B | $845.1B |
| 1978 | $84B | $789.2B |
| 1977 | $69B | $718.9B |
| 1976 | $61B | $653.5B |
| 1975 | $55B | $576.6B |
| 1974 | $50B | $492.7B |
| 1973 | $45B | $469.1B |
| 1972 | $39B | $448.5B |
| 1971 | $36B | $424.1B |
| 1970 | $35B | $389.2B |
| 1969 | $30B | $368.2B |
| 1968 | $25B | $358.0B |
| 1967 | $23B | $344.7B |
| 1966 | $21B | $329.3B |
Interest payments represent seasonally adjusted annual rate at the end of Q4.
At current rates, the U.S. national debt is growing by a remarkable $1 trillion about every 100 days, equal to roughly $3.6 trillion per year.
As the national debt has ballooned, debt payments even exceeded Medicaid outlays in 2023—one of the government’s largest expenditures. On average, the U.S. spent more than $2 billion per day on interest costs last year. Going further, the U.S. government is projected to spend a historic $12.4 trillion on interest payments over the next decade, averaging about $37,100 per American.
Exacerbating matters is that the U.S. is running a steep deficit, which stood at $1.1 trillion for the first six months of fiscal 2024. This has accelerated due to the 43% increase in debt servicing costs along with a $31 billion dollar increase in defense spending from a year earlier. Additionally, a $30 billion increase in funding for the Federal Deposit Insurance Corporation in light of the regional banking crisis last year was a major contributor to the deficit increase.
Overall, the CBO forecasts that roughly 75% of the federal deficit’s increase will be due to interest costs by 2034.

-

 Markets2 weeks ago
Visualizing America’s Shortage of Affordable Homes
-

 Technology1 week ago
Ranked: Semiconductor Companies by Industry Revenue Share
-

 Money1 week ago
Which States Have the Highest Minimum Wage in America?
-

 Real Estate1 week ago
Ranked: The Most Valuable Housing Markets in America
-

 Business1 week ago
Charted: Big Four Market Share by S&P 500 Audits
-

 AI1 week ago
The Stock Performance of U.S. Chipmakers So Far in 2024
-

 Misc2 weeks ago
Almost Every EV Stock is Down After Q1 2024
-

 Money2 weeks ago
Where Does One U.S. Tax Dollar Go?