Technology
Visualizing the Jobs Lost to Automation
Visualizing the Jobs Lost to Automation
The employment landscape of the future will look very different than it does today.
While we’ve charted the automation potential of U.S. jobs before, today’s graphic from Henrik Lindberg perhaps tells the story more succinctly.
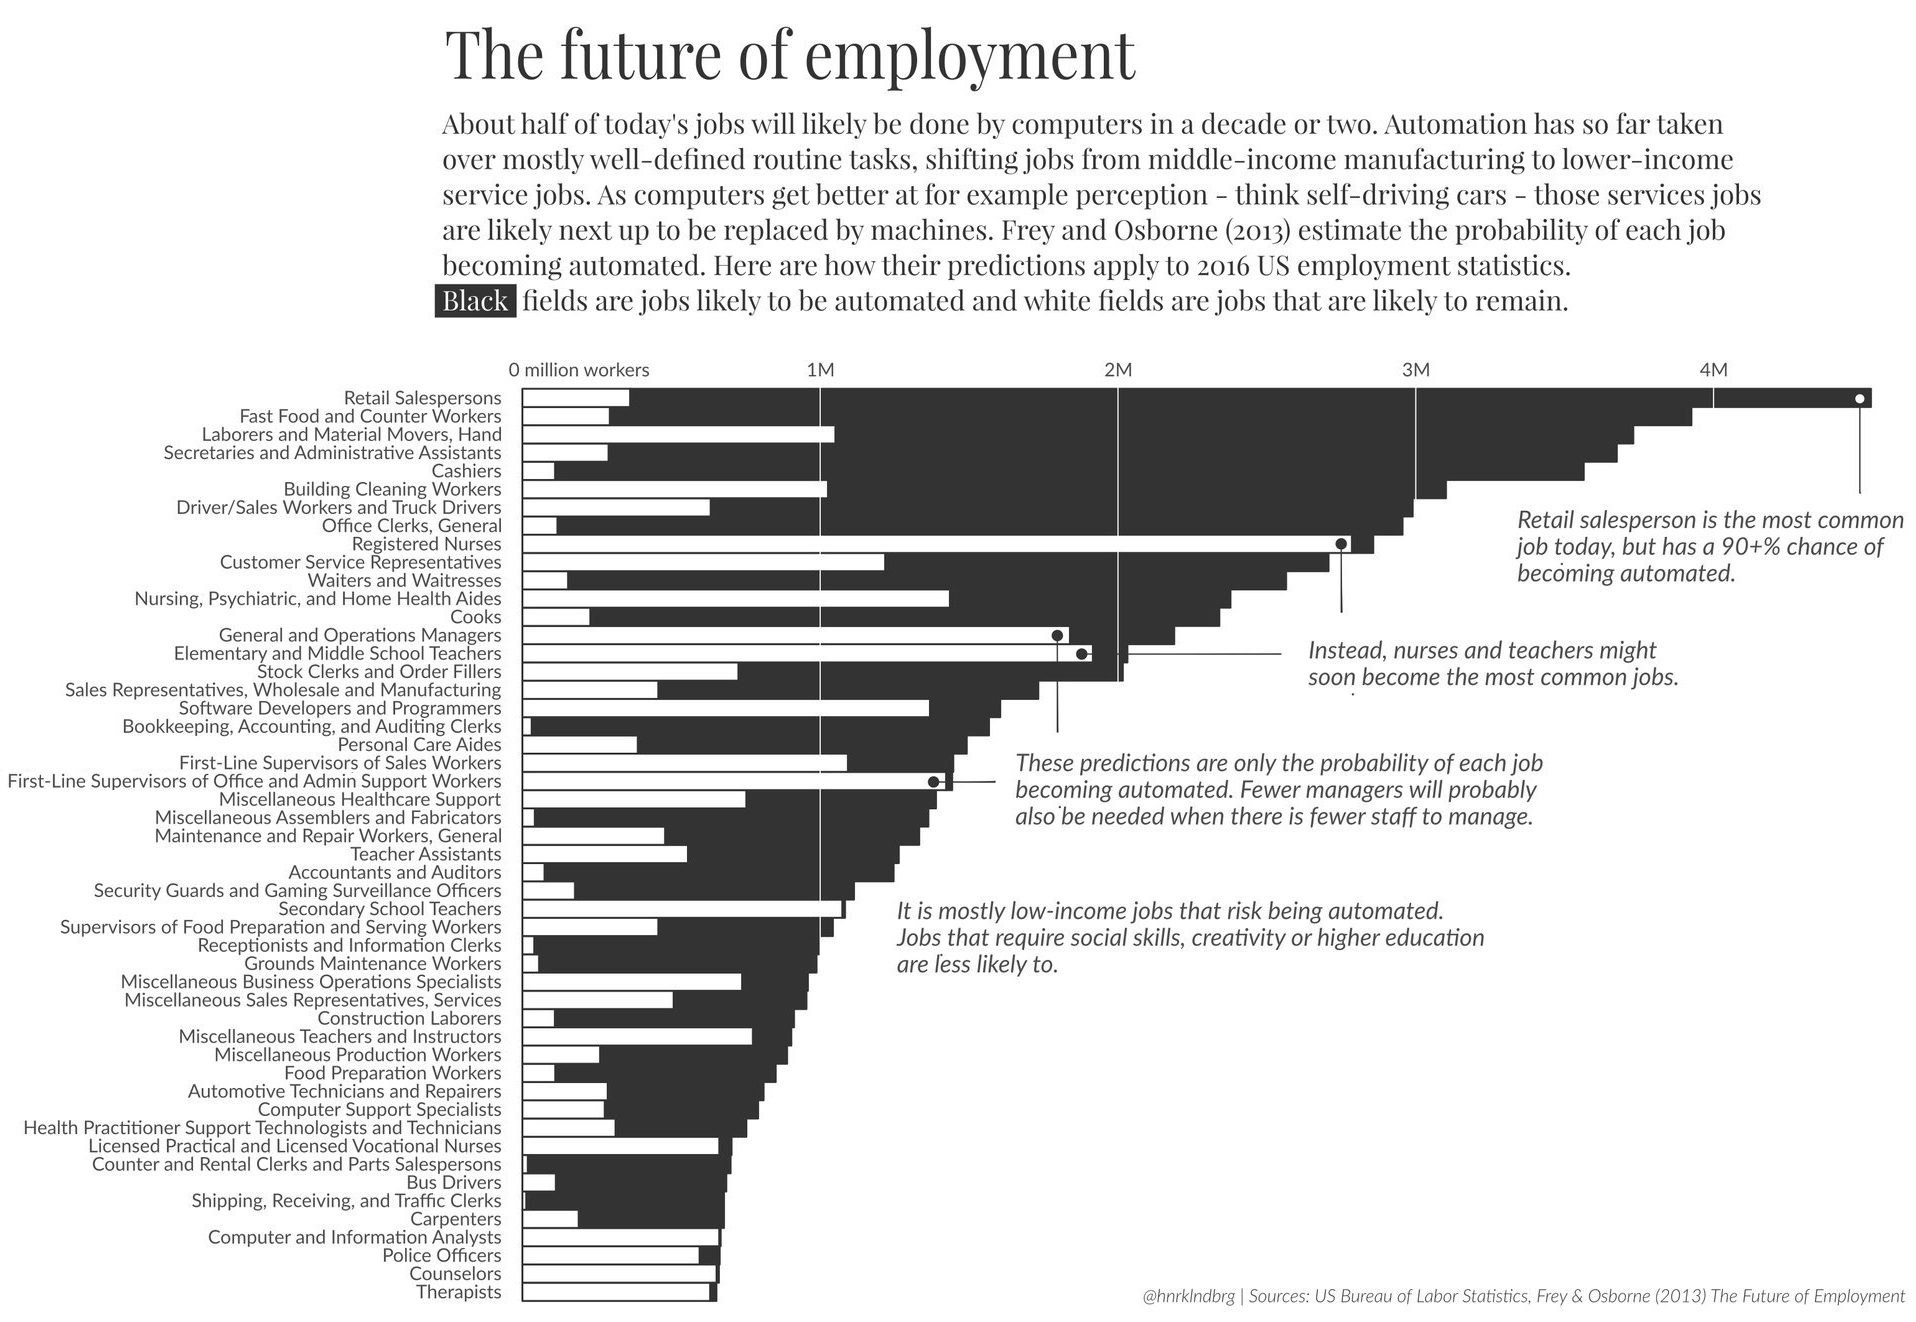
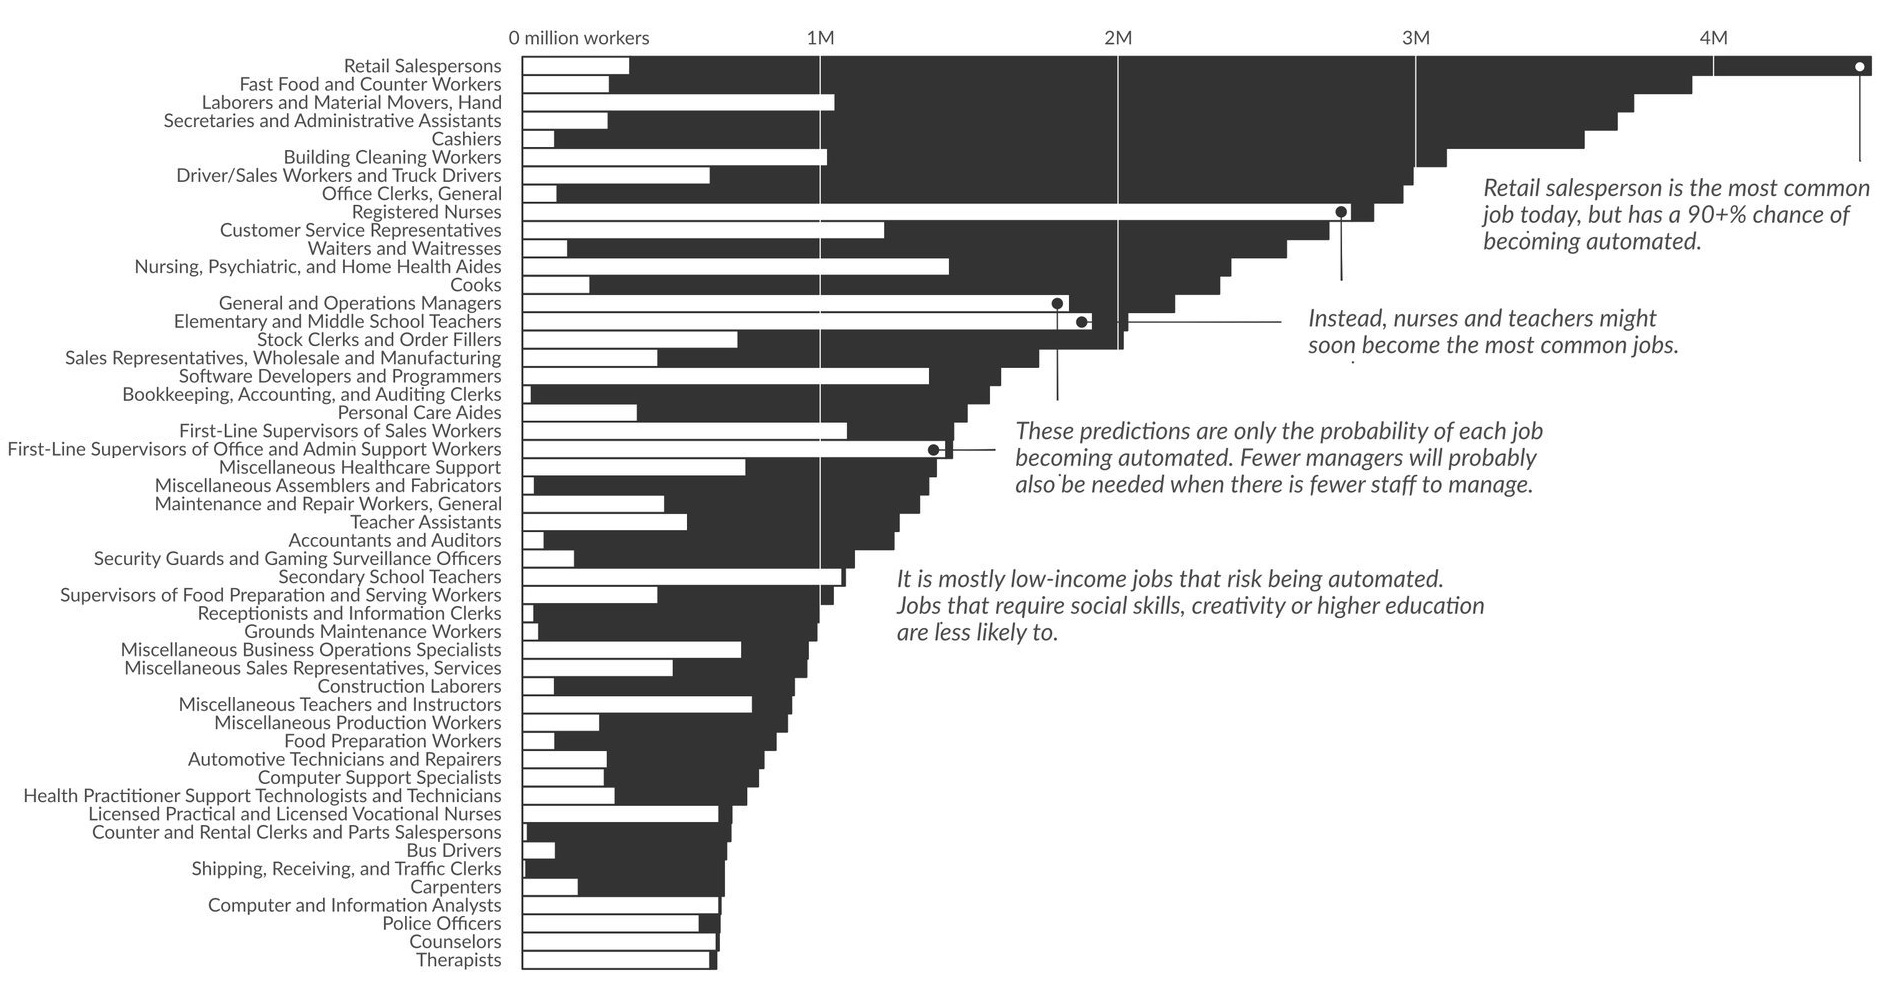
In plain black and white, it shows the jobs that exist today in contrast to the jobs that are expected to disappear as a result of automation in the workplace. Though, technically speaking, it is applying the probabilities of the widely-cited Frey & Osborne (2013) study to U.S. jobs as of 2016 to give an expected value to each job title.
A Different Landscape
In the near-future, many of today’s most common jobs may be changed profoundly. People working as retail salespersons, cashiers, fast food counter workers, and truck drivers will likely see opportunities in those fields dry up as automation takes place.
At the same time, jobs such as those in teaching and nursing are expected to stand the test of time, as they require empathy, creativity, and a human touch not yet available through machines. In the coming decades, it’s possible that these could even be professions that employ the most people overall.
Casualties of the Fall?
In the vastly different employment landscape of the future, the worry is that low income workers will have fewer opportunities available to them as technology comes into play.
The good news? Historically this has not been true. As an example, nearly 500 years ago, Queen Elizabeth I had a similar fear when she denied a patent for an automated knitting machine. The thought was that the machine would kill jobs, though eventually factories and companies adopted similar technologies anyways. With the lower prices, higher demand for knitted goods, and more capital for investment, jobs for factory weavers actually quadrupled in the coming years.
As we’ve seen over time, while machines destroy jobs, they also often create new ones.
Composition of U.S. Job Market over the Last 150+ Years
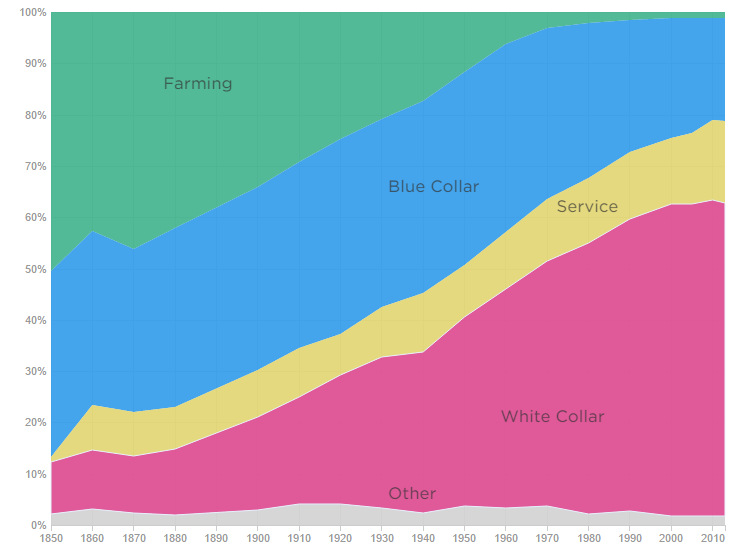
The bad news? It is now clear that agricultural jobs of the early 20th century were replaced with the white collar jobs of today. However, it is much more difficult to forecast out how some of the jobs of the future will be created, especially for low income workers.
The knitting example above certainly applies in some situations – but in others, it’s hard to say what will happen. For example, with millions of unemployed long-haul truck drivers, what roles will these people be taking in the future job market?
Even with costs of transportation and logistics going down, increased demand, and more capital to invest, it seems that there’s going to be a lengthy period of time where many of these people will have trouble finding work.
Do they join the company to help manage the many more trucks that are self-driving? It’s unlikely, and that is the part of the optimism about automation and future jobs that is the hardest to reconcile.


Technology
Ranked: Semiconductor Companies by Industry Revenue Share
Nvidia is coming for Intel’s crown. Samsung is losing ground. AI is transforming the space. We break down revenue for semiconductor companies.


Semiconductor Companies by Industry Revenue Share
This was originally posted on our Voronoi app. Download the app for free on Apple or Android and discover incredible data-driven charts from a variety of trusted sources.
Did you know that some computer chips are now retailing for the price of a new BMW?
As computers invade nearly every sphere of life, so too have the chips that power them, raising the revenues of the businesses dedicated to designing them.
But how did various chipmakers measure against each other last year?
We rank the biggest semiconductor companies by their percentage share of the industry’s revenues in 2023, using data from Omdia research.
Which Chip Company Made the Most Money in 2023?
Market leader and industry-defining veteran Intel still holds the crown for the most revenue in the sector, crossing $50 billion in 2023, or 10% of the broader industry’s topline.
All is not well at Intel, however, with the company’s stock price down over 20% year-to-date after it revealed billion-dollar losses in its foundry business.
| Rank | Company | 2023 Revenue | % of Industry Revenue |
|---|---|---|---|
| 1 | Intel | $51B | 9.4% |
| 2 | NVIDIA | $49B | 9.0% |
| 3 | Samsung Electronics | $44B | 8.1% |
| 4 | Qualcomm | $31B | 5.7% |
| 5 | Broadcom | $28B | 5.2% |
| 6 | SK Hynix | $24B | 4.4% |
| 7 | AMD | $22B | 4.1% |
| 8 | Apple | $19B | 3.4% |
| 9 | Infineon Tech | $17B | 3.2% |
| 10 | STMicroelectronics | $17B | 3.2% |
| 11 | Texas Instruments | $17B | 3.1% |
| 12 | Micron Technology | $16B | 2.9% |
| 13 | MediaTek | $14B | 2.6% |
| 14 | NXP | $13B | 2.4% |
| 15 | Analog Devices | $12B | 2.2% |
| 16 | Renesas Electronics Corporation | $11B | 1.9% |
| 17 | Sony Semiconductor Solutions Corporation | $10B | 1.9% |
| 18 | Microchip Technology | $8B | 1.5% |
| 19 | Onsemi | $8B | 1.4% |
| 20 | KIOXIA Corporation | $7B | 1.3% |
| N/A | Others | $126B | 23.2% |
| N/A | Total | $545B | 100% |
Note: Figures are rounded. Totals and percentages may not sum to 100.
Meanwhile, Nvidia is very close to overtaking Intel, after declaring $49 billion of topline revenue for 2023. This is more than double its 2022 revenue ($21 billion), increasing its share of industry revenues to 9%.
Nvidia’s meteoric rise has gotten a huge thumbs-up from investors. It became a trillion dollar stock last year, and broke the single-day gain record for market capitalization this year.
Other chipmakers haven’t been as successful. Out of the top 20 semiconductor companies by revenue, 12 did not match their 2022 revenues, including big names like Intel, Samsung, and AMD.
The Many Different Types of Chipmakers
All of these companies may belong to the same industry, but they don’t focus on the same niche.
According to Investopedia, there are four major types of chips, depending on their functionality: microprocessors, memory chips, standard chips, and complex systems on a chip.
Nvidia’s core business was once GPUs for computers (graphics processing units), but in recent years this has drastically shifted towards microprocessors for analytics and AI.
These specialized chips seem to be where the majority of growth is occurring within the sector. For example, companies that are largely in the memory segment—Samsung, SK Hynix, and Micron Technology—saw peak revenues in the mid-2010s.

-

 Real Estate2 weeks ago
Visualizing America’s Shortage of Affordable Homes
-

 Technology1 week ago
Ranked: Semiconductor Companies by Industry Revenue Share
-

 Money1 week ago
Which States Have the Highest Minimum Wage in America?
-

 Real Estate1 week ago
Ranked: The Most Valuable Housing Markets in America
-

 Business1 week ago
Charted: Big Four Market Share by S&P 500 Audits
-

 AI1 week ago
The Stock Performance of U.S. Chipmakers So Far in 2024
-

 Misc2 weeks ago
Almost Every EV Stock is Down After Q1 2024
-

 Money2 weeks ago
Where Does One U.S. Tax Dollar Go?