Misc
Visualizing the Gravitational Pull of the Planets
Visualizing the Gravitational Pull of the Planets
Gravity is one of the basic forces in the universe. Every object out there exerts a gravitational influence on every other object, but to what degree?
The gravity of the sun keeps all the planets in orbit in our solar system. However, each planet, moon and asteroid have their own gravitational pull defined by their density, size, mass, and proximity to other celestial bodies.
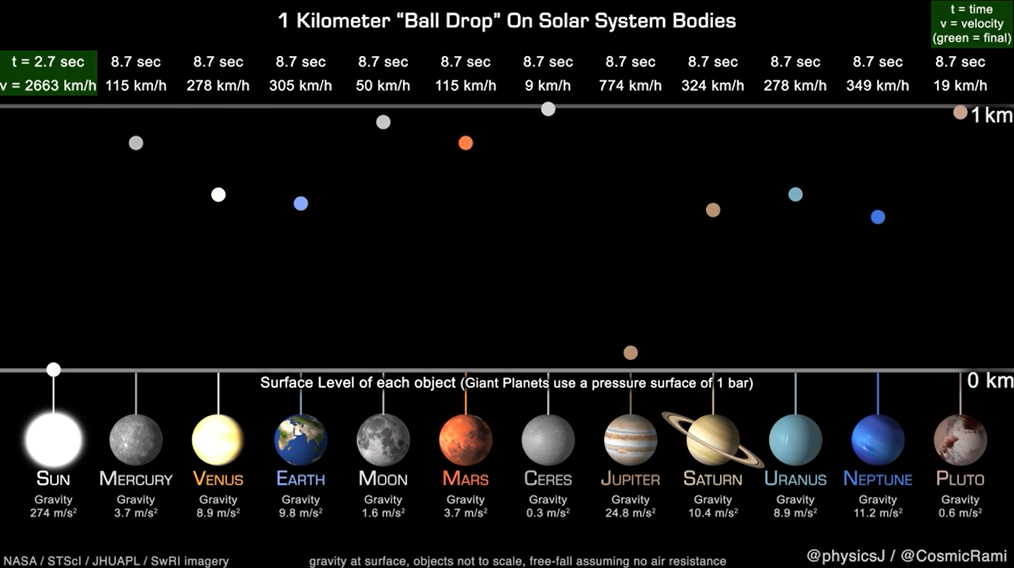
Dr. James O’Donoghue, a Planetary Astronomer at JAXA (Japan Aerospace Exploration Agency) created an animation that simplifies this concept by animating the time it takes a ball to drop from 1,000 meters to the surface of each planet and the Earth’s moon, assuming no air resistance, to better visualize the gravitational pull of the planets.
Sink like a Stone or Float like a Feather
Now, if you were hypothetically landing your spacecraft on a strange planet, you would want to know your rate of descent. Would you float like a feather or sink like a stone?
It is a planet’s size, mass, and density that determines how strong its gravitational pull is, or, how quick or slow you will approach the surface.
| Mass (1024kg) | Diameter (km) | Density (kg/m3) | Gravity (m/s2) | Escape Velocity (km/s) | |
|---|---|---|---|---|---|
| Mercury | 0.33 | 4,879 | 5,427 | 3.7 | 4.3 |
| Venus | 4.87 | 12,104 | 5,243 | 8.9 | 10.4 |
| Earth | 5.97 | 12,756 | 5,514 | 9.8 | 11.2 |
| Moon | 0.073 | 3,475 | 3,340 | 1.6 | 2.4 |
| Mars | 0.642 | 6,792 | 3,933 | 3.7 | 5.0 |
| Jupiter | 1,898 | 142,984 | 1,326 | 23.1 | 59.5 |
| Saturn | 568 | 120,536 | 687 | 9.0 | 35.5 |
| Uranus | 86.8 | 51,118 | 1,271 | 8.7 | 21.3 |
| Neptune | 102 | 49,528 | 1,638 | 11.0 | 23.5 |
| Pluto | 0.0146 | 2,370 | 2,095 | 0.7 | 1.3 |
According to Dr. O’Donoghue, large planets have gravity comparable to smaller ones at the surface—for example, Uranus attracts the ball down slower than on Earth. This is because the relatively low average density of Uranus puts the actual surface of the planet far away from the majority of the planet’s mass in the core.
Similarly, Mars is almost double the mass of Mercury, but you can see the surface gravity is actually the same which demonstrates that Mercury is much denser than Mars.
Exploring the Outer Reaches: Gravity Assistance
Knowing the pull of each of the planets can help propel space flight to the furthest extents of the solar system. The “gravity assist” flyby technique can add or subtract momentum to increase or decrease the energy of a spacecraft’s orbit.
Generally it has been used in solar orbit, to increase a spacecraft’s velocity and propel it outward in the solar system, much farther away from the sun than its launch vehicle would have been capable of doing, as in the journey of NASA’s Voyager 2.
Launched in 1977, Voyager 2 flew by Jupiter for reconnaissance, and for a trajectory boost to Saturn. It then relied on a gravity assist from Saturn and then another from Uranus, propelling it to Neptune and beyond.
Despite the assistance, Voyager 2’s journey still took over 20 years to reach the edge of the solar system. The potential for using the power of gravity is so much more…
Tractor Beams, Shields, and Warp Drives…Oh My!
Imagine disabling an enemy starship with a gravity beam and deflecting an incoming photon torpedo with gravity shields. It would be incredible and a sci-fi dream come true.
However, technology is still 42 years from the fictional date in Star Trek when mankind built the first warp engine, harnessing the power of gravity and unlocking the universe for discovery. There is still time!
Currently, the ALPHA Experiment at CERN is investigating whether it is possible to create some form of anti-gravitational field. This research could create a gravitational conductor shield to counteract the forces of gravity and allow the creation of a warp drive.
By better understanding the forces that keep us grounded on our planets, the sooner we will be able to escape these forces and feel the gravitational pull of the planets for ourselves.
…to boldly go where no one has gone before!


Misc
How Hard Is It to Get Into an Ivy League School?
We detail the admission rates and average annual cost for Ivy League schools, as well as the median SAT scores required to be accepted.


How Hard Is It to Get Into an Ivy League School?
This was originally posted on our Voronoi app. Download the app for free on iOS or Android and discover incredible data-driven charts from a variety of trusted sources.
Ivy League institutions are renowned worldwide for their academic excellence and long-standing traditions. But how hard is it to get into one of the top universities in the U.S.?
In this graphic, we detail the admission rates and average annual cost for Ivy League schools, as well as the median SAT scores required to be accepted. The data comes from the National Center for Education Statistics and was compiled by 24/7 Wall St.
Note that “average annual cost” represents the net price a student pays after subtracting the average value of grants and/or scholarships received.
Harvard is the Most Selective
The SAT is a standardized test commonly used for college admissions in the United States. It’s taken by high school juniors and seniors to assess their readiness for college-level academic work.
When comparing SAT scores, Harvard and Dartmouth are among the most challenging universities to gain admission to. The median SAT scores for their students are 760 for reading and writing and 790 for math. Still, Harvard has half the admission rate (3.2%) compared to Dartmouth (6.4%).
| School | Admission rate (%) | SAT Score: Reading & Writing | SAT Score: Math | Avg Annual Cost* |
|---|---|---|---|---|
| Harvard University | 3.2 | 760 | 790 | $13,259 |
| Columbia University | 3.9 | 750 | 780 | $12,836 |
| Yale University | 4.6 | 760 | 780 | $16,341 |
| Brown University | 5.1 | 760 | 780 | $26,308 |
| Princeton University | 5.7 | 760 | 780 | $11,080 |
| Dartmouth College | 6.4 | 760 | 790 | $33,023 |
| University of Pennsylvania | 6.5 | 750 | 790 | $14,851 |
| Cornell University | 7.5 | 750 | 780 | $29,011 |
*Costs after receiving federal financial aid.
Additionally, Dartmouth has the highest average annual cost at $33,000. Princeton has the lowest at $11,100.
While student debt has surged in the United States in recent years, hitting $1.73 trillion in 2023, the worth of obtaining a degree from any of the schools listed surpasses mere academics. This is evidenced by the substantial incomes earned by former students.
Harvard grads, for example, have the highest average starting salary in the country, at $91,700.

-

 Real Estate2 weeks ago
Visualizing America’s Shortage of Affordable Homes
-

 Technology1 week ago
Ranked: Semiconductor Companies by Industry Revenue Share
-

 Money1 week ago
Which States Have the Highest Minimum Wage in America?
-

 Real Estate1 week ago
Ranked: The Most Valuable Housing Markets in America
-

 Business2 weeks ago
Charted: Big Four Market Share by S&P 500 Audits
-

 AI2 weeks ago
The Stock Performance of U.S. Chipmakers So Far in 2024
-

 Misc2 weeks ago
Almost Every EV Stock is Down After Q1 2024
-

 Money2 weeks ago
Where Does One U.S. Tax Dollar Go?