Markets
Visualizing the Global Weapons Trade
The Global Weapons Trade
To see the full version of this visualization click here.
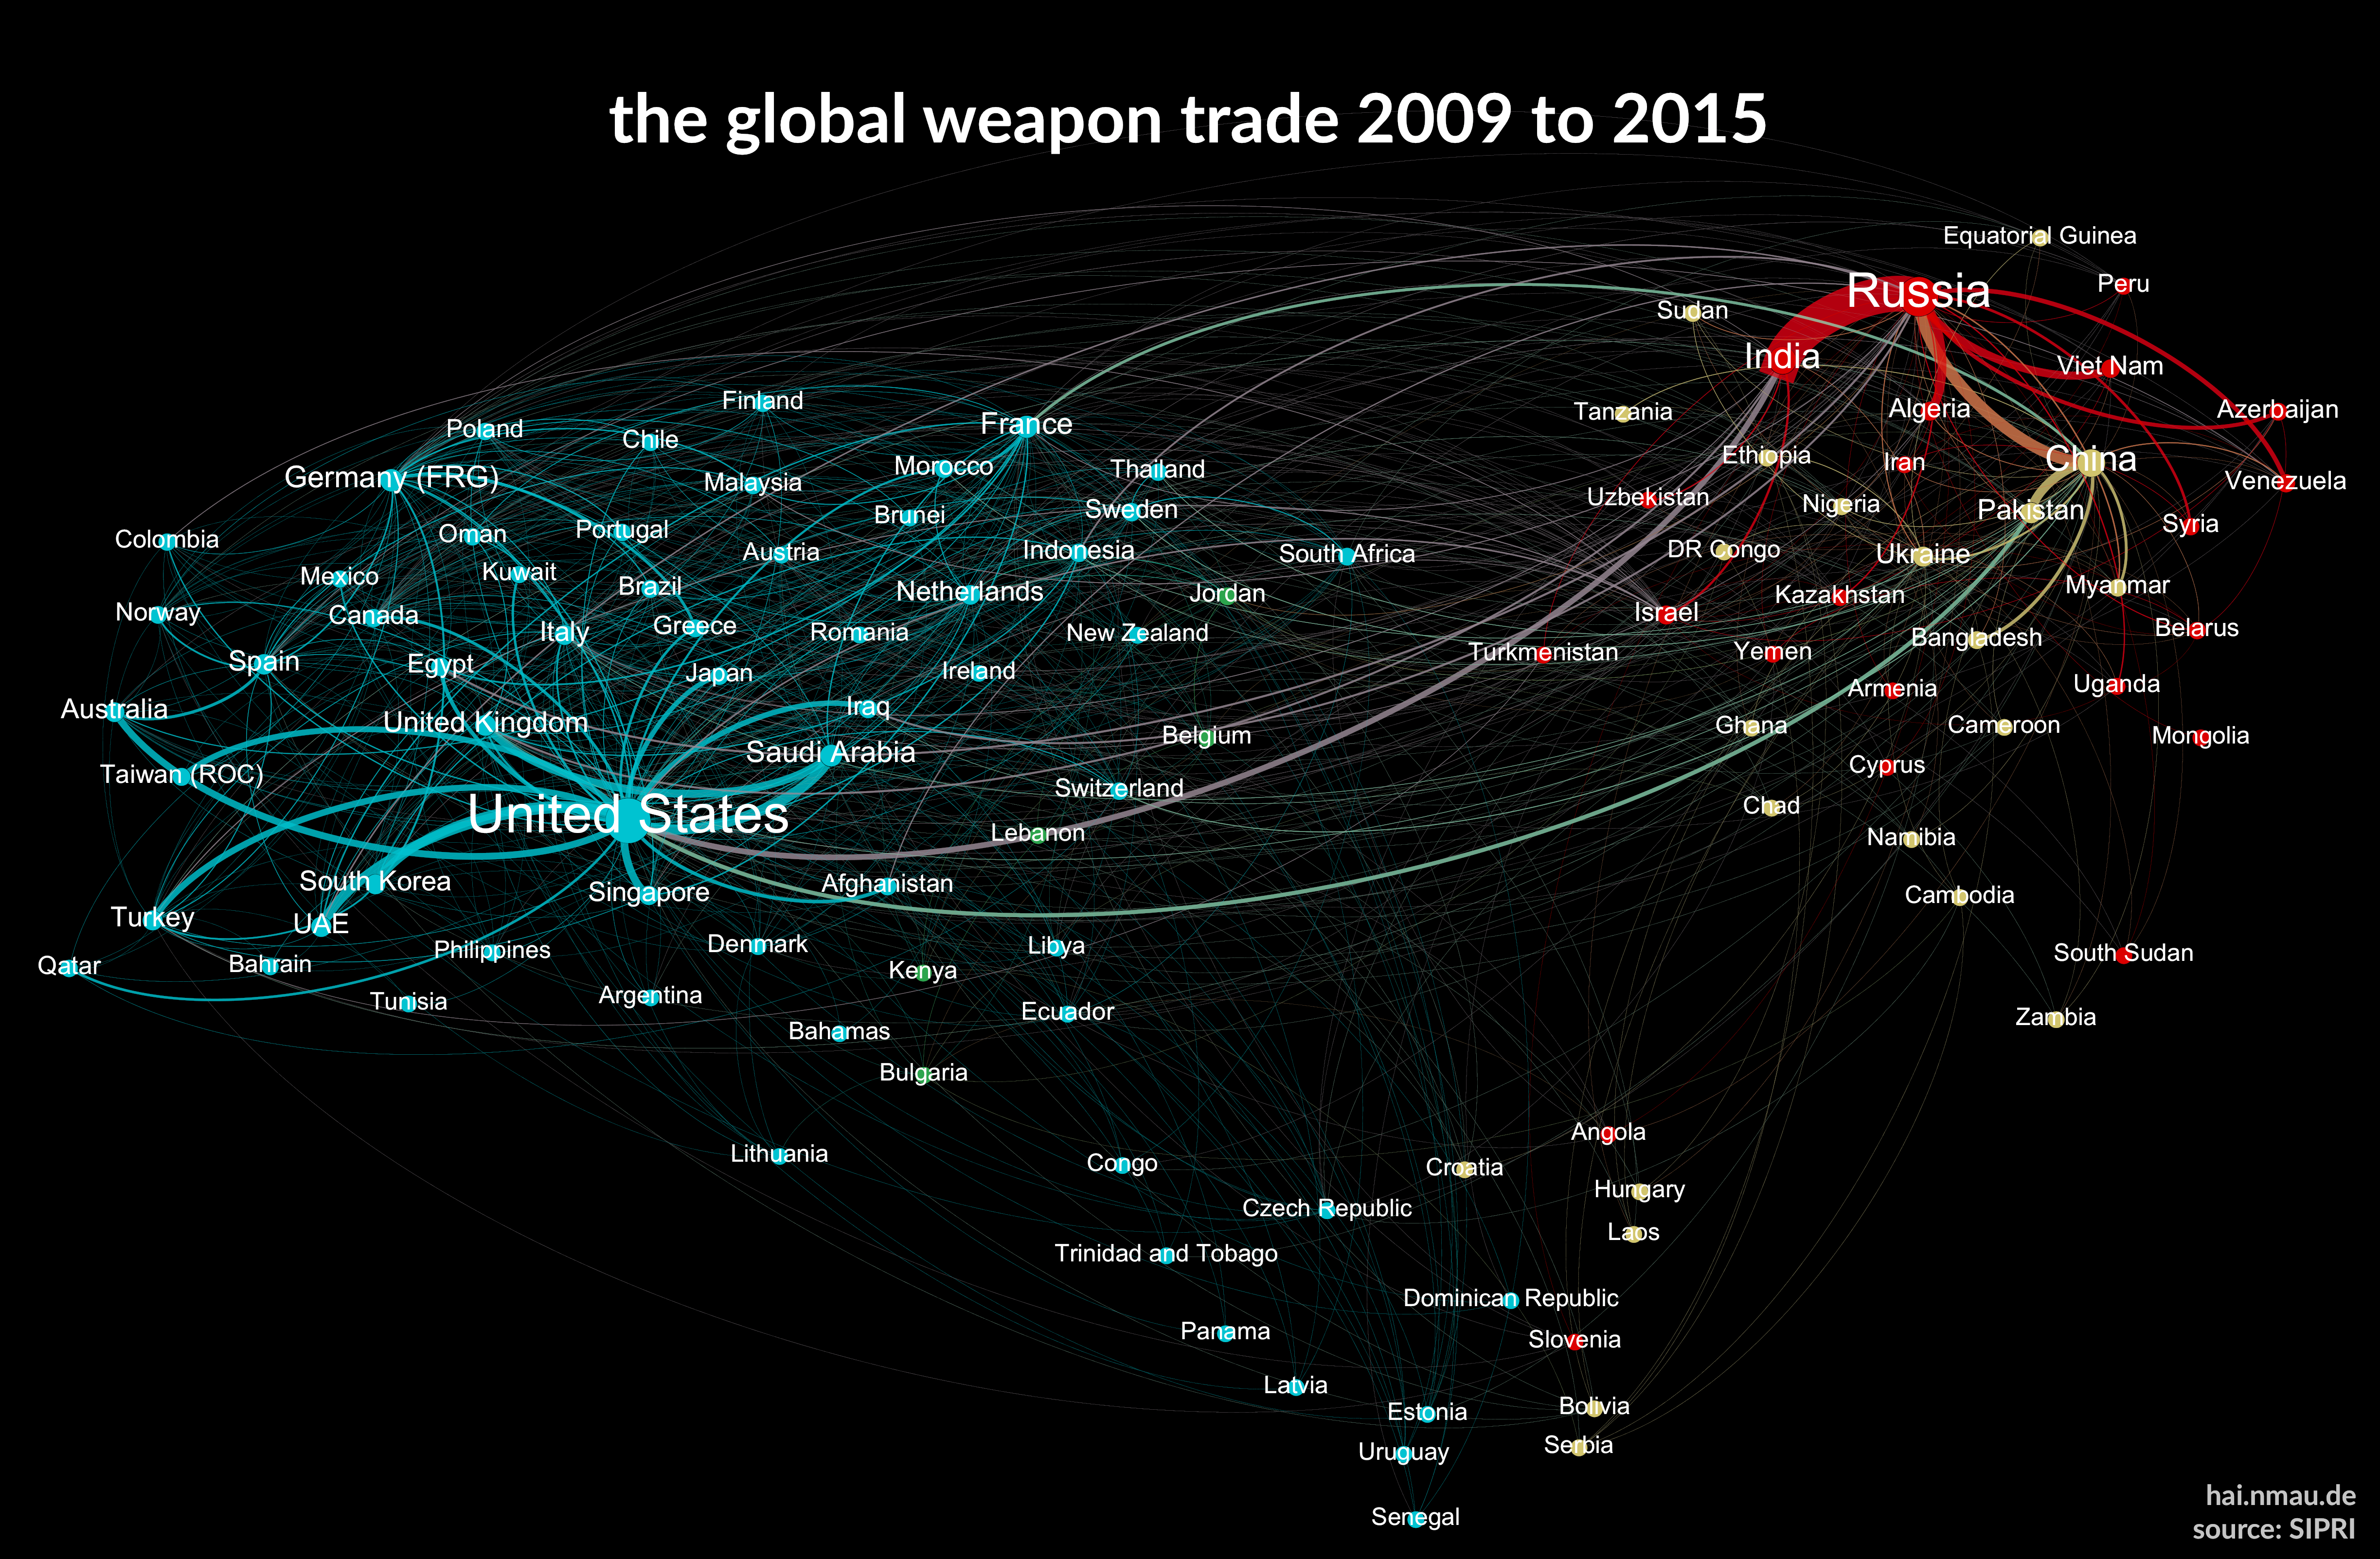
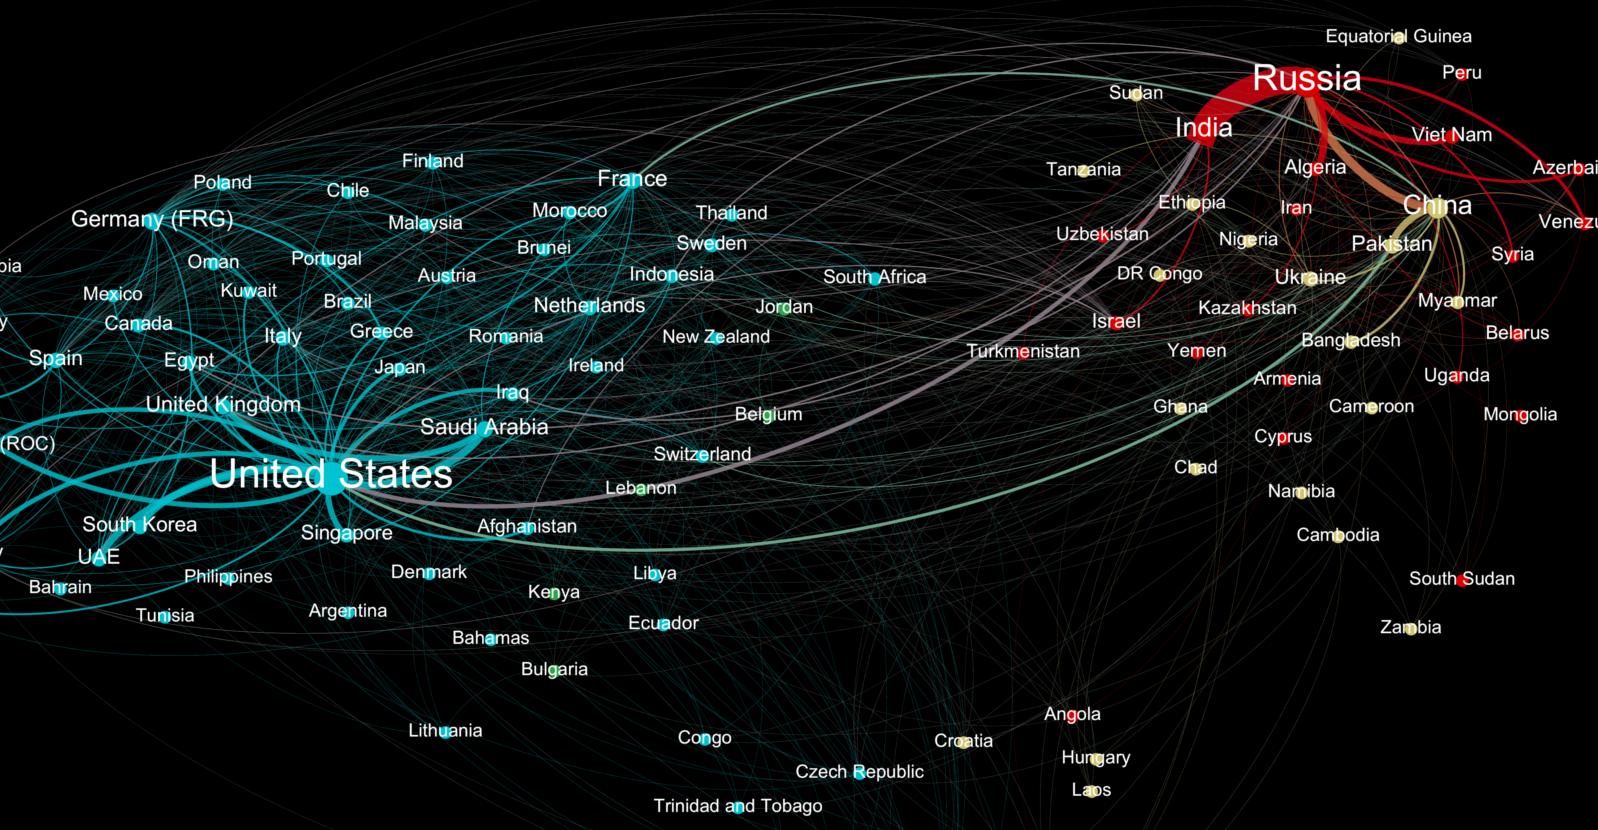
The above visualization sums up the global weapons trade during the Obama era, minus data from 2016. It was created by data scientist Hai Nguyen Mau, and each relationship plots the value of the weapons trade between two countries based on data from SIPRI.
It’s important to note that while this data includes major weaponry transfers such as tanks, jets, missiles, and ships, it excludes guns and ammunition or military aid. Lastly, the thickness of each line represents the total value of each trade relationship, while the proximity of two linked countries shows how close each relationship is. (i.e. if a country only imports from Russia, they will be much closer to Russia than the U.S.)
A Longtail Distribution
The global weapons trade is dominated by a few major exporters, such as United States, EU, and Russia:
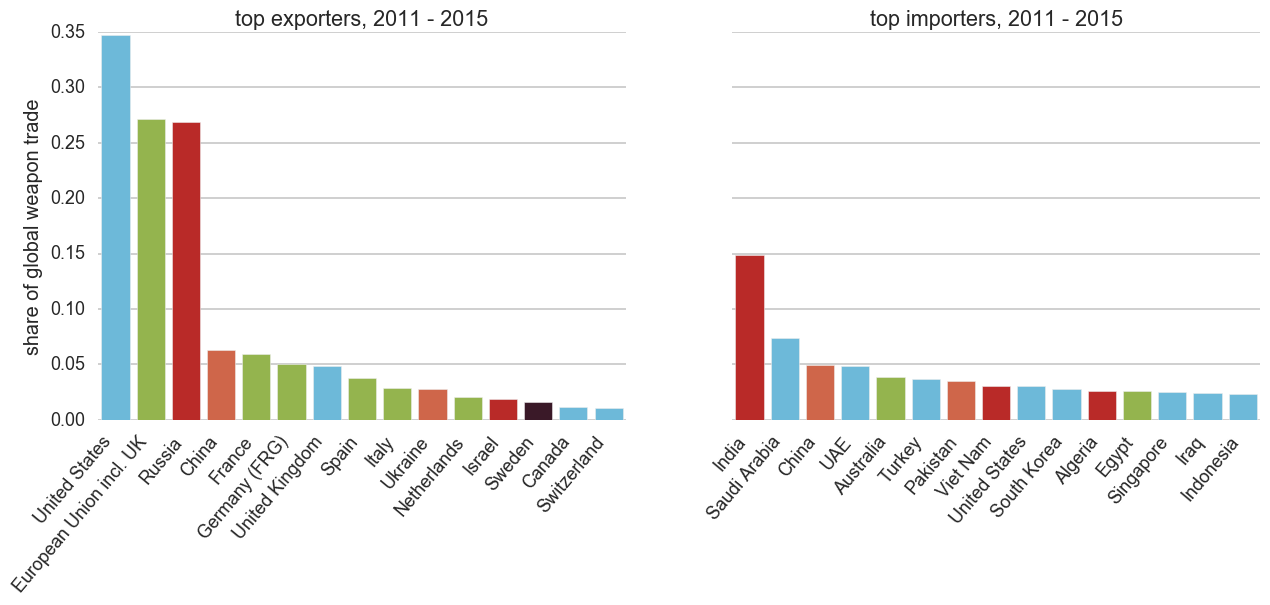
Together, the United States, European Union, and Russia combine for over 80% of weapons exports, while the rest of the world fills out the “longtail” of the exporter distribution.
From the perspective of imports, the field is much more equal because almost every country aims to spend at least some money on defense. India is the largest importer of weapons in the world with a 14% share of the market.
Two Distinct Blocs
The picture behind the global weapons trade gets much more interesting as it is broken up into relationships. It’s easy to see that there are two distinct blocs of trade:
The West: United States, United Kingdom, Canada, most of the EU, and other countries
The East: Russia, China, India, Nigeria, and other countries
As an example, Singapore imports 71% of its weapons from the United States along with significant amounts from Germany (10%) and Sweden (6%). As such, it is very close to the United States in these visualizations.
Meanwhile, India imports 70% of its arms from Russia, with the U.S. (12%) and Israel (7%) as other major partners.
Here’s another look from Hai Nguyen Mau that just focuses on U.S. and Russian relationships:
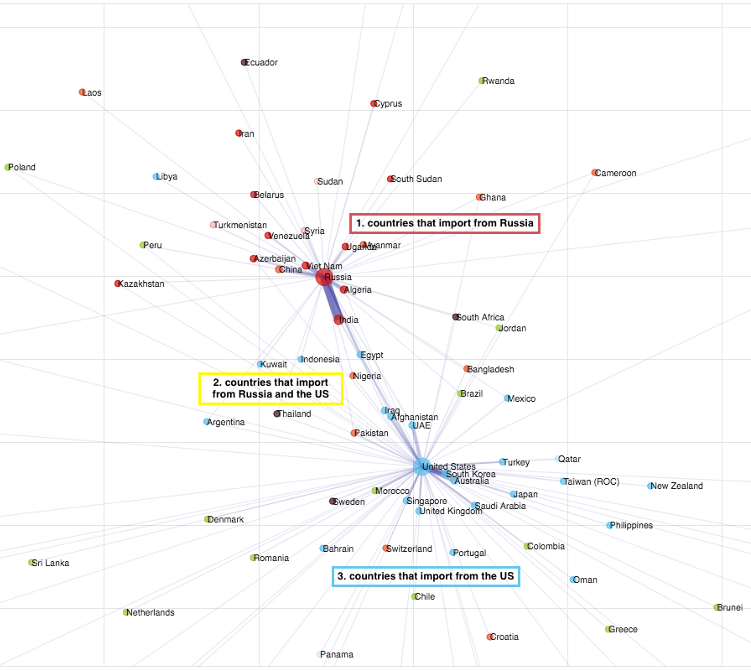
An oversimplication, to be sure – but these visualizations hint at the broader tensions that have recently surfaced to the forefront of geopolitical discourse.


Economy
Economic Growth Forecasts for G7 and BRICS Countries in 2024
The IMF has released its economic growth forecasts for 2024. How do the G7 and BRICS countries compare?


G7 & BRICS Real GDP Growth Forecasts for 2024
The International Monetary Fund’s (IMF) has released its real gross domestic product (GDP) growth forecasts for 2024, and while global growth is projected to stay steady at 3.2%, various major nations are seeing declining forecasts.
This chart visualizes the 2024 real GDP growth forecasts using data from the IMF’s 2024 World Economic Outlook for G7 and BRICS member nations along with Saudi Arabia, which is still considering an invitation to join the bloc.
Get the Key Insights of the IMF’s World Economic Outlook
Want a visual breakdown of the insights from the IMF’s 2024 World Economic Outlook report?
This visual is part of a special dispatch of the key takeaways exclusively for VC+ members.
Get the full dispatch of charts by signing up to VC+.
Mixed Economic Growth Prospects for Major Nations in 2024
Economic growth projections by the IMF for major nations are mixed, with the majority of G7 and BRICS countries forecasted to have slower growth in 2024 compared to 2023.
Only three BRICS-invited or member countries, Saudi Arabia, the UAE, and South Africa, have higher projected real GDP growth rates in 2024 than last year.
| Group | Country | Real GDP Growth (2023) | Real GDP Growth (2024P) |
|---|---|---|---|
| G7 | 🇺🇸 U.S. | 2.5% | 2.7% |
| G7 | 🇨🇦 Canada | 1.1% | 1.2% |
| G7 | 🇯🇵 Japan | 1.9% | 0.9% |
| G7 | 🇫🇷 France | 0.9% | 0.7% |
| G7 | 🇮🇹 Italy | 0.9% | 0.7% |
| G7 | 🇬🇧 UK | 0.1% | 0.5% |
| G7 | 🇩🇪 Germany | -0.3% | 0.2% |
| BRICS | 🇮🇳 India | 7.8% | 6.8% |
| BRICS | 🇨🇳 China | 5.2% | 4.6% |
| BRICS | 🇦🇪 UAE | 3.4% | 3.5% |
| BRICS | 🇮🇷 Iran | 4.7% | 3.3% |
| BRICS | 🇷🇺 Russia | 3.6% | 3.2% |
| BRICS | 🇪🇬 Egypt | 3.8% | 3.0% |
| BRICS-invited | 🇸🇦 Saudi Arabia | -0.8% | 2.6% |
| BRICS | 🇧🇷 Brazil | 2.9% | 2.2% |
| BRICS | 🇿🇦 South Africa | 0.6% | 0.9% |
| BRICS | 🇪🇹 Ethiopia | 7.2% | 6.2% |
| 🌍 World | 3.2% | 3.2% |
China and India are forecasted to maintain relatively high growth rates in 2024 at 4.6% and 6.8% respectively, but compared to the previous year, China is growing 0.6 percentage points slower while India is an entire percentage point slower.
On the other hand, four G7 nations are set to grow faster than last year, which includes Germany making its comeback from its negative real GDP growth of -0.3% in 2023.
Faster Growth for BRICS than G7 Nations
Despite mostly lower growth forecasts in 2024 compared to 2023, BRICS nations still have a significantly higher average growth forecast at 3.6% compared to the G7 average of 1%.
While the G7 countries’ combined GDP is around $15 trillion greater than the BRICS nations, with continued higher growth rates and the potential to add more members, BRICS looks likely to overtake the G7 in economic size within two decades.
BRICS Expansion Stutters Before October 2024 Summit
BRICS’ recent expansion has stuttered slightly, as Argentina’s newly-elected president Javier Milei declined its invitation and Saudi Arabia clarified that the country is still considering its invitation and has not joined BRICS yet.
Even with these initial growing pains, South Africa’s Foreign Minister Naledi Pandor told reporters in February that 34 different countries have submitted applications to join the growing BRICS bloc.
Any changes to the group are likely to be announced leading up to or at the 2024 BRICS summit which takes place October 22-24 in Kazan, Russia.
Get the Full Analysis of the IMF’s Outlook on VC+
This visual is part of an exclusive special dispatch for VC+ members which breaks down the key takeaways from the IMF’s 2024 World Economic Outlook.
For the full set of charts and analysis, sign up for VC+.

-

 Markets1 week ago
U.S. Debt Interest Payments Reach $1 Trillion
-

 Markets2 weeks ago
Ranked: The Most Valuable Housing Markets in America
-

 Money2 weeks ago
Which States Have the Highest Minimum Wage in America?
-

 AI2 weeks ago
Ranked: Semiconductor Companies by Industry Revenue Share
-

 Markets2 weeks ago
Ranked: The World’s Top Flight Routes, by Revenue
-

 Countries2 weeks ago
Population Projections: The World’s 6 Largest Countries in 2075
-

 Markets2 weeks ago
The Top 10 States by Real GDP Growth in 2023
-

 Money2 weeks ago
The Smallest Gender Wage Gaps in OECD Countries