Technology
Visualizing Global Attitudes Towards AI


Comparing Public Sentiment Towards AI, by Country
Artificial intelligence (AI) is one of the fastest growing and most disruptive technologies in the world today. Because it has the potential to drastically impact society, it’s important to measure how people are feeling towards it.
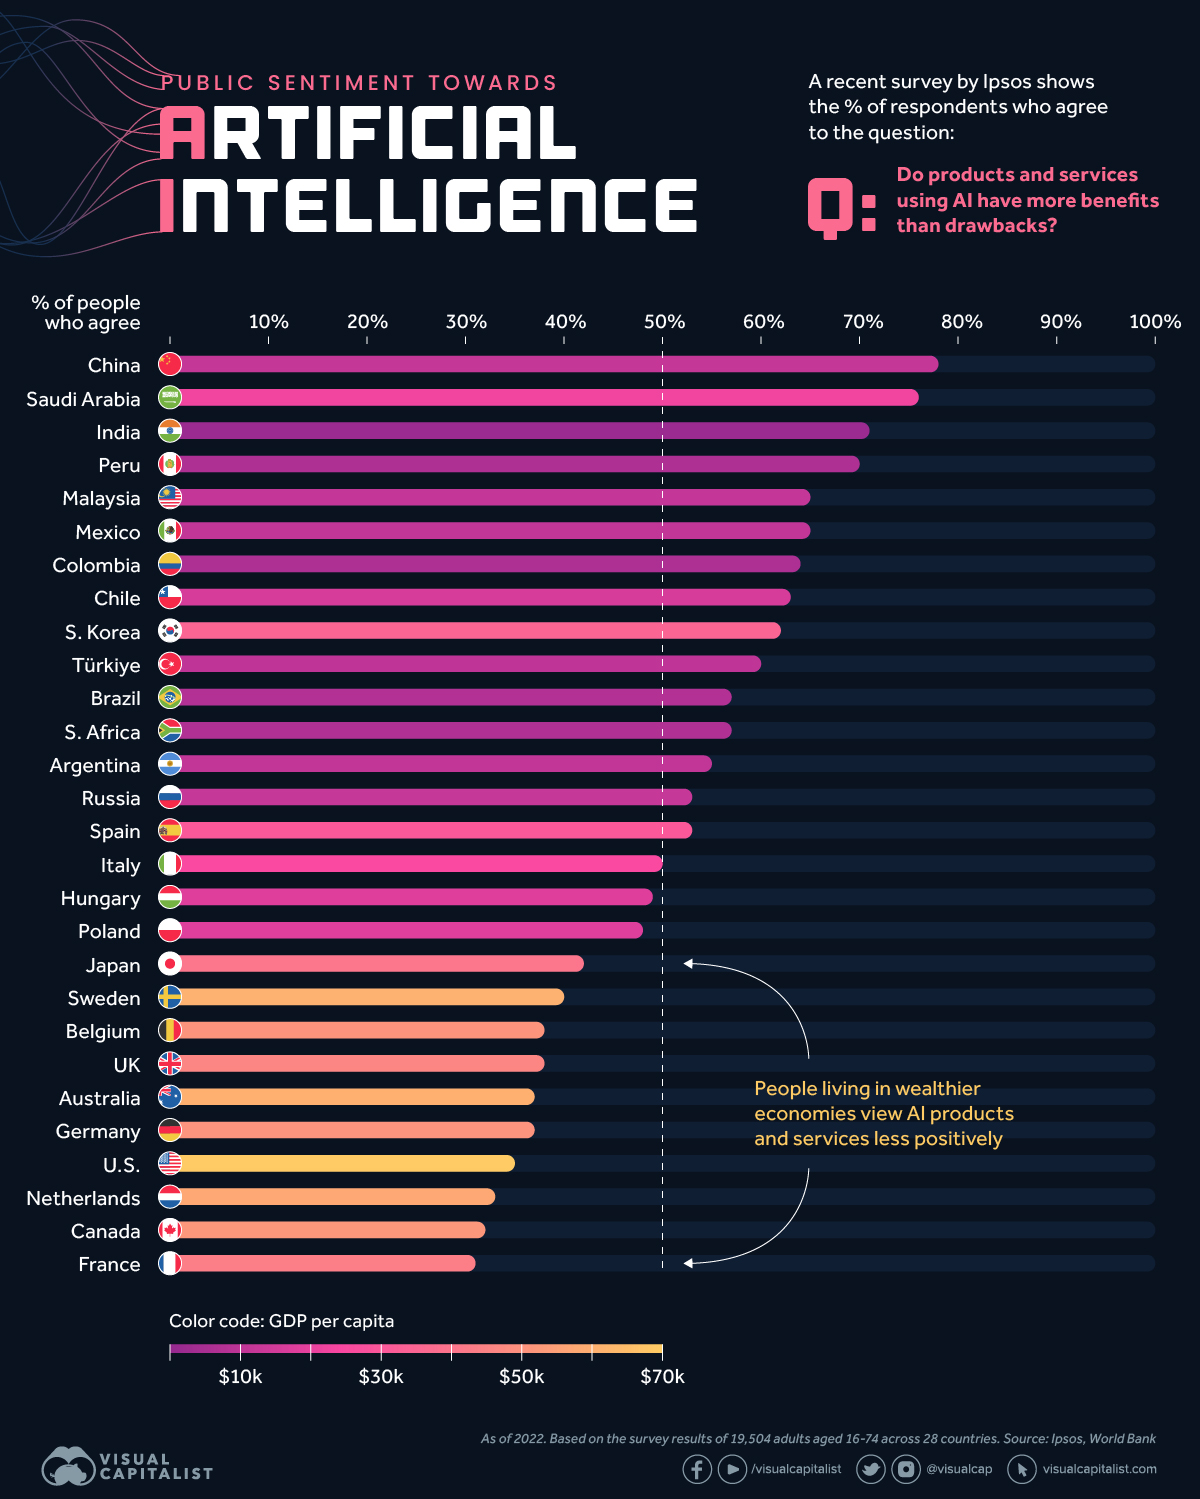
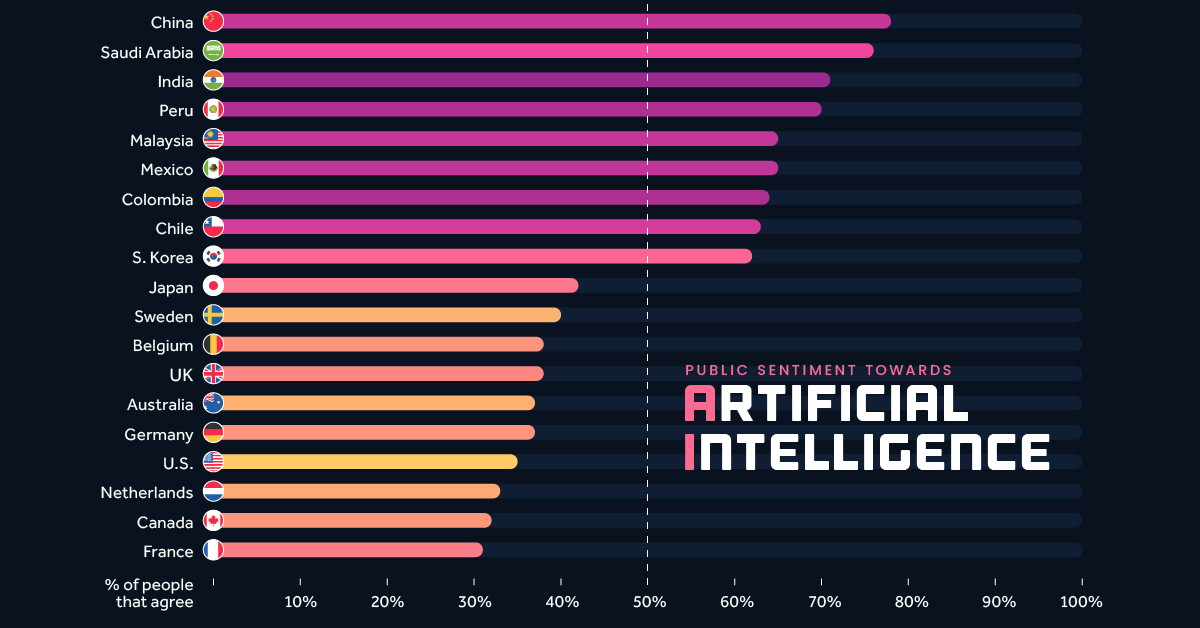
This infographic visualizes survey data from market research firm, Ipsos, to see how attitudes towards AI varies by country. By including each country’s GDP per capita, we can see that wealthier populations are more skeptical about products and services that use the technology.
Data and Methodology
This data is based on a 28-country survey of 19,504 adults aged 18 to 74. Polling took place between November and December 2021, and the results were published in January 2022.
This survey took place before the recent explosion in popularity of generative AI tools such as ChatGPT, DALL-E, and Midjourney, but forms the foundation for how people view this rapidly improving technology.
The table below lists the percentage of respondents who agreed with the following statement:
“Products and services using artificial intelligence have more benefits than drawbacks”
| Country | % Agreeing With Statement | GDP per capita |
|---|---|---|
| China | 78% | $12,556 |
| Saudi Arabia | 76% | $23,186 |
| India | 71% | $2,257 |
| Peru | 70% | $6,622 |
| Malaysia | 65% | $11,109 |
| Mexico | 65% | $10,046 |
| Colombia | 64% | $6,104 |
| Chile | 63% | $16,265 |
| South Korea | 62% | $34,998 |
| Türkiye | 60% | $9,661 |
| Brazil | 57% | $7,507 |
| South Africa | 57% | $7,055 |
| Argentina | 55% | $10,636 |
| Russia | 53% | $12,195 |
| Spain | 53% | $30,104 |
| Italy | 50% | $35,658 |
| Hungary | 49% | $18,728 |
| Poland | 48% | $18,000 |
| Japan | 42% | $39,313 |
| Sweden | 40% | $61,029 |
| Belgium | 38% | $51,247 |
| UK | 38% | $46,510 |
| Australia | 37% | $60,443 |
| Germany | 37% | $51,203 |
| United States | 35% | $70,249 |
| Netherlands | 33% | $57,768 |
| Canada | 32% | $51,988 |
| France | 31% | $43,659 |
GDP per capita as of 2021. Source: World Bank
Ipsos notes that their samples from developing economies like China and India were “more urban, more educated, and more affluent than the general population”. Thus, the results for these countries likely reflect the more tech-savvy segments of their population.
Further Survey Results
Respondents were asked additional questions about AI, which we’ve included in the tables below. Let’s start with this statement:
“Products and services using artificial intelligence make my life easier”
| Country | % Agreeing With Statement | GDP per capita |
|---|---|---|
| China | 87% | $12,556 |
| Saudi Arabia | 80% | $23,186 |
| Peru | 74% | $6,622 |
| South Korea | 74% | $34,998 |
| Mexico | 73% | $10,046 |
| India | 72% | $2,257 |
| Colombia | 71% | $6,104 |
| Malaysia | 71% | $11,109 |
| Türkiye | 71% | $9,661 |
| Chile | 70% | $16,265 |
| South Africa | 67% | $7,055 |
| Brazil | 65% | $7,507 |
| Russia | 64% | $12,195 |
| Argentina | 59% | $10,636 |
| Spain | 59% | $30,104 |
| Poland | 58% | $18,000 |
| Italy | 54% | $35,658 |
| Japan | 52% | $39,313 |
| Hungary | 50% | $18,728 |
| Belgium | 49% | $51,247 |
| Netherlands | 47% | $57,768 |
| Australia | 46% | $60,443 |
| Sweden | 46% | $61,029 |
| Germany | 45% | $51,203 |
| UK | 45% | $46,510 |
| Canada | 44% | $51,988 |
| United States | 41% | $70,249 |
| France | 39% | $43,659 |
As expected, we see a similar trend as in the previous question’s results. It seems that developing countries are embracing AI to greater lengths.
Next, we’ll look at a more forward-looking statement:
“Products and services using AI will profoundly change my daily life in the next 3-5 years”.
| Country | % Agreeing With Statement | GDP per capita |
|---|---|---|
| China | 80% | $12,556 |
| Saudi Arabia | 80% | $23,186 |
| South Korea | 76% | $34,998 |
| India | 74% | $2,257 |
| Türkiye | 73% | $9,661 |
| South Africa | 72% | $7,055 |
| Malaysia | 71% | $11,109 |
| Peru | 71% | $6,622 |
| Chile | 67% | $16,265 |
| Colombia | 65% | $6,104 |
| Mexico | 65% | $10,046 |
| Brazil | 61% | $7,507 |
| Argentina | 60% | $10,636 |
| Russia | 60% | $12,195 |
| Poland | 56% | $18,000 |
| Spain | 56% | $30,104 |
| Hungary | 55% | $18,728 |
| Italy | 53% | $35,658 |
| Japan | 53% | $39,313 |
| Netherlands | 53% | $57,768 |
| Belgium | 52% | $51,247 |
| Australia | 50% | $60,443 |
| Sweden | 50% | $61,029 |
| UK | 46% | $46,510 |
| United States | 46% | $70,249 |
| France | 45% | $43,659 |
| Canada | 44% | $51,988 |
| Germany | 44% | $51,203 |
Once again, populations from wealthier countries are at the lower end of the results. This could be due to societal factors (differing attitudes towards technology), economic structure, or some combination of both.
To elaborate on economic structure, let’s look at the world’s two biggest economies, the U.S. and China. The following table shows the distribution of each country’s workforce across the three major sectors.
| Economic Sector | U.S. | China |
|---|---|---|
| Agriculture | 1% | 25% |
| Industry | 20% | 28% |
| Services | 79% | 47% |
As of 2019. Source: Statista
Developing economies such as China have a larger proportion of agricultural and industrial employment, while advanced economies like the U.S. are typically more services oriented. Structural differences such as these could have an impact on how a population views AI.


Technology
Visualizing AI Patents by Country
See which countries have been granted the most AI patents each year, from 2012 to 2022.


Visualizing AI Patents by Country
This was originally posted on our Voronoi app. Download the app for free on iOS or Android and discover incredible data-driven charts from a variety of trusted sources.
This infographic shows the number of AI-related patents granted each year from 2010 to 2022 (latest data available). These figures come from the Center for Security and Emerging Technology (CSET), accessed via Stanford University’s 2024 AI Index Report.
From this data, we can see that China first overtook the U.S. in 2013. Since then, the country has seen enormous growth in the number of AI patents granted each year.
| Year | China | EU and UK | U.S. | RoW | Global Total |
|---|---|---|---|---|---|
| 2010 | 307 | 137 | 984 | 571 | 1,999 |
| 2011 | 516 | 129 | 980 | 581 | 2,206 |
| 2012 | 926 | 112 | 950 | 660 | 2,648 |
| 2013 | 1,035 | 91 | 970 | 627 | 2,723 |
| 2014 | 1,278 | 97 | 1,078 | 667 | 3,120 |
| 2015 | 1,721 | 110 | 1,135 | 539 | 3,505 |
| 2016 | 1,621 | 128 | 1,298 | 714 | 3,761 |
| 2017 | 2,428 | 144 | 1,489 | 1,075 | 5,136 |
| 2018 | 4,741 | 155 | 1,674 | 1,574 | 8,144 |
| 2019 | 9,530 | 322 | 3,211 | 2,720 | 15,783 |
| 2020 | 13,071 | 406 | 5,441 | 4,455 | 23,373 |
| 2021 | 21,907 | 623 | 8,219 | 7,519 | 38,268 |
| 2022 | 35,315 | 1,173 | 12,077 | 13,699 | 62,264 |
In 2022, China was granted more patents than every other country combined.
While this suggests that the country is very active in researching the field of artificial intelligence, it doesn’t necessarily mean that China is the farthest in terms of capability.
Key Facts About AI Patents
According to CSET, AI patents relate to mathematical relationships and algorithms, which are considered abstract ideas under patent law. They can also have different meaning, depending on where they are filed.
In the U.S., AI patenting is concentrated amongst large companies including IBM, Microsoft, and Google. On the other hand, AI patenting in China is more distributed across government organizations, universities, and tech firms (e.g. Tencent).
In terms of focus area, China’s patents are typically related to computer vision, a field of AI that enables computers and systems to interpret visual data and inputs. Meanwhile America’s efforts are more evenly distributed across research fields.
Learn More About AI From Visual Capitalist
If you want to see more data visualizations on artificial intelligence, check out this graphic that shows which job departments will be impacted by AI the most.

-

 Markets1 week ago
U.S. Debt Interest Payments Reach $1 Trillion
-

 Markets2 weeks ago
Ranked: The Most Valuable Housing Markets in America
-

 Money2 weeks ago
Which States Have the Highest Minimum Wage in America?
-

 AI2 weeks ago
Ranked: Semiconductor Companies by Industry Revenue Share
-

 Markets2 weeks ago
Ranked: The World’s Top Flight Routes, by Revenue
-

 Countries2 weeks ago
Population Projections: The World’s 6 Largest Countries in 2075
-

 Markets2 weeks ago
The Top 10 States by Real GDP Growth in 2023
-

 Money2 weeks ago
The Smallest Gender Wage Gaps in OECD Countries