Markets
Visualizing the Recent Explosion in Lumber Prices
Visualizing the Recent Explosion in Lumber Prices
Lumber is an important commodity used in construction, and refers to wood that has been processed into beams or planks.
Fluctuations in its price, which is typically quoted in USD/1,000 board feet (bd ft), can significantly affect the housing industry and in turn, influence the broader U.S. economy.
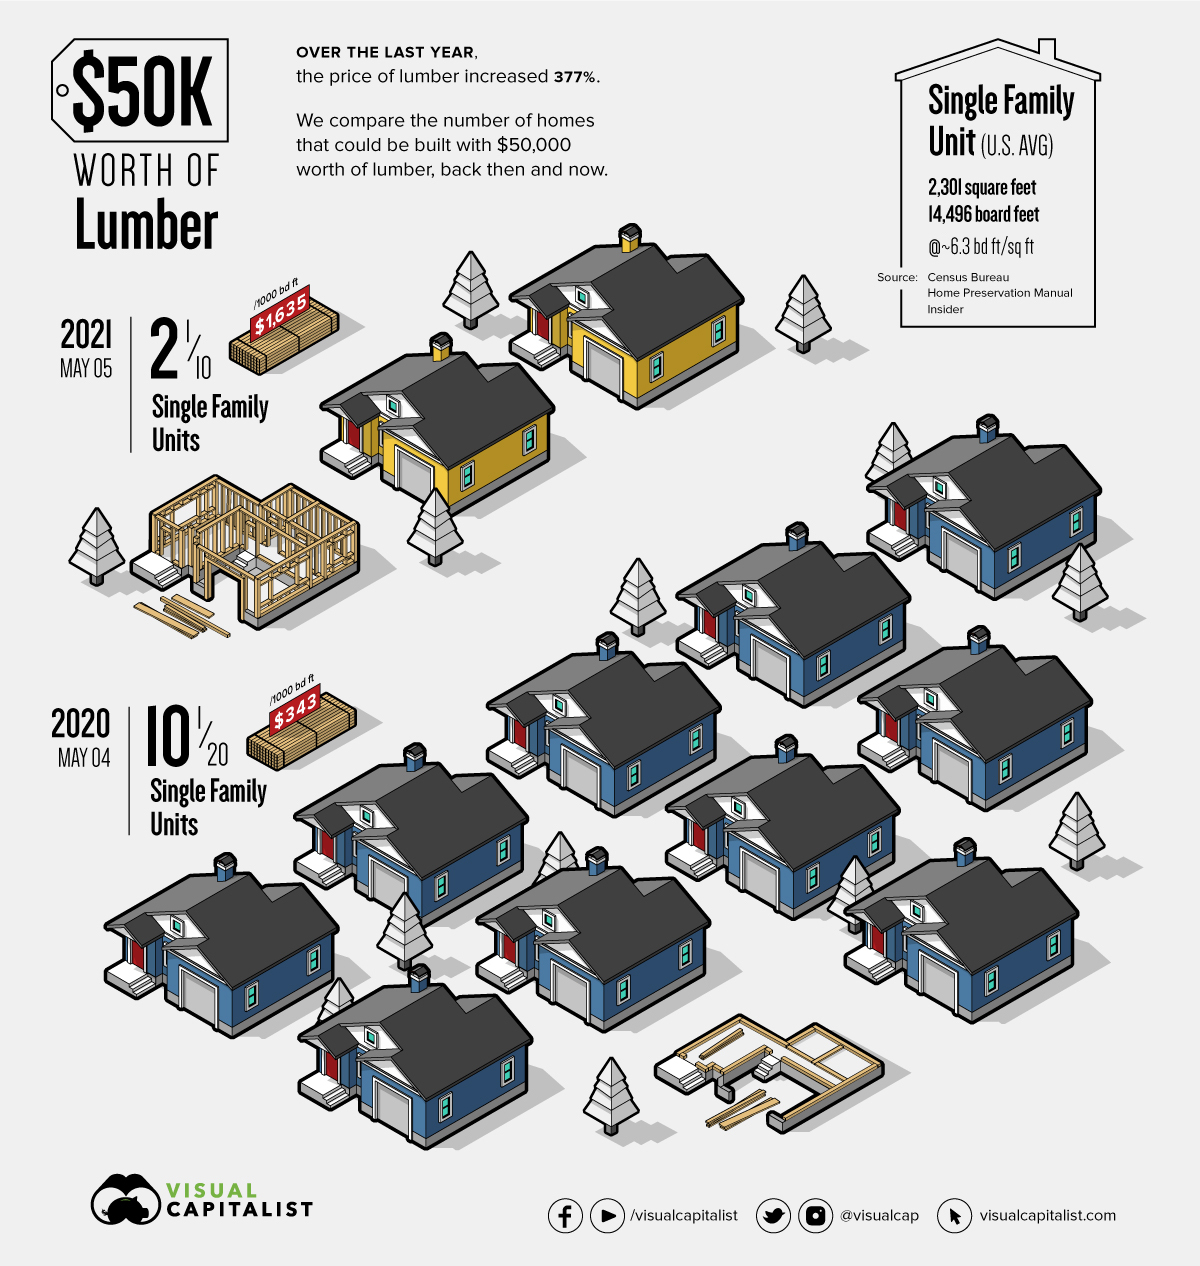
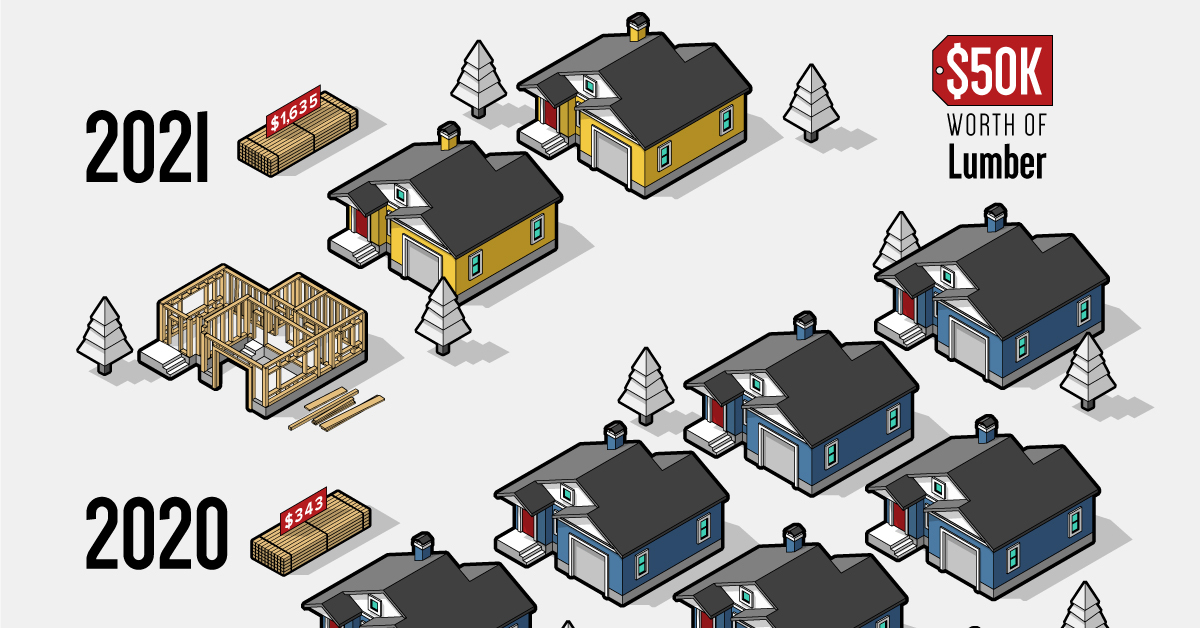
To understand the impact that lumber prices can have, we’ve visualized the number of homes that can be built with $50,000 worth of lumber, one year apart.
A Story of Supply and Demand
Before discussing the infographic above, it’s important to understand the market’s current environment.
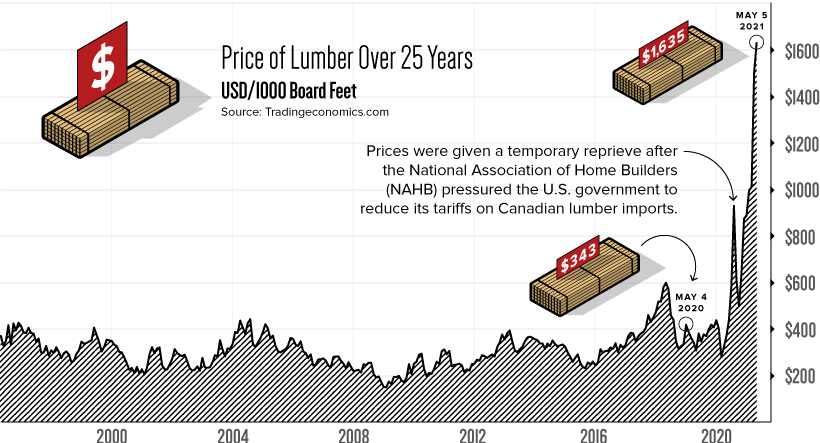
In just one year, the price of lumber has increased 377%—reaching a record high of $1,635 per 1,000 bd ft. For context, lumber has historically fluctuated between $200 to $400.
To understand what’s driving lumber prices to new heights, let’s look at two economic elements: supply and demand.
Shortened Supply
U.S. lumber supplies came under pressure in April 2017, when the Trump administration raised tariffs on Canadian lumber. Since then, lumber imports have fallen and prices have experienced significant volatility.
After a brief stint above $600 in April 2018, lumber quickly tumbled down to sub $250 levels, causing a number of sawmills to shut down. The resulting decreases in production capacity (supply) were estimated to be around 3 billion board feet.
Once COVID-19 emerged, labor shortages cut production even further, making the lumber market incredibly sensitive to demand shocks. The U.S. government has since reduced its tariffs on Canadian lumber, but these measures appear to be an example of too little, too late.
Pent-up Demand
Against expectations, COVID-19 has led to a significant boom in housing markets, greatly increasing the need for lumber.
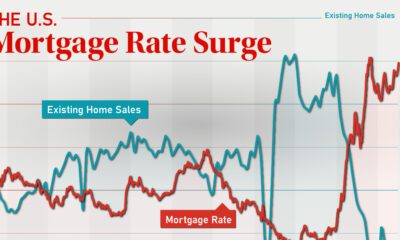
Lockdowns in early 2020 delayed many home purchases until later in the year, while increased savings rates during the pandemic meant Americans had more cash on hand. The demand for homes was further amplified by record-low mortgage rates across the country.
Existing homeowners needed lumber too, as many Americans suddenly found themselves requiring upgrades and renovations to accommodate their new stay-at-home lifestyles.
How Many Homes Can You Build With $50K of Lumber?
To see how burgeoning lumber prices are impacting the U.S. housing market, we’ve calculated the number of single family homes that could be built with $50,000 worth of lumber. First, we established the following parameters:
- Lumber requirements: 6.3 board feet (bd ft) per square foot (sq ft)
- Median single family house size: 2,301 sq ft
- Total lumber required per single family house: 14,496 bd ft
Based on these parameters, here’s how many single family homes can be built with $50,000 worth of lumber:
| Date* | Lumber Price | Total Lumber Purchased | Total Homes Built |
|---|---|---|---|
| 2021-05-05 | $1,635 per 1,000 bd ft | 30,581 bd ft | 2.11 |
| 2020-05-04 | $343 per 1,000 bd ft | 145,773 bd ft | 10.05 |
| 2015-05-01 | $234 per 1,000 bd ft | 213,675 bd ft | 14.74 |
| 2010-05-01 | $270 per 1,000 bd ft | 185,185 bd ft | 12.77 |
*Exact matching dates were not available for past years.
Source: Insider
As lumber prices continue to set record highs, the National Association of Home Builders (NAHB) has reported that the cost to build a single family home has increased by $36,000. Most of this cost can be passed down to the consumer, but extremely tight supplies mean homebuilders are unable to start more projects.
The Clock is Ticking
Despite their best efforts to increase output, it’s likely that sawmills across the U.S. will continue playing catch-up in 2021.
“There was a great fear among sawmills to prepare for a downturn. When home buying surged, they could not open up capacity quickly enough.”
– Lawrence Yun, National Association of Realtors
Analysts are now warning that lumber prices could reach a flashpoint, where affordability becomes so limited that demand suddenly falls off. This has led the NAHB to ask the Biden administration for a temporary pause on Canadian lumber tariffs, which currently sit at 9%.
U.S. tariffs on Canadian lumber were first introduced in 1982, and represent one of the longest lasting trade wars between the two nations. The U.S. is currently appealing a World Trade Organization (WTO) ruling that states its 2017 tariff hike was a breach of global trading rules.


Markets
U.S. Debt Interest Payments Reach $1 Trillion
U.S. debt interest payments have surged past the $1 trillion dollar mark, amid high interest rates and an ever-expanding debt burden.


U.S. Debt Interest Payments Reach $1 Trillion
This was originally posted on our Voronoi app. Download the app for free on iOS or Android and discover incredible data-driven charts from a variety of trusted sources.
The cost of paying for America’s national debt crossed the $1 trillion dollar mark in 2023, driven by high interest rates and a record $34 trillion mountain of debt.
Over the last decade, U.S. debt interest payments have more than doubled amid vast government spending during the pandemic crisis. As debt payments continue to soar, the Congressional Budget Office (CBO) reported that debt servicing costs surpassed defense spending for the first time ever this year.
This graphic shows the sharp rise in U.S. debt payments, based on data from the Federal Reserve.
A $1 Trillion Interest Bill, and Growing
Below, we show how U.S. debt interest payments have risen at a faster pace than at another time in modern history:
| Date | Interest Payments | U.S. National Debt |
|---|---|---|
| 2023 | $1.0T | $34.0T |
| 2022 | $830B | $31.4T |
| 2021 | $612B | $29.6T |
| 2020 | $518B | $27.7T |
| 2019 | $564B | $23.2T |
| 2018 | $571B | $22.0T |
| 2017 | $493B | $20.5T |
| 2016 | $460B | $20.0T |
| 2015 | $435B | $18.9T |
| 2014 | $442B | $18.1T |
| 2013 | $425B | $17.2T |
| 2012 | $417B | $16.4T |
| 2011 | $433B | $15.2T |
| 2010 | $400B | $14.0T |
| 2009 | $354B | $12.3T |
| 2008 | $380B | $10.7T |
| 2007 | $414B | $9.2T |
| 2006 | $387B | $8.7T |
| 2005 | $355B | $8.2T |
| 2004 | $318B | $7.6T |
| 2003 | $294B | $7.0T |
| 2002 | $298B | $6.4T |
| 2001 | $318B | $5.9T |
| 2000 | $353B | $5.7T |
| 1999 | $353B | $5.8T |
| 1998 | $360B | $5.6T |
| 1997 | $368B | $5.5T |
| 1996 | $362B | $5.3T |
| 1995 | $357B | $5.0T |
| 1994 | $334B | $4.8T |
| 1993 | $311B | $4.5T |
| 1992 | $306B | $4.2T |
| 1991 | $308B | $3.8T |
| 1990 | $298B | $3.4T |
| 1989 | $275B | $3.0T |
| 1988 | $254B | $2.7T |
| 1987 | $240B | $2.4T |
| 1986 | $225B | $2.2T |
| 1985 | $219B | $1.9T |
| 1984 | $205B | $1.7T |
| 1983 | $176B | $1.4T |
| 1982 | $157B | $1.2T |
| 1981 | $142B | $1.0T |
| 1980 | $113B | $930.2B |
| 1979 | $96B | $845.1B |
| 1978 | $84B | $789.2B |
| 1977 | $69B | $718.9B |
| 1976 | $61B | $653.5B |
| 1975 | $55B | $576.6B |
| 1974 | $50B | $492.7B |
| 1973 | $45B | $469.1B |
| 1972 | $39B | $448.5B |
| 1971 | $36B | $424.1B |
| 1970 | $35B | $389.2B |
| 1969 | $30B | $368.2B |
| 1968 | $25B | $358.0B |
| 1967 | $23B | $344.7B |
| 1966 | $21B | $329.3B |
Interest payments represent seasonally adjusted annual rate at the end of Q4.
At current rates, the U.S. national debt is growing by a remarkable $1 trillion about every 100 days, equal to roughly $3.6 trillion per year.
As the national debt has ballooned, debt payments even exceeded Medicaid outlays in 2023—one of the government’s largest expenditures. On average, the U.S. spent more than $2 billion per day on interest costs last year. Going further, the U.S. government is projected to spend a historic $12.4 trillion on interest payments over the next decade, averaging about $37,100 per American.
Exacerbating matters is that the U.S. is running a steep deficit, which stood at $1.1 trillion for the first six months of fiscal 2024. This has accelerated due to the 43% increase in debt servicing costs along with a $31 billion dollar increase in defense spending from a year earlier. Additionally, a $30 billion increase in funding for the Federal Deposit Insurance Corporation in light of the regional banking crisis last year was a major contributor to the deficit increase.
Overall, the CBO forecasts that roughly 75% of the federal deficit’s increase will be due to interest costs by 2034.

-

 Green1 week ago
Ranked: The Countries With the Most Air Pollution in 2023
-

 AI2 weeks ago
The Stock Performance of U.S. Chipmakers So Far in 2024
-

 Markets2 weeks ago
Charted: Big Four Market Share by S&P 500 Audits
-

 Real Estate2 weeks ago
Ranked: The Most Valuable Housing Markets in America
-

 Money2 weeks ago
Which States Have the Highest Minimum Wage in America?
-

 AI2 weeks ago
Ranked: Semiconductor Companies by Industry Revenue Share
-

 Travel2 weeks ago
Ranked: The World’s Top Flight Routes, by Revenue
-

 Countries2 weeks ago
Population Projections: The World’s 6 Largest Countries in 2075