Markets
Visualizing the Recent Explosion in Lumber Prices
Visualizing the Recent Explosion in Lumber Prices
Lumber is an important commodity used in construction, and refers to wood that has been processed into beams or planks.
Fluctuations in its price, which is typically quoted in USD/1,000 board feet (bd ft), can significantly affect the housing industry and in turn, influence the broader U.S. economy.
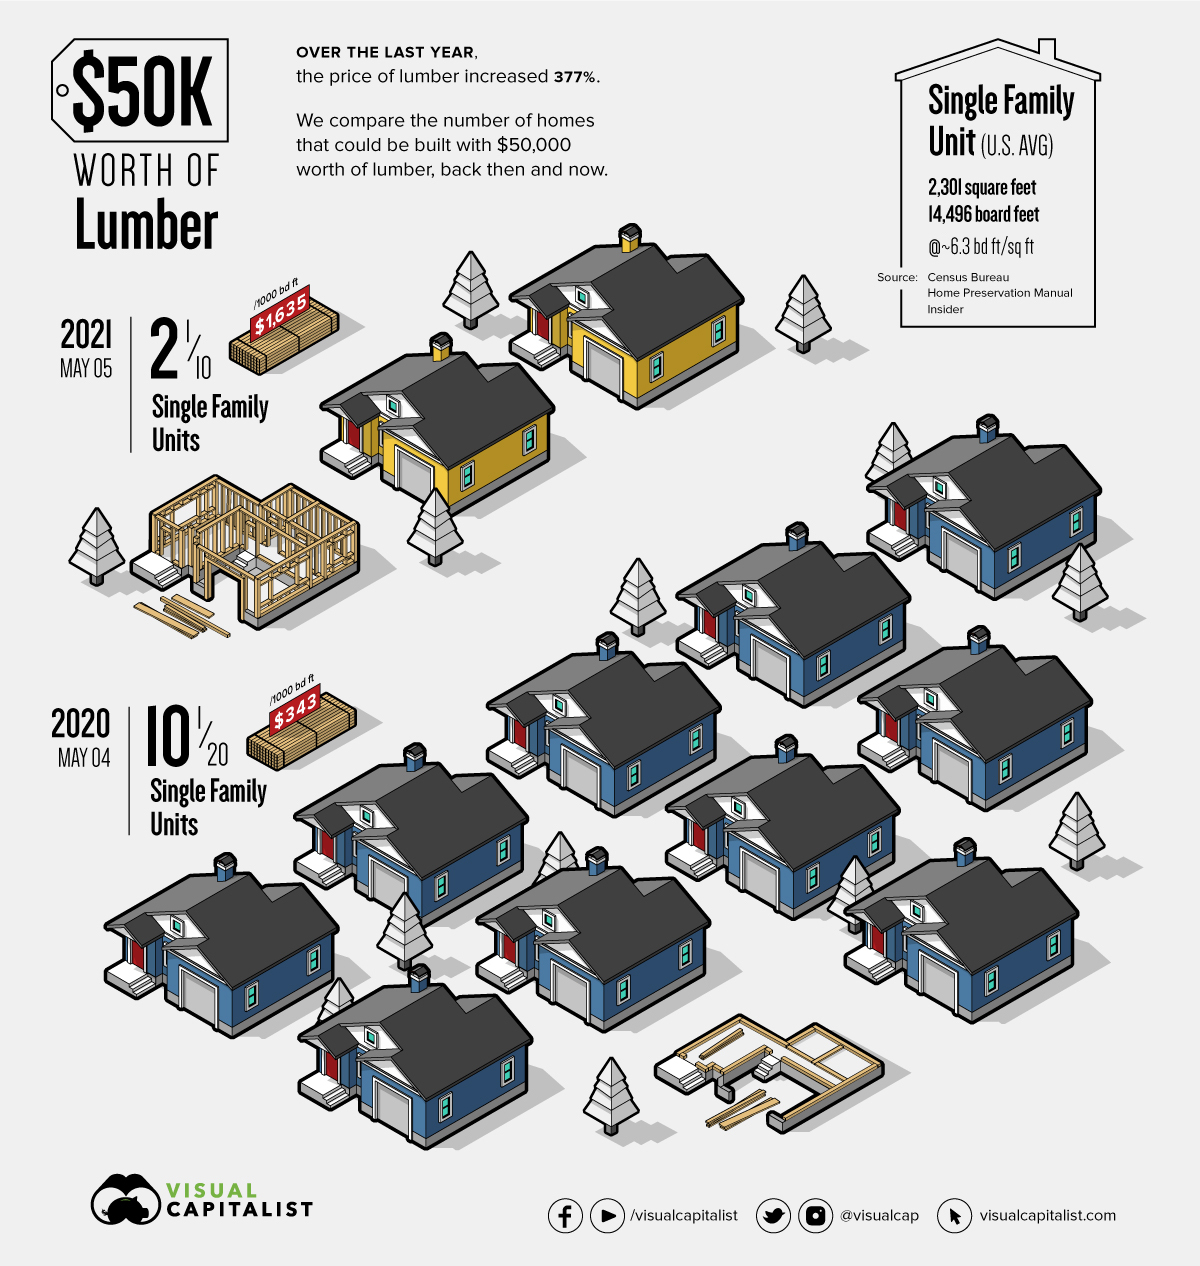
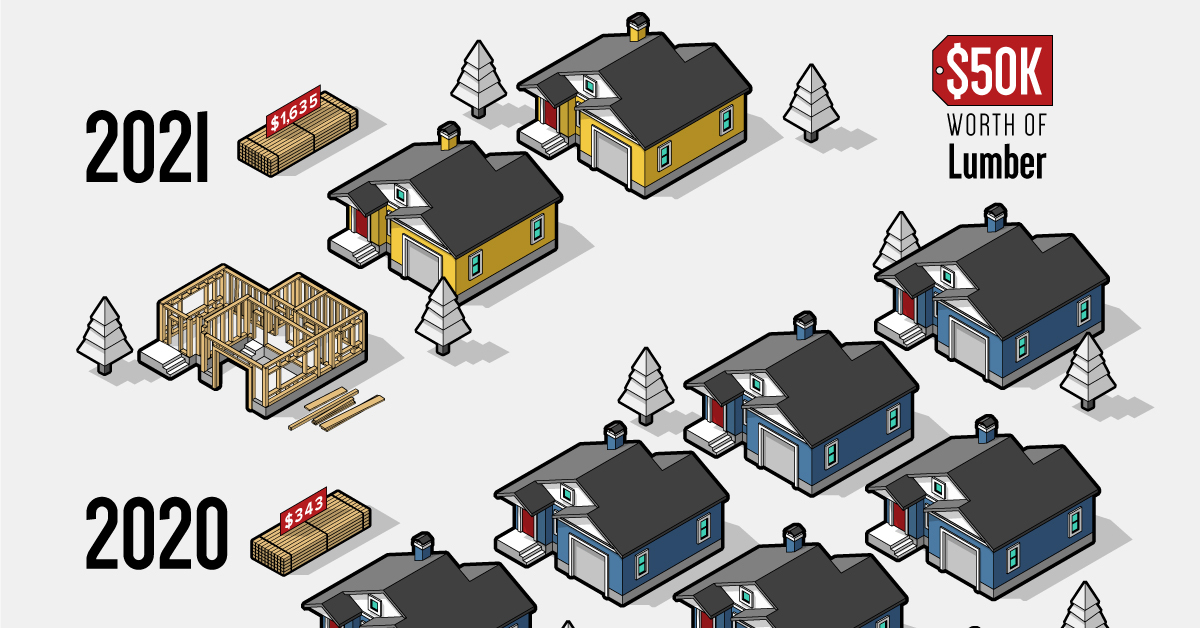
To understand the impact that lumber prices can have, we’ve visualized the number of homes that can be built with $50,000 worth of lumber, one year apart.
A Story of Supply and Demand
Before discussing the infographic above, it’s important to understand the market’s current environment.
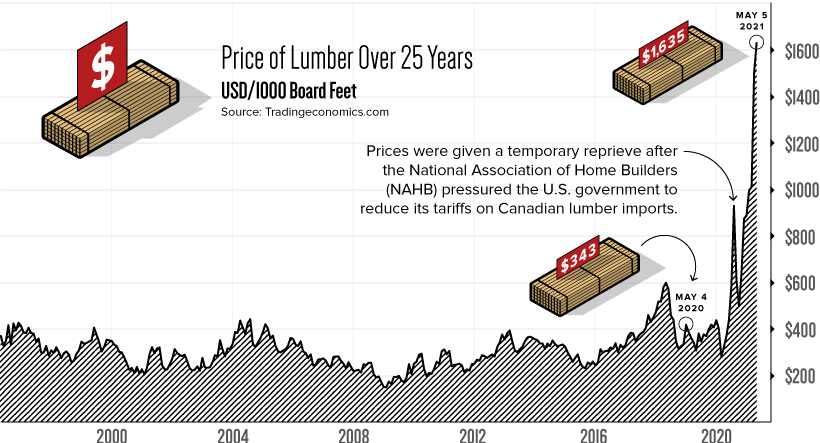
In just one year, the price of lumber has increased 377%—reaching a record high of $1,635 per 1,000 bd ft. For context, lumber has historically fluctuated between $200 to $400.
To understand what’s driving lumber prices to new heights, let’s look at two economic elements: supply and demand.
Shortened Supply
U.S. lumber supplies came under pressure in April 2017, when the Trump administration raised tariffs on Canadian lumber. Since then, lumber imports have fallen and prices have experienced significant volatility.
After a brief stint above $600 in April 2018, lumber quickly tumbled down to sub $250 levels, causing a number of sawmills to shut down. The resulting decreases in production capacity (supply) were estimated to be around 3 billion board feet.
Once COVID-19 emerged, labor shortages cut production even further, making the lumber market incredibly sensitive to demand shocks. The U.S. government has since reduced its tariffs on Canadian lumber, but these measures appear to be an example of too little, too late.
Pent-up Demand
Against expectations, COVID-19 has led to a significant boom in housing markets, greatly increasing the need for lumber.
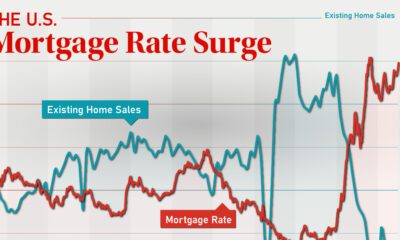
Lockdowns in early 2020 delayed many home purchases until later in the year, while increased savings rates during the pandemic meant Americans had more cash on hand. The demand for homes was further amplified by record-low mortgage rates across the country.
Existing homeowners needed lumber too, as many Americans suddenly found themselves requiring upgrades and renovations to accommodate their new stay-at-home lifestyles.
How Many Homes Can You Build With $50K of Lumber?
To see how burgeoning lumber prices are impacting the U.S. housing market, we’ve calculated the number of single family homes that could be built with $50,000 worth of lumber. First, we established the following parameters:
- Lumber requirements: 6.3 board feet (bd ft) per square foot (sq ft)
- Median single family house size: 2,301 sq ft
- Total lumber required per single family house: 14,496 bd ft
Based on these parameters, here’s how many single family homes can be built with $50,000 worth of lumber:
| Date* | Lumber Price | Total Lumber Purchased | Total Homes Built |
|---|---|---|---|
| 2021-05-05 | $1,635 per 1,000 bd ft | 30,581 bd ft | 2.11 |
| 2020-05-04 | $343 per 1,000 bd ft | 145,773 bd ft | 10.05 |
| 2015-05-01 | $234 per 1,000 bd ft | 213,675 bd ft | 14.74 |
| 2010-05-01 | $270 per 1,000 bd ft | 185,185 bd ft | 12.77 |
*Exact matching dates were not available for past years.
Source: Insider
As lumber prices continue to set record highs, the National Association of Home Builders (NAHB) has reported that the cost to build a single family home has increased by $36,000. Most of this cost can be passed down to the consumer, but extremely tight supplies mean homebuilders are unable to start more projects.
The Clock is Ticking
Despite their best efforts to increase output, it’s likely that sawmills across the U.S. will continue playing catch-up in 2021.
“There was a great fear among sawmills to prepare for a downturn. When home buying surged, they could not open up capacity quickly enough.”
– Lawrence Yun, National Association of Realtors
Analysts are now warning that lumber prices could reach a flashpoint, where affordability becomes so limited that demand suddenly falls off. This has led the NAHB to ask the Biden administration for a temporary pause on Canadian lumber tariffs, which currently sit at 9%.
U.S. tariffs on Canadian lumber were first introduced in 1982, and represent one of the longest lasting trade wars between the two nations. The U.S. is currently appealing a World Trade Organization (WTO) ruling that states its 2017 tariff hike was a breach of global trading rules.


Economy
Economic Growth Forecasts for G7 and BRICS Countries in 2024
The IMF has released its economic growth forecasts for 2024. How do the G7 and BRICS countries compare?


G7 & BRICS Real GDP Growth Forecasts for 2024
The International Monetary Fund’s (IMF) has released its real gross domestic product (GDP) growth forecasts for 2024, and while global growth is projected to stay steady at 3.2%, various major nations are seeing declining forecasts.
This chart visualizes the 2024 real GDP growth forecasts using data from the IMF’s 2024 World Economic Outlook for G7 and BRICS member nations along with Saudi Arabia, which is still considering an invitation to join the bloc.
Get the Key Insights of the IMF’s World Economic Outlook
Want a visual breakdown of the insights from the IMF’s 2024 World Economic Outlook report?
This visual is part of a special dispatch of the key takeaways exclusively for VC+ members.
Get the full dispatch of charts by signing up to VC+.
Mixed Economic Growth Prospects for Major Nations in 2024
Economic growth projections by the IMF for major nations are mixed, with the majority of G7 and BRICS countries forecasted to have slower growth in 2024 compared to 2023.
Only three BRICS-invited or member countries, Saudi Arabia, the UAE, and South Africa, have higher projected real GDP growth rates in 2024 than last year.
| Group | Country | Real GDP Growth (2023) | Real GDP Growth (2024P) |
|---|---|---|---|
| G7 | 🇺🇸 U.S. | 2.5% | 2.7% |
| G7 | 🇨🇦 Canada | 1.1% | 1.2% |
| G7 | 🇯🇵 Japan | 1.9% | 0.9% |
| G7 | 🇫🇷 France | 0.9% | 0.7% |
| G7 | 🇮🇹 Italy | 0.9% | 0.7% |
| G7 | 🇬🇧 UK | 0.1% | 0.5% |
| G7 | 🇩🇪 Germany | -0.3% | 0.2% |
| BRICS | 🇮🇳 India | 7.8% | 6.8% |
| BRICS | 🇨🇳 China | 5.2% | 4.6% |
| BRICS | 🇦🇪 UAE | 3.4% | 3.5% |
| BRICS | 🇮🇷 Iran | 4.7% | 3.3% |
| BRICS | 🇷🇺 Russia | 3.6% | 3.2% |
| BRICS | 🇪🇬 Egypt | 3.8% | 3.0% |
| BRICS-invited | 🇸🇦 Saudi Arabia | -0.8% | 2.6% |
| BRICS | 🇧🇷 Brazil | 2.9% | 2.2% |
| BRICS | 🇿🇦 South Africa | 0.6% | 0.9% |
| BRICS | 🇪🇹 Ethiopia | 7.2% | 6.2% |
| 🌍 World | 3.2% | 3.2% |
China and India are forecasted to maintain relatively high growth rates in 2024 at 4.6% and 6.8% respectively, but compared to the previous year, China is growing 0.6 percentage points slower while India is an entire percentage point slower.
On the other hand, four G7 nations are set to grow faster than last year, which includes Germany making its comeback from its negative real GDP growth of -0.3% in 2023.
Faster Growth for BRICS than G7 Nations
Despite mostly lower growth forecasts in 2024 compared to 2023, BRICS nations still have a significantly higher average growth forecast at 3.6% compared to the G7 average of 1%.
While the G7 countries’ combined GDP is around $15 trillion greater than the BRICS nations, with continued higher growth rates and the potential to add more members, BRICS looks likely to overtake the G7 in economic size within two decades.
BRICS Expansion Stutters Before October 2024 Summit
BRICS’ recent expansion has stuttered slightly, as Argentina’s newly-elected president Javier Milei declined its invitation and Saudi Arabia clarified that the country is still considering its invitation and has not joined BRICS yet.
Even with these initial growing pains, South Africa’s Foreign Minister Naledi Pandor told reporters in February that 34 different countries have submitted applications to join the growing BRICS bloc.
Any changes to the group are likely to be announced leading up to or at the 2024 BRICS summit which takes place October 22-24 in Kazan, Russia.
Get the Full Analysis of the IMF’s Outlook on VC+
This visual is part of an exclusive special dispatch for VC+ members which breaks down the key takeaways from the IMF’s 2024 World Economic Outlook.
For the full set of charts and analysis, sign up for VC+.

-

 Markets1 week ago
U.S. Debt Interest Payments Reach $1 Trillion
-

 Markets2 weeks ago
Ranked: The Most Valuable Housing Markets in America
-

 Money2 weeks ago
Which States Have the Highest Minimum Wage in America?
-

 AI2 weeks ago
Ranked: Semiconductor Companies by Industry Revenue Share
-

 Markets2 weeks ago
Ranked: The World’s Top Flight Routes, by Revenue
-

 Countries2 weeks ago
Population Projections: The World’s 6 Largest Countries in 2075
-

 Markets2 weeks ago
The Top 10 States by Real GDP Growth in 2023
-

 Money2 weeks ago
The Smallest Gender Wage Gaps in OECD Countries