Energy
Visualizing Copper’s Role in the Transition to Clean Energy
A future powered by renewables is not in the distant horizon, but rather in its early hours.
This new dawn comes from a global awareness of the environmental impacts of the current energy mix, which relies heavily on fossil fuels and their associated greenhouse gas emissions.
Technologies such as wind, solar, and batteries offer renewable and clean alternatives and are leading the way for the transition to clean energy. However, as with every energy transition, there are not only new technologies, but also new material demands.
Copper: A Key Piece of the Puzzle
This energy transition will be mineral intensive and it will require metals such as nickel, lithium, and cobalt. However, one metal stands out as being particularly important, and that is copper.
Today’s infographic comes to us from the Copper Development Association and outlines the special role of copper in renewable power generation, energy storage, and electric vehicles.

Why Copper?
The red metal has four key properties that make it ideal for the clean energy transition.
- Conductivity
- Ductility
- Efficiency
- Recyclability
It is these properties that make copper the critical material for wind and solar technology, energy storage, and electric vehicles.
It’s also why, according to ThinkCopper, the generation of electricity from solar and wind uses four to six times more copper than fossil fuel sources.
Copper in Wind
A three-megawatt wind turbine can contain up to 4.7 tons of copper with 53% of that demand coming from the cable and wiring, 24% from the turbine/power generation components, 4% from transformers, and 19% from turbine transformers.
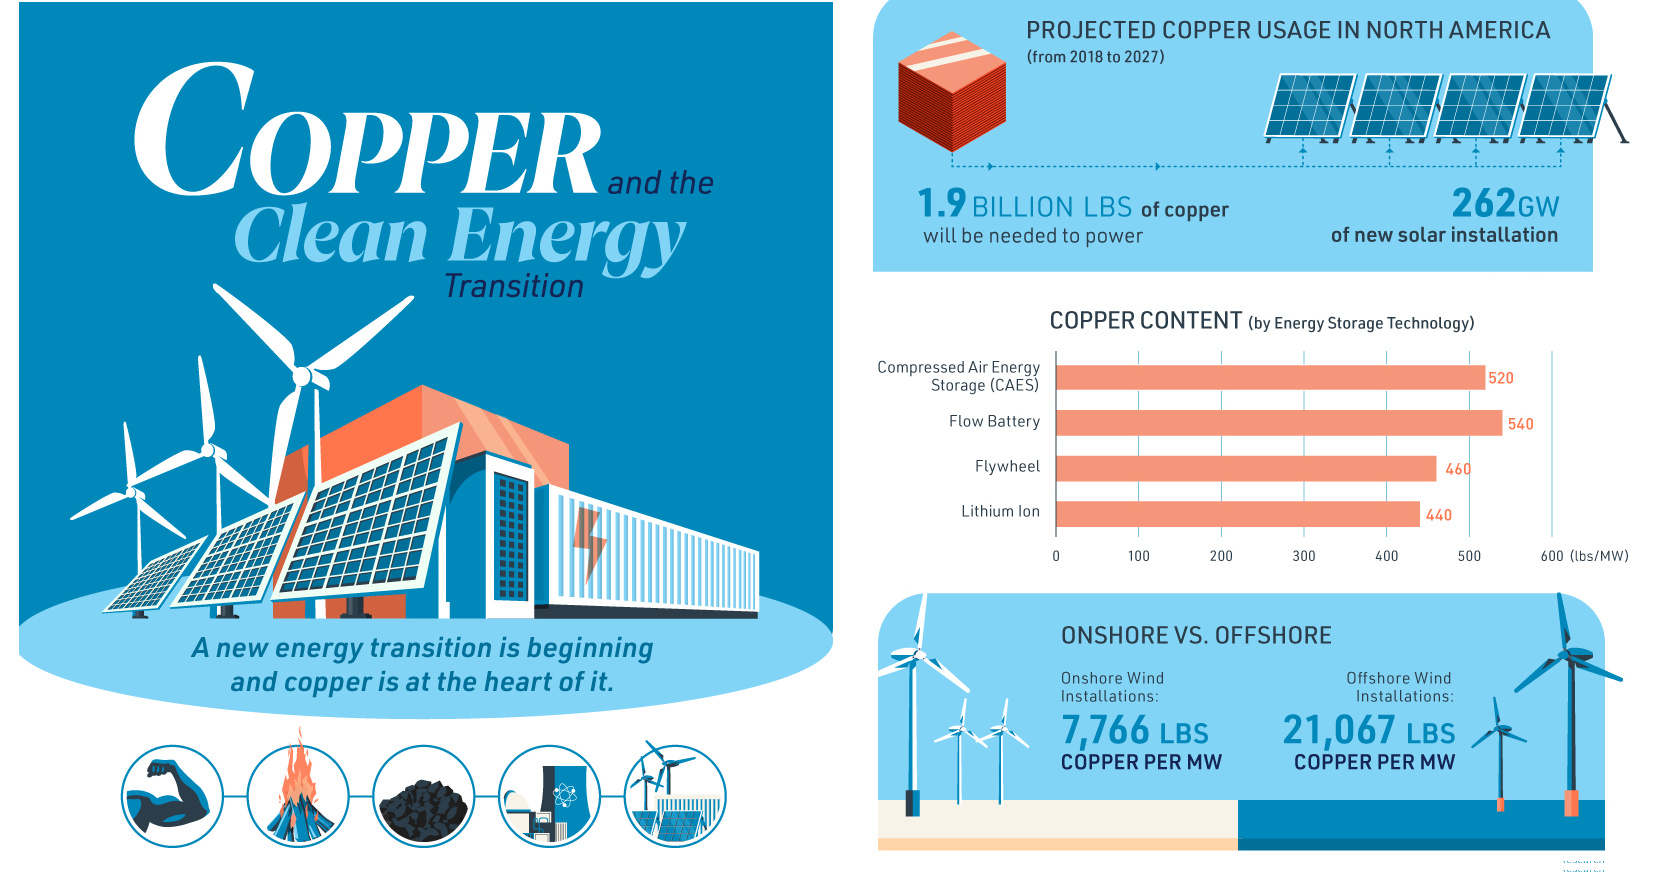
The use of copper significantly increases when going offshore. That’s because onshore wind farms use approximately 7,766 lbs of copper per MW, while an offshore wind installation uses 21,068 lbs of copper per MW.
It is the cabling of the offshore wind farms to connect them to each other and to deliver the power that accounts for the bulk of the copper usage.
Copper in Solar
Solar power systems can contain approximately 5.5 tons of copper per MW. Copper is in the heat exchangers of solar thermal units as well as in the wiring and cabling that transmits the electricity in photovoltaic solar cells.
Navigant Research projects that 262 GW of new solar installations between 2018 and 2027 in North America will require 1.9 billion lbs of copper.
Copper in Energy Storage
There are many ways to store energy, but every method uses copper. For example, a lithium ion battery contains 440 lbs of copper per MW and a flow battery 540 lbs of copper per MW.
Copper wiring and cabling connects renewable power generation with energy storage, while the copper in the switches of transformers help to deliver power at the right voltage.
Across the United States, a total of 5,752 MW of energy capacity has been announced and commissioned.
Copper in Electric Vehicles
Copper is at the heart of the electric vehicle (EV). This is because EVs rely on copper for the motor coil that drives the engine.
The more electric the car, the more copper it needs; a car powered by an internal combustion engine contains roughly 48 lbs, a hybrid needs 88 lbs, and a battery electric vehicle uses 184 lbs.
Additionally, the cabling for charging stations of electric vehicles will be another source of copper demand.
The Copper Future
Advances in technologies create new material demands.
Therefore, it shouldn’t be surprising that the transition to renewables is going to create demand for many minerals – and copper is going to be a critical mineral for the new era of energy.


Energy
The World’s Biggest Nuclear Energy Producers
China has grown its nuclear capacity over the last decade, now ranking second on the list of top nuclear energy producers.


The World’s Biggest Nuclear Energy Producers
This was originally posted on our Voronoi app. Download the app for free on Apple or Android and discover incredible data-driven charts from a variety of trusted sources.
Scientists in South Korea recently broke a record in a nuclear fusion experiment. For 48 seconds, they sustained a temperature seven times that of the sun’s core.
But generating commercially viable energy from nuclear fusion still remains more science fiction than reality. Meanwhile, its more reliable sibling, nuclear fission, has been powering our world for many decades.
In this graphic, we visualized the top producers of nuclear energy by their share of the global total, measured in terawatt hours (TWh). Data for this was sourced from the Nuclear Energy Institute, last updated in August 2022.
Which Country Generates the Most Nuclear Energy?
Nuclear energy production in the U.S. is more than twice the amount produced by China (ranked second) and France (ranked third) put together. In total, the U.S. accounts for nearly 30% of global nuclear energy output.
However, nuclear power only accounts for one-fifth of America’s electricity supply. This is in contrast to France, which generates 60% of its electricity from nuclear plants.
| Rank | Country | Nuclear Energy Produced (TWh) | % of Total |
|---|---|---|---|
| 1 | 🇺🇸 U.S. | 772 | 29% |
| 2 | 🇨🇳 China | 383 | 14% |
| 3 | 🇫🇷 France | 363 | 14% |
| 4 | 🇷🇺 Russia | 208 | 8% |
| 5 | 🇰🇷 South Korea | 150 | 6% |
| 6 | 🇨🇦 Canada | 87 | 3% |
| 7 | 🇺🇦 Ukraine | 81 | 3% |
| 8 | 🇩🇪 Germany | 65 | 2% |
| 9 | 🇯🇵 Japan | 61 | 2% |
| 10 | 🇪🇸 Spain | 54 | 2% |
| 11 | 🇸🇪 Sweden | 51 | 2% |
| 12 | 🇧🇪 Belgium | 48 | 2% |
| 13 | 🇬🇧 UK | 42 | 2% |
| 14 | 🇮🇳 India | 40 | 2% |
| 15 | 🇨🇿 Czech Republic | 29 | 1% |
| N/A | 🌐 Other | 219 | 8% |
| N/A | 🌍 Total | 2,653 | 100% |
Another highlight is how China has rapidly grown its nuclear energy capabilities in the last decade. Between 2016 and 2021, for example, it increased its share of global nuclear energy output from less than 10% to more than 14%, overtaking France for second place.
On the opposite end, the UK’s share has slipped to 2% over the same time period.
Meanwhile, Ukraine has heavily relied on nuclear energy to power its grid. In March 2022, it lost access to its key Zaporizhzhia Nuclear Power Station after Russian forces wrested control of the facility. With six 1,000 MW reactors, the plant is one of the largest in Europe. It is currently not producing any power, and has been the site of recent drone attacks.

-

 Real Estate2 weeks ago
Visualizing America’s Shortage of Affordable Homes
-

 Technology1 week ago
Ranked: Semiconductor Companies by Industry Revenue Share
-

 Money1 week ago
Which States Have the Highest Minimum Wage in America?
-

 Real Estate1 week ago
Ranked: The Most Valuable Housing Markets in America
-

 Business2 weeks ago
Charted: Big Four Market Share by S&P 500 Audits
-

 AI2 weeks ago
The Stock Performance of U.S. Chipmakers So Far in 2024
-

 Misc2 weeks ago
Almost Every EV Stock is Down After Q1 2024
-

 Money2 weeks ago
Where Does One U.S. Tax Dollar Go?