Datastream
Visualizing Congestion at America’s Busiest Port
The Briefing
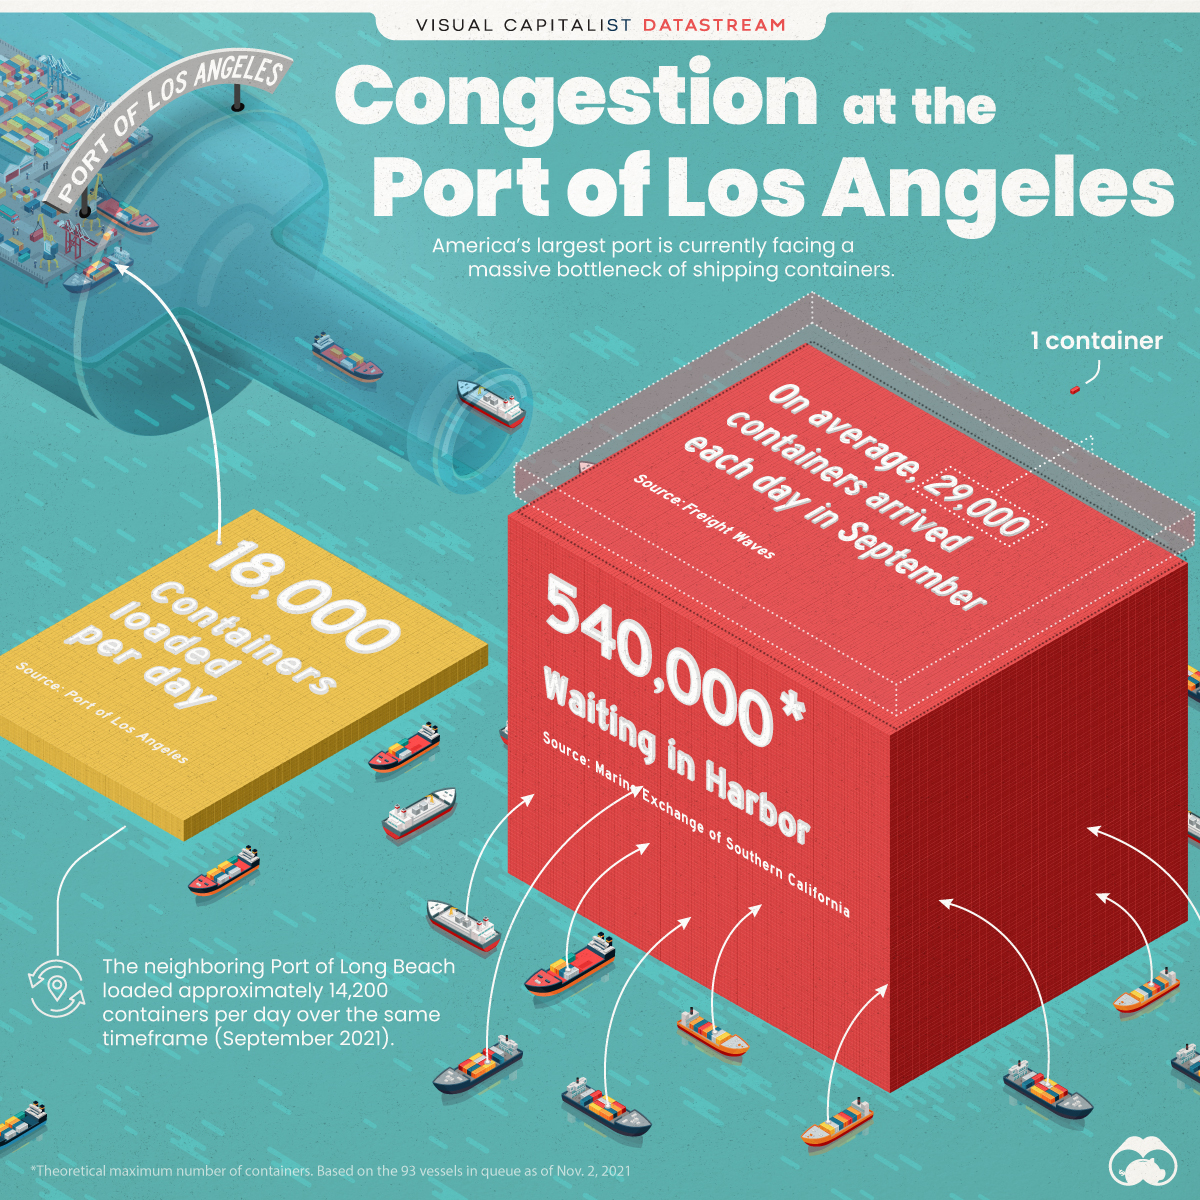
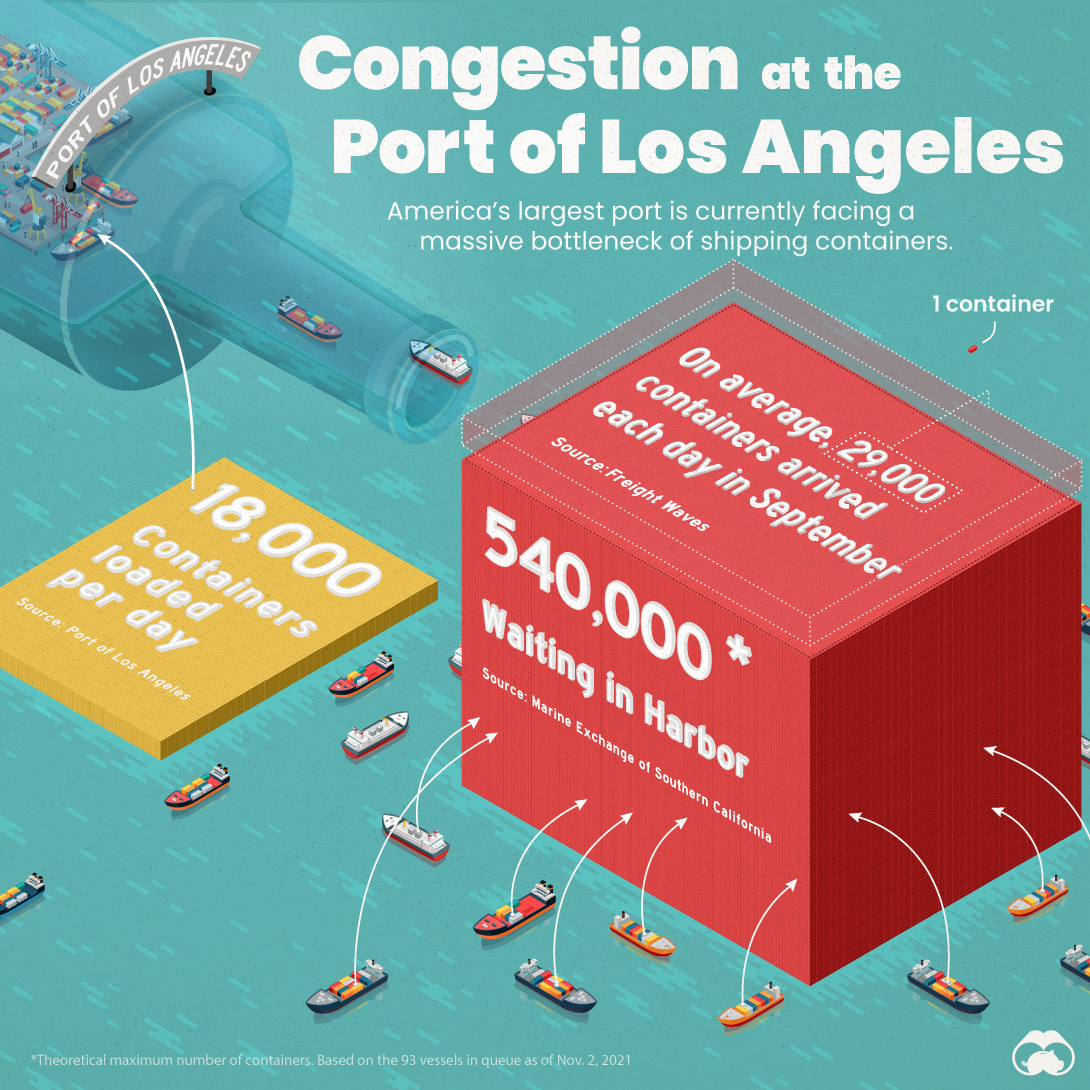
- There are an estimated 540,000 shipping containers waiting in queue at the Port of Los Angeles
- The port has been unable to keep up with increased shipments from overseas suppliers
The Busiest Port in America: Los Angeles
U.S. e-commerce grew by 32.4% in 2020—the highest annual growth rate in over two decades. Such rapid growth has resulted in many more goods being imported, leaving America’s western ports completely overwhelmed.
To help you understand the scale of this issue, we’ve visualized the number of containers waiting at sea in relation to the Port of Los Angeles’ daily processing capacity.
Stuck at Sea
As of November 2, 2021, the Port of Los Angeles reported that it had 93 vessels waiting in queue. Altogether, these ships have a maximum carrying capacity of roughly 540,000 containers (commonly measured in twenty-foot equivalent units or TEUs).
On the other side of the equation, the port processed 468,059 import containers in September (the most recent data at the time of writing). Because the port does not operate on Sundays, we can conclude that the port can load roughly 18,000 containers each day.
That capacity seems unlikely to reduce the congestion. Over a two-week timeframe in September, 407,695 containers arrived at the Port of Los Angeles, which averages to around 29,000 containers arriving each day.
| Figure | Approximate Number of Containers |
|---|---|
| Current backlog | 540,000 |
| Daily import arrivals | 29,000 |
| Daily import capacity | 18,000 |
| Daily increase in backlog | 11,000 |
What’s Being Done?
Solutions are needed to prevent the backlog from causing massive economic harm. In fact, analysts believe that up to $90 billion in trade could be delayed this holiday season.
In October, the Biden administration announced a deal to expand operations at the Port of Los Angeles, enabling it to run 24/7. The port also announced it will begin charging carriers for every container that sits idle over a grace period. While only temporary, this plan has drawn criticism for its unclear objective.
“The fee is on the ocean carrier, but the control over when the cargo is to be picked up sits with the cargo recipient. Having the ocean carrier pay more does nothing to encourage the cargo interest to pick up the cargo.” – World Shipping Council
Regardless of the outcome, more permanent solutions will be required as online shopping continues to gain popularity.
Where does this data come from?
Source: Marine Exchange of Southern California, Port of Los Angeles, Freight Waves
Data Note: These figures are based on approximations and should not be interpreted as exact.
10/11/21 Update: This infographic was updated to include the number of import containers loaded by the neighboring Port of Long Beach.


Datastream
Can You Calculate Your Daily Carbon Footprint?
Discover how the average person’s carbon footprint impacts the environment and learn how carbon credits can offset your carbon footprint.


The Briefing
- A person’s carbon footprint is substantial, with activities such as food consumption creating as much as 4,500 g of CO₂ emissions daily.
- By purchasing carbon credits from Carbon Streaming Corporation, you can offset your own emissions and fund positive climate action.
Your Everyday Carbon Footprint
While many large businesses and countries have committed to net-zero goals, it is essential to acknowledge that your everyday activities also contribute to global emissions.
In this graphic, sponsored by Carbon Streaming Corporation, we will explore how the choices we make and the products we use have a profound impact on our carbon footprint.
Carbon Emissions by Activity
Here are some of the daily activities and products of the average person and their carbon footprint, according to Clever Carbon.
| Household Activities & Products | CO2 Emissions (g) |
|---|---|
| 💡 Standard Light Bulb (100 watts, four hours) | 172 g |
| 📱 Mobile Phone Use (195 minutes per day)* | 189 g |
| 👕 Washing Machine (0.63 kWh) | 275 g |
| 🔥 Electric Oven (1.56 kWh) | 675 g |
| ♨️ Tumble Dryer (2.5 kWh) | 1,000 g |
| 🧻 Toilet Roll (2 ply) | 1,300 g |
| 🚿 Hot Shower (10 mins) | 2,000 g |
| 🚙 Daily Commute (one hour, by car) | 3,360 g |
| 🍽️ Average Daily Food Consumption (three meals of 600 calories) | 4,500 g |
| *Phone use based on yearly use of 69kg per the source, Reboxed | |
Your choice of transportation plays a crucial role in determining your carbon footprint. For instance, a 15 km daily commute to work on public transport generates an average of 1,464 g of CO₂ emissions. Compared to 3,360 g—twice the volume for a journey the same length by car.
By opting for more sustainable modes of transport, such as cycling, walking, or public transportation, you can significantly reduce your carbon footprint.
Addressing Your Carbon Footprint
One way to compensate for your emissions is by purchasing high-quality carbon credits.
Carbon credits are used to help fund projects that avoid, reduce or remove CO₂ emissions. This includes nature-based solutions such as reforestation and improved forest management, or technology-based solutions such as the production of biochar and carbon capture and storage (CCS).
While carbon credits offer a potential solution for individuals to help reduce global emissions, public awareness remains a significant challenge. A BCG-Patch survey revealed that only 34% of U.S. consumers are familiar with carbon credits, and only 3% have purchased them in the past.
About Carbon Streaming
By financing the creation or expansion of carbon projects, Carbon Streaming Corporation secures the rights to future carbon credits generated by these sustainable projects. You can then purchase these carbon credits to help fund climate solutions around the world and compensate for your own emissions.
Ready to get involved?
>> Learn more about purchasing carbon credits at Carbon Streaming

-

 Maps2 weeks ago
Mapped: Average Wages Across Europe
-

 Money1 week ago
Which States Have the Highest Minimum Wage in America?
-

 Real Estate1 week ago
Ranked: The Most Valuable Housing Markets in America
-

 Markets1 week ago
Charted: Big Four Market Share by S&P 500 Audits
-

 AI1 week ago
The Stock Performance of U.S. Chipmakers So Far in 2024
-

 Automotive1 week ago
Almost Every EV Stock is Down After Q1 2024
-

 Money2 weeks ago
Where Does One U.S. Tax Dollar Go?
-

 Green2 weeks ago
Ranked: Top Countries by Total Forest Loss Since 2001