Energy
Visualizing China’s Dominance in the Solar Panel Supply Chain
![]() Subscribe to the Elements free mailing list for more like this
Subscribe to the Elements free mailing list for more like this


China’s Dominance in the Solar Panel Supply Chain
This was originally posted on Elements. Sign up to the free mailing list to get beautiful visualizations on natural resource megatrends in your email every week.
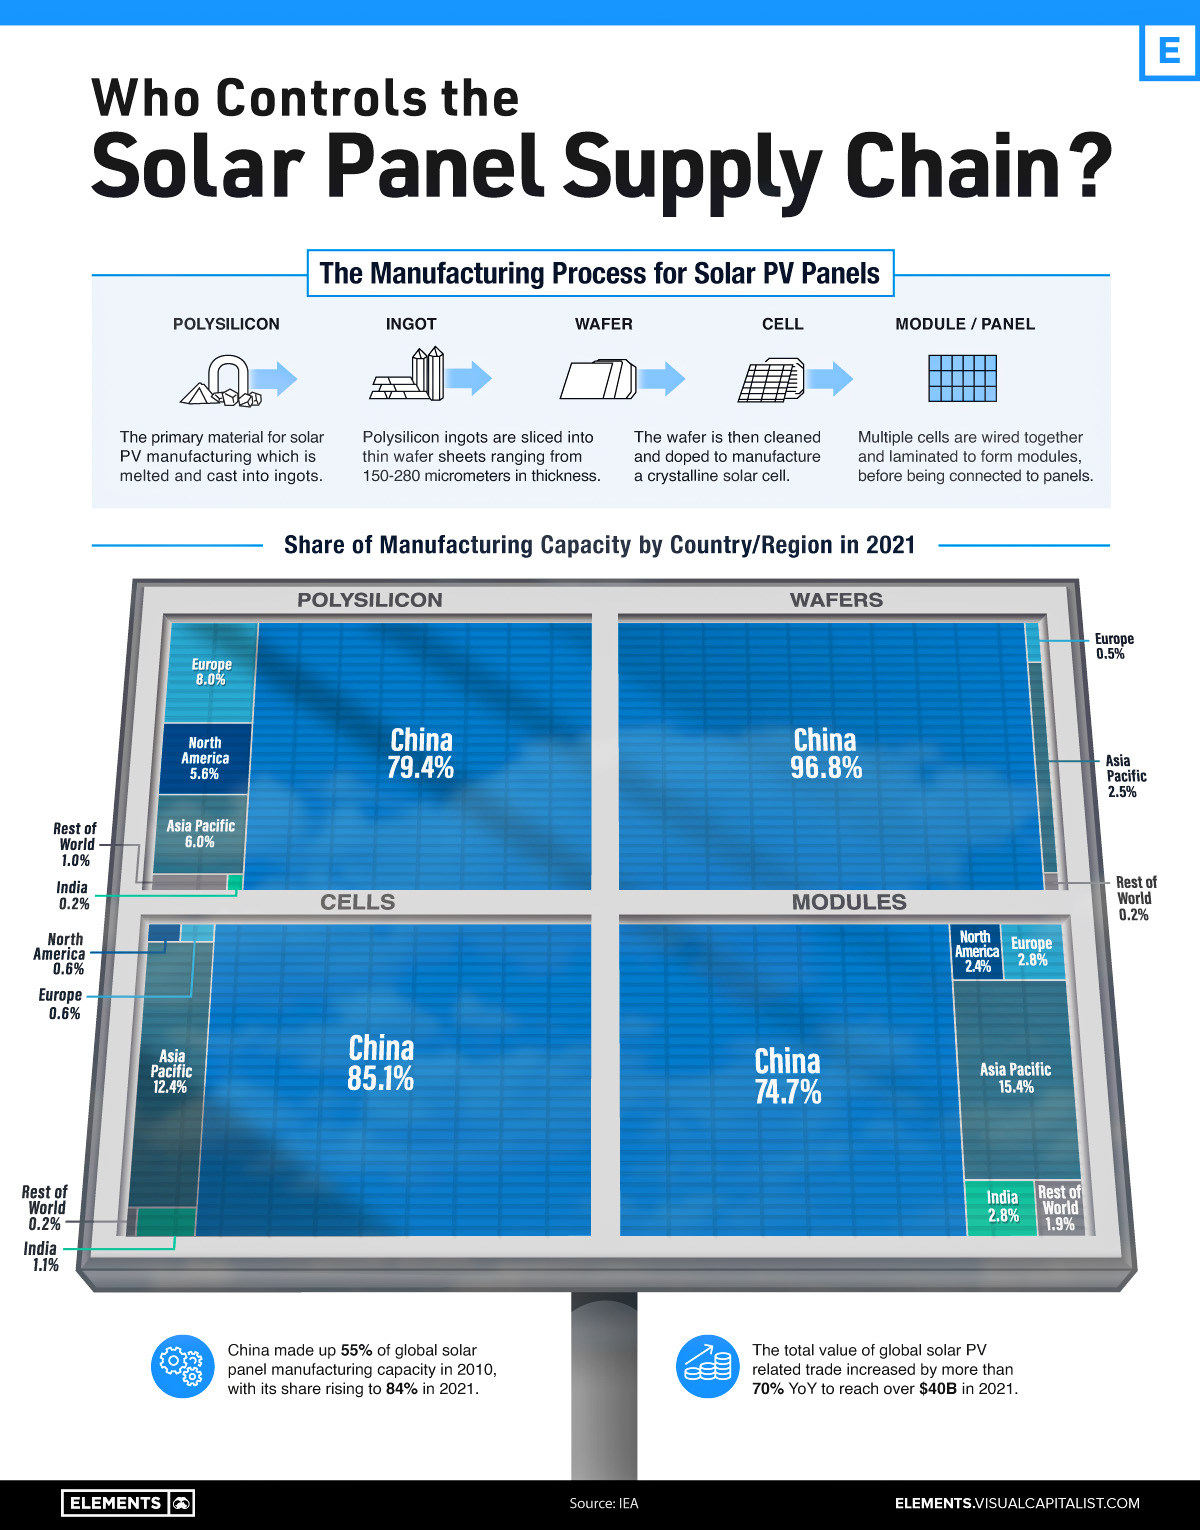
Many governments are investing in renewable energy sources like solar power, but who controls the manufacturing of solar photovoltaic (PV) panels?
As it turns out, China owns the vast majority of the world’s solar panel supply chain, controlling at least 75% of every single key stage of solar photovoltaic panel manufacturing and processing.
This visualization shows the shares held by different countries and regions of the key stages of solar panel manufacturing, using data from the International Energy Agency (IEA).
Solar Panel Manufacturing, by Country and Stage
From polysilicon production to soldering finished solar cells and modules onto panels, China has the largest share in every stage of solar panel manufacturing.
Even back in 2010, the country made the majority of the world’s solar panels, but over the past 12 years, its average share of the solar panel supply chain has gone from 55% to 84%.
China also continues to lead in terms of investment, making up almost two-thirds of global large-scale solar investment. In the first half of 2022, the country invested $41 billion, a 173% increase from the year before.
| Country/Region | Solar Panel Demand | Average Share of Solar Panel Manufacturing Capacity |
|---|---|---|
| China | 36.4% | 84.0% |
| Europe | 16.8% | 2.9% |
| North America | 17.6% | 2.8% |
| Asia-Pacific | 13.2% | 9.1% |
| India | 6.9% | 1.3% |
| Rest of the World | 9.1% | 0.8% |
Source: IEA
Note: Percentages may not add up to 100% due to rounding
After China, the next leading nation in solar panel manufacturing is India, which makes up almost 3% of solar module manufacturing and 1% of cell manufacturing. To help meet the country’s goal of 280 gigawatts (GW) of installed solar power capacity by 2030 (currently 57.9 GW), in 2022 the Indian government allocated an additional $2.6 billion to its production-linked incentive scheme that supports domestic solar PV panel manufacturing.
Alongside China and India, the Asia-Pacific region also makes up significant amounts of solar panel manufacturing, especially modules and cells at 15.4% and 12.4% respectively.
While Europe and North America make up more than one-third of the global demand for solar panels, both regions make up an average of just under 3% each across all stages of actually manufacturing solar panels.
Too Little Too Late to Diversify?
China’s dominance of solar photovoltaic panel manufacturing is not the only stranglehold the country has on renewable energy infrastructure and materials.
When it comes to wind, in 2021 China built more offshore wind turbines than all other countries combined over the past five years, and the country is also the leading producer and processor of the rare earth minerals essential for the magnets that power turbine generators.
In its full report on solar panel manufacturing, the IEA emphasized the importance of distributing global solar panel manufacturing capacity. Recent unexpected manufacturing halts in China have resulted in the price of polysilicon rising to 10-year highs, revealing the world’s dependence on China for the supply of key materials.
As the world builds out its solar and wind energy capacity, will it manage to avoid repeating Europe’s mistakes of energy import overdependence when it comes to the materials and manufacturing of renewable energy infrastructure?


Energy
The World’s Biggest Nuclear Energy Producers
China has grown its nuclear capacity over the last decade, now ranking second on the list of top nuclear energy producers.


The World’s Biggest Nuclear Energy Producers
This was originally posted on our Voronoi app. Download the app for free on Apple or Android and discover incredible data-driven charts from a variety of trusted sources.
Scientists in South Korea recently broke a record in a nuclear fusion experiment. For 48 seconds, they sustained a temperature seven times that of the sun’s core.
But generating commercially viable energy from nuclear fusion still remains more science fiction than reality. Meanwhile, its more reliable sibling, nuclear fission, has been powering our world for many decades.
In this graphic, we visualized the top producers of nuclear energy by their share of the global total, measured in terawatt hours (TWh). Data for this was sourced from the Nuclear Energy Institute, last updated in August 2022.
Which Country Generates the Most Nuclear Energy?
Nuclear energy production in the U.S. is more than twice the amount produced by China (ranked second) and France (ranked third) put together. In total, the U.S. accounts for nearly 30% of global nuclear energy output.
However, nuclear power only accounts for one-fifth of America’s electricity supply. This is in contrast to France, which generates 60% of its electricity from nuclear plants.
| Rank | Country | Nuclear Energy Produced (TWh) | % of Total |
|---|---|---|---|
| 1 | 🇺🇸 U.S. | 772 | 29% |
| 2 | 🇨🇳 China | 383 | 14% |
| 3 | 🇫🇷 France | 363 | 14% |
| 4 | 🇷🇺 Russia | 208 | 8% |
| 5 | 🇰🇷 South Korea | 150 | 6% |
| 6 | 🇨🇦 Canada | 87 | 3% |
| 7 | 🇺🇦 Ukraine | 81 | 3% |
| 8 | 🇩🇪 Germany | 65 | 2% |
| 9 | 🇯🇵 Japan | 61 | 2% |
| 10 | 🇪🇸 Spain | 54 | 2% |
| 11 | 🇸🇪 Sweden | 51 | 2% |
| 12 | 🇧🇪 Belgium | 48 | 2% |
| 13 | 🇬🇧 UK | 42 | 2% |
| 14 | 🇮🇳 India | 40 | 2% |
| 15 | 🇨🇿 Czech Republic | 29 | 1% |
| N/A | 🌐 Other | 219 | 8% |
| N/A | 🌍 Total | 2,653 | 100% |
Another highlight is how China has rapidly grown its nuclear energy capabilities in the last decade. Between 2016 and 2021, for example, it increased its share of global nuclear energy output from less than 10% to more than 14%, overtaking France for second place.
On the opposite end, the UK’s share has slipped to 2% over the same time period.
Meanwhile, Ukraine has heavily relied on nuclear energy to power its grid. In March 2022, it lost access to its key Zaporizhzhia Nuclear Power Station after Russian forces wrested control of the facility. With six 1,000 MW reactors, the plant is one of the largest in Europe. It is currently not producing any power, and has been the site of recent drone attacks.

-

 Maps2 weeks ago
Mapped: Average Wages Across Europe
-

 Money1 week ago
Which States Have the Highest Minimum Wage in America?
-

 Real Estate1 week ago
Ranked: The Most Valuable Housing Markets in America
-

 Markets1 week ago
Charted: Big Four Market Share by S&P 500 Audits
-

 AI1 week ago
The Stock Performance of U.S. Chipmakers So Far in 2024
-

 Automotive2 weeks ago
Almost Every EV Stock is Down After Q1 2024
-

 Money2 weeks ago
Where Does One U.S. Tax Dollar Go?
-

 Green2 weeks ago
Ranked: Top Countries by Total Forest Loss Since 2001