Economy
Visualizing China’s $18 Trillion Economy in One Chart


Visualizing China’s $18 Trillion Economy in 2021
China is the world’s second largest economy after the U.S., and it is expected to eventually climb into the number one position in the coming decades.
While China’s economy has had a much rockier start this year due to zero-tolerance COVID-19 lockdowns and supply chain issues, our visualization covers a full year of data for 2021—a year in which most economies recovered after the initial chaos of the pandemic.
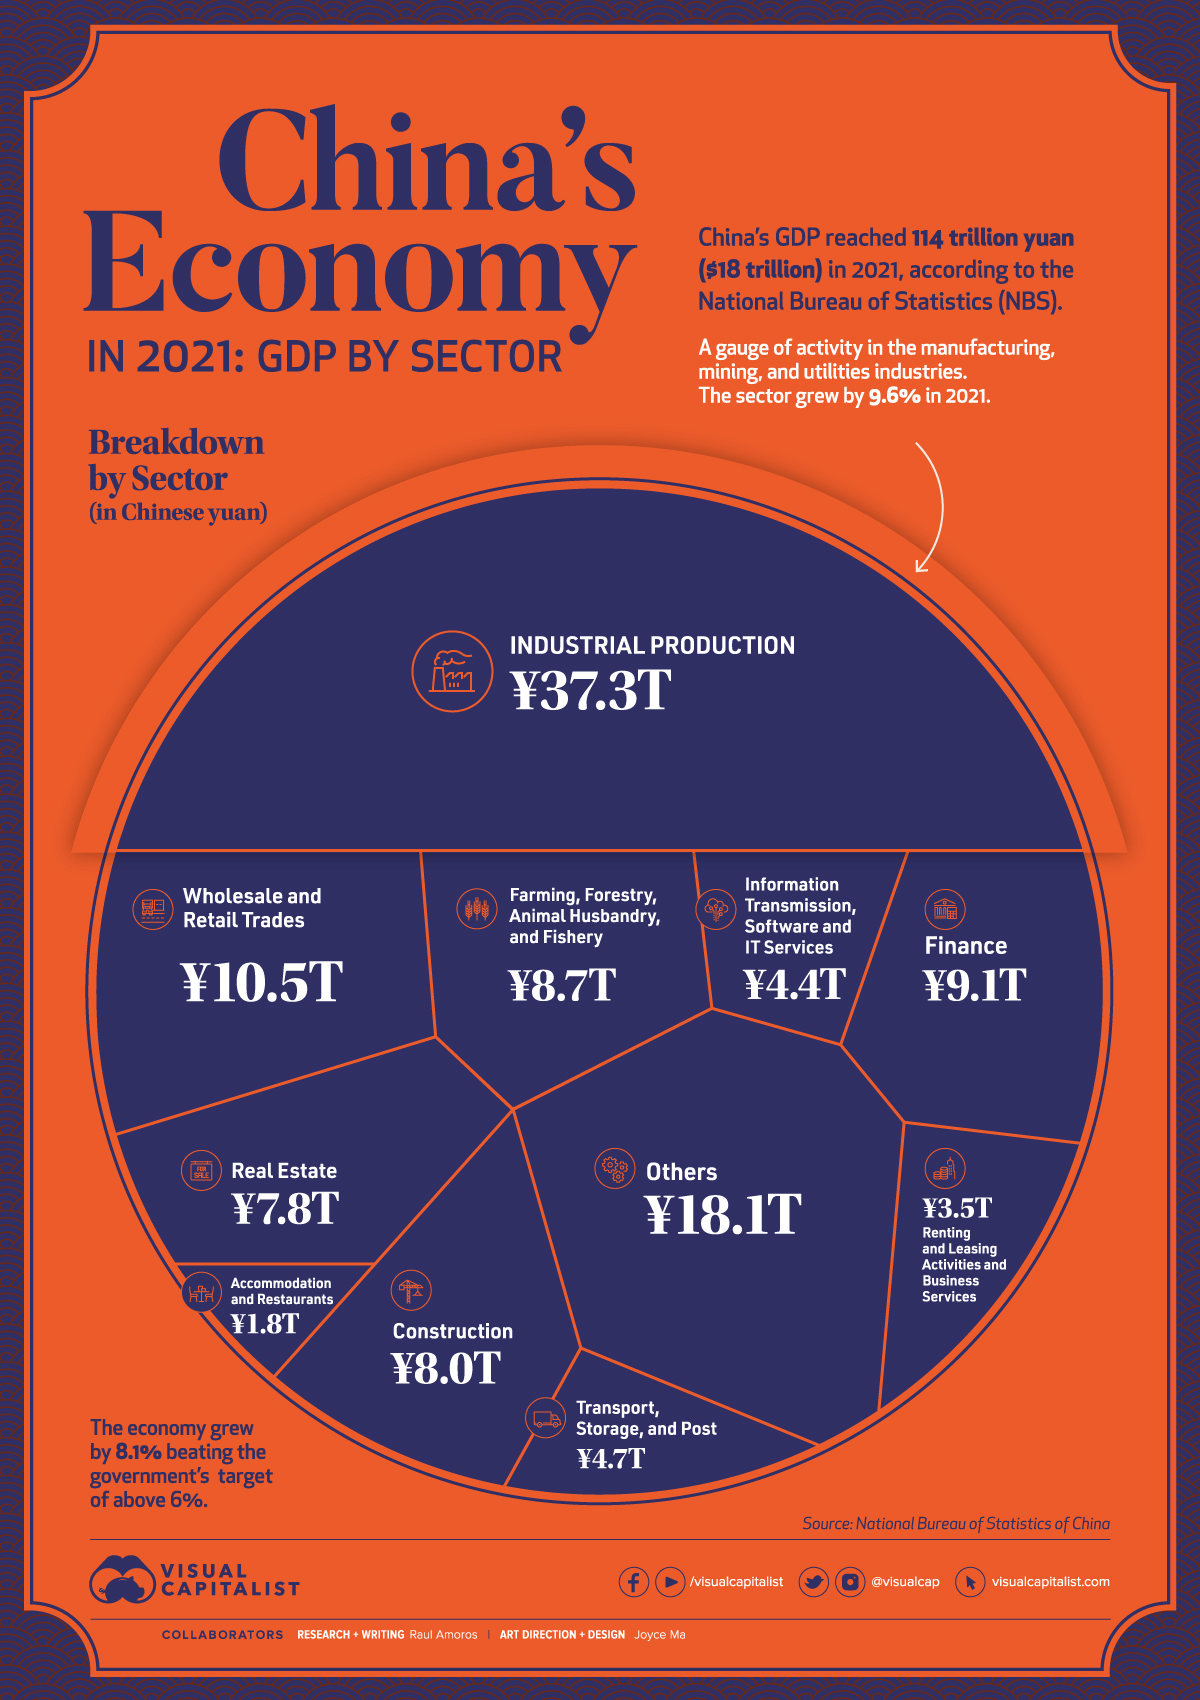
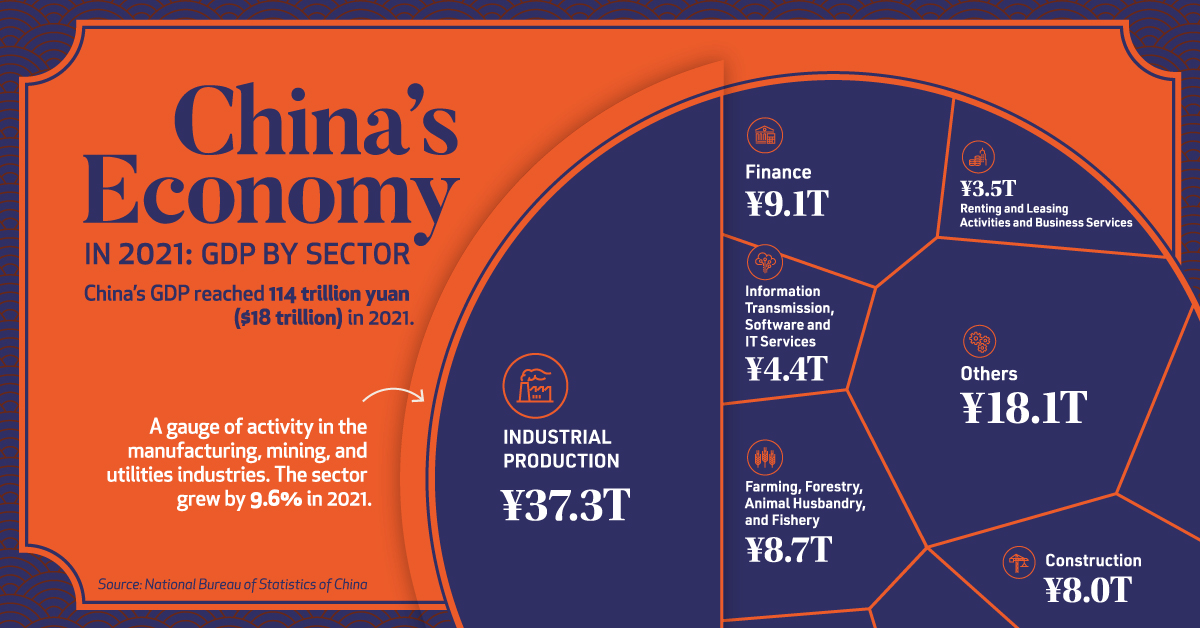
In 2021, China’s Gross Domestic Product (GDP) reached ¥114 trillion ($18 trillion in USD), according to the National Bureau of Statistics. The country’s economy outperformed government targets of 6% growth, with the overall economy growing by 8.1%.
Let’s take a look at what powers China’s modern economy.
Breaking Down China’s Economy By Sector
| Sector | 2021 Total GDP (Yuan) | 2021 Total GDP (USD) | % Share |
|---|---|---|---|
| Industry | ¥37.3T | $5.9T | 32.6% |
| Wholesale and Retail Trades | ¥10.5T | $1.7T | 9.2% |
| Finance | ¥9.1T | $1.4T | 8.0% |
| Farming, Forestry, Animal Husbandry, and Fishery | ¥8.7T | $1.4T | 7.6% |
| Construction | ¥8.0T | $1.3T | 7.0% |
| Real Estate | ¥7.8T | $1.2T | 6.9% |
| Transport, Storage, and Post | ¥4.7T | $0.7T | 4.1% |
| Information Transmission, Software and IT Services | ¥4.4T | $0.7T | 3.9% |
| Renting & Leasing Activities and Business Services | ¥3.5T | $0.6T | 3.1% |
| Accommodation and Restaurants | ¥1.8T | $0.3T | 1.6% |
| Others | ¥18.1T | $2.8T | 15.9% |
| Total | ¥114T | ¥18T | 100.0% |
Industrial production—activity in the manufacturing, mining, and utilities sectors—is by far the leading driver of China’s economy. In 2021, the sector generated ¥37.3 trillion, or one-third of the country’s total economic activity.
Despite a slowdown in December, wholesale and retail trades also performed strongly in 2021. As the main gauge of consumption, it was affected by lockdown measures and the spread of the COVID-19 Omicron variant towards the end of the year, but still rose by double digits, reaching a total of ¥10.5 trillion*.
“Other services”, which includes everything from scientific research and development to education and social services, generated 16% of China’s total economy in 2021, or ¥18.1 trillion.
*Editor’s note: At time of publishing, China’s government seems to have since adjusted this number to ¥11.0 trillion, which is not consistent with the original data set provided, but worth noting.
Where is China’s GDP Headed?
China’s economy recovered noticeably faster than most major economies last year, and as the overall trend below shows, the country has grown consistently in the years prior.
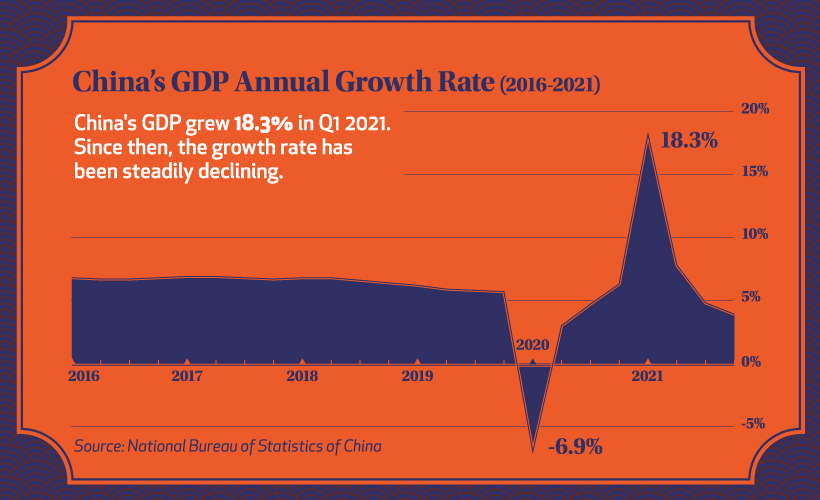
Before the pandemic hit, China’s quarterly GDP growth had been quite stable at just above 5%.
After the initial onset of COVID-19, the country’s economy faltered, mirroring economies around the globe. But after a strong recovery into 2021, resurging cases caused a new series of crackdowns on the private sector, slowing down GDP growth considerably.
With the slowdown continuing into early 2022, China’s economic horizon still looks uncertain. The lockdown in Shanghai is expected to continue all the way to June 1st, and over recent months there have been hundreds of ships stuck outside of Shanghai’s port as a part of ongoing supply chain challenges.
China’s Zero-COVID Policy: Good or Bad for the Economy?
While every country reacted to the COVID-19 pandemic differently, China adopted a zero-COVID policy of strict lockdowns to control cases and outbreaks.
For most of 2021, the policy didn’t deter GDP growth. Despite some major cities fully or partially locked down to control regional outbreaks, the country’s economy still paced well ahead of many other major economies.
But the policy faced a challenge with the emergence of the Omicron variant. Despite lockdowns and an 88% vaccination rate nationally, seven out of China’s 31 provinces and all of the biggest cities have reported Omicron cases.
And China’s zero-COVID policy has not affected all sectors equally. Industrial production rose by more than 10% in the first 11 months of 2021, despite city lockdowns around the country. That’s because many factories in China are in suburban industrial parks outside the cities, and employees often live nearby.
But many sectors like hotels and restaurants have been more severely affected by city lockdowns. Many global economies are starting to transition to living with COVID, with China remaining as one of the last countries to follow a zero-COVID policy. Does that ensure the country’s economy will continue to slow in 2022, or will China manage to recover and maintain one of the world’s fastest growing economies?


Copper
Brass Rods: The Secure Choice
This graphic shows why brass rods are the secure choice for precision-machined and forged parts.


Brass Rods: The Secure Choice
The unique combination of machinability and recyclability makes brass rods the secure choice for manufacturers seeking future-proof raw material solutions.
This infographic, from the Copper Development Association, shows three ways brass rods give manufacturers greater control and a license to grow in the competitive market for precision-machined and forged products.
Future-Proof Investments in New Machine Tools
A material’s machinability directly impacts machine throughput, which typically has the largest impact on machine shop profitability.
The high-speed machining capabilities of brass rods maximize machine tool performance, allowing manufacturers to run the material faster and longer without sacrificing tool life, chip formation, or surface quality.
The high machining efficiency of brass leads to reduced per-part costs, quicker return on investment (ROI) for new machine tools, and expanded production capacity for new projects.
Supply Security Through Closed Loop Recycling
Brass, like its parent element copper, can be infinitely recycled.
In 2022, brass- and wire-rod mills accounted for the majority of the 830,000 tonnes of copper recycled from scrap in the United States.
Given that scrap ratios for machined parts typically range from 60-70% by weight, producing mills benefit from a secure and steady supply of clean scrap returned directly from customers, which is recycled to create new brass rods.
The high residual value of brass scrap creates a strong recycling incentive. Scrap buy back programs give manufacturers greater control over raw material net costs as scrap value is often factored into supplier purchase agreements.
Next Generation Alloys for a Lead-Free Future
Increasingly stringent global regulations continue to pressure manufacturers to minimize the use of materials containing trace amounts of lead and other harmful impurities.
The latest generation of brass-rod alloys is engineered to meet the most demanding criteria for lead leaching in drinking water and other sensitive applications.
Seven brass-rod alloys passed rigorous testing to become the only ‘Acceptable Materials’ against lower lead leaching criteria recently adopted in the national U.S. drinking water quality standard, NSF 61.
Learn more about the advantages of brass rods solutions.

-

 Base Metals1 year ago
Ranked: The World’s Largest Copper Producers
Many new technologies critical to the energy transition rely on copper. Here are the world’s largest copper producers.
-

 Silver2 years ago
Mapped: Solar Power by Country in 2021
In 2020, solar power saw its largest-ever annual capacity expansion at 127 gigawatts. Here’s a snapshot of solar power capacity by country.
-

 Batteries5 years ago
Visualizing Copper’s Role in the Transition to Clean Energy
A clean energy transition is underway as wind, solar, and batteries take center stage. Here’s how copper plays the critical role in these technologies.
-

 Science5 years ago
Everything You Need to Know on VMS Deposits
Deep below the ocean’s waves, VMS deposits spew out massive amounts of minerals like copper, zinc, and gold, making them a key source of the metals…
-
 Copper5 years ago
How Much Copper is in an Electric Vehicle?
Have you ever wondered how much copper is in an electric vehicle? This infographic shows the metal’s properties as well as the quantity of copper used.
-
 Copper6 years ago
Copper: Driving the Green Energy Revolution
Renewable energy is set to fuel a new era of copper demand – here’s how much copper is used in green applications from EVs to photovoltaics.


-

 Real Estate2 weeks ago
Visualizing America’s Shortage of Affordable Homes
-

 Technology1 week ago
Ranked: Semiconductor Companies by Industry Revenue Share
-

 Money1 week ago
Which States Have the Highest Minimum Wage in America?
-

 Real Estate1 week ago
Ranked: The Most Valuable Housing Markets in America
-

 Business2 weeks ago
Charted: Big Four Market Share by S&P 500 Audits
-

 AI2 weeks ago
The Stock Performance of U.S. Chipmakers So Far in 2024
-

 Misc2 weeks ago
Almost Every EV Stock is Down After Q1 2024
-

 Money2 weeks ago
Where Does One U.S. Tax Dollar Go?