Economy
Visualizing China’s $18 Trillion Economy in One Chart


Visualizing China’s $18 Trillion Economy in 2021
China is the world’s second largest economy after the U.S., and it is expected to eventually climb into the number one position in the coming decades.
While China’s economy has had a much rockier start this year due to zero-tolerance COVID-19 lockdowns and supply chain issues, our visualization covers a full year of data for 2021—a year in which most economies recovered after the initial chaos of the pandemic.
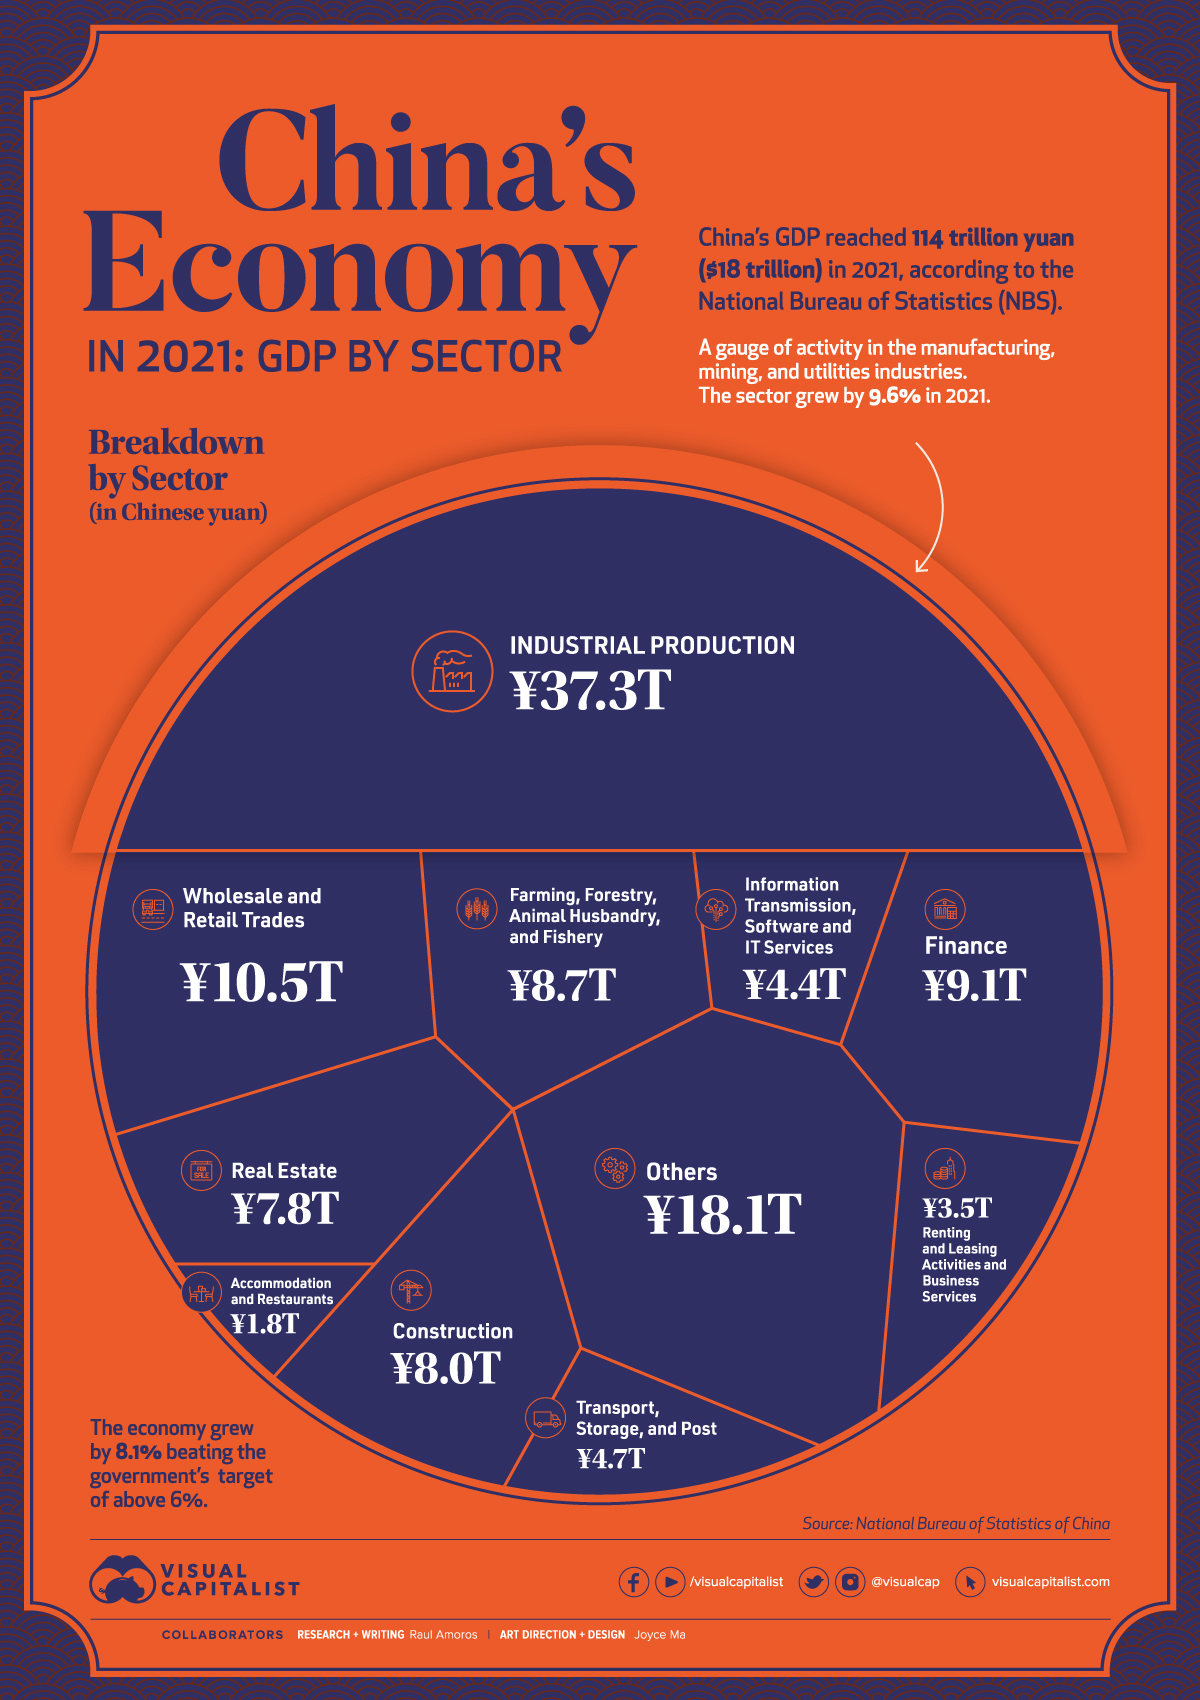
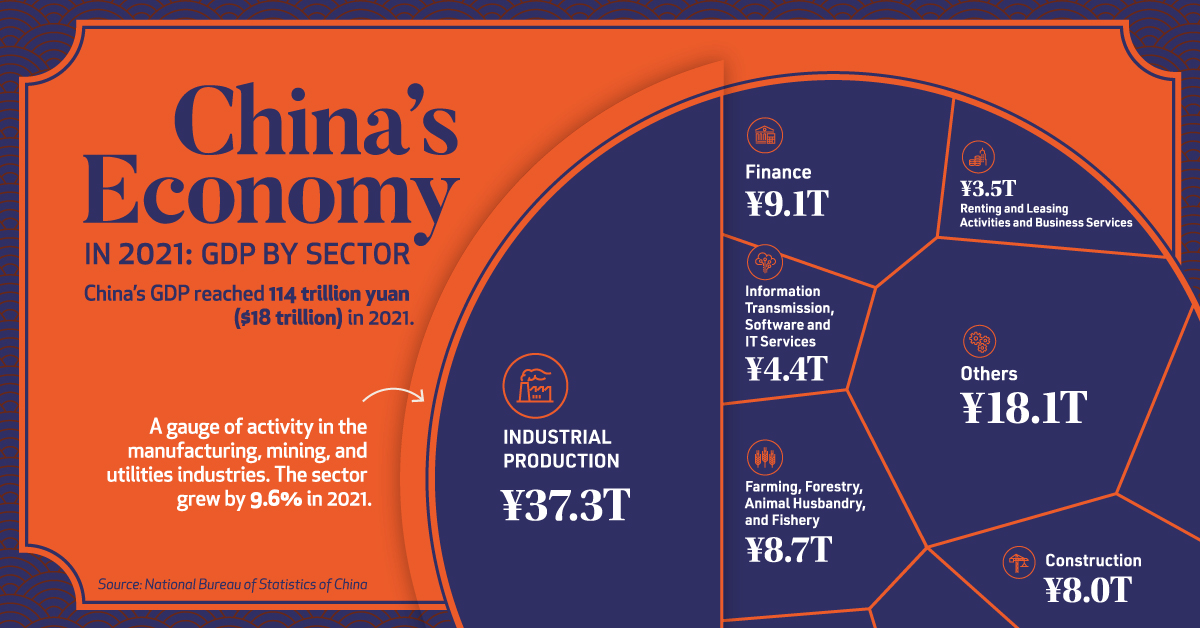
In 2021, China’s Gross Domestic Product (GDP) reached ¥114 trillion ($18 trillion in USD), according to the National Bureau of Statistics. The country’s economy outperformed government targets of 6% growth, with the overall economy growing by 8.1%.
Let’s take a look at what powers China’s modern economy.
Breaking Down China’s Economy By Sector
| Sector | 2021 Total GDP (Yuan) | 2021 Total GDP (USD) | % Share |
|---|---|---|---|
| Industry | ¥37.3T | $5.9T | 32.6% |
| Wholesale and Retail Trades | ¥10.5T | $1.7T | 9.2% |
| Finance | ¥9.1T | $1.4T | 8.0% |
| Farming, Forestry, Animal Husbandry, and Fishery | ¥8.7T | $1.4T | 7.6% |
| Construction | ¥8.0T | $1.3T | 7.0% |
| Real Estate | ¥7.8T | $1.2T | 6.9% |
| Transport, Storage, and Post | ¥4.7T | $0.7T | 4.1% |
| Information Transmission, Software and IT Services | ¥4.4T | $0.7T | 3.9% |
| Renting & Leasing Activities and Business Services | ¥3.5T | $0.6T | 3.1% |
| Accommodation and Restaurants | ¥1.8T | $0.3T | 1.6% |
| Others | ¥18.1T | $2.8T | 15.9% |
| Total | ¥114T | ¥18T | 100.0% |
Industrial production—activity in the manufacturing, mining, and utilities sectors—is by far the leading driver of China’s economy. In 2021, the sector generated ¥37.3 trillion, or one-third of the country’s total economic activity.
Despite a slowdown in December, wholesale and retail trades also performed strongly in 2021. As the main gauge of consumption, it was affected by lockdown measures and the spread of the COVID-19 Omicron variant towards the end of the year, but still rose by double digits, reaching a total of ¥10.5 trillion*.
“Other services”, which includes everything from scientific research and development to education and social services, generated 16% of China’s total economy in 2021, or ¥18.1 trillion.
*Editor’s note: At time of publishing, China’s government seems to have since adjusted this number to ¥11.0 trillion, which is not consistent with the original data set provided, but worth noting.
Where is China’s GDP Headed?
China’s economy recovered noticeably faster than most major economies last year, and as the overall trend below shows, the country has grown consistently in the years prior.
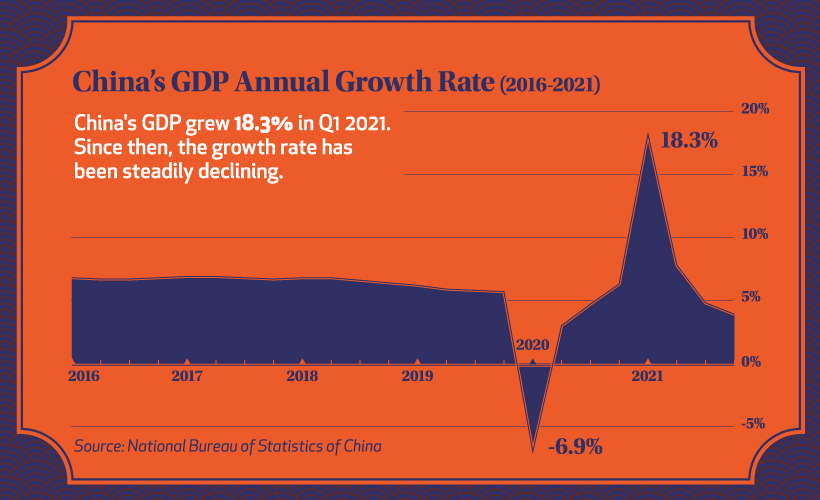
Before the pandemic hit, China’s quarterly GDP growth had been quite stable at just above 5%.
After the initial onset of COVID-19, the country’s economy faltered, mirroring economies around the globe. But after a strong recovery into 2021, resurging cases caused a new series of crackdowns on the private sector, slowing down GDP growth considerably.
With the slowdown continuing into early 2022, China’s economic horizon still looks uncertain. The lockdown in Shanghai is expected to continue all the way to June 1st, and over recent months there have been hundreds of ships stuck outside of Shanghai’s port as a part of ongoing supply chain challenges.
China’s Zero-COVID Policy: Good or Bad for the Economy?
While every country reacted to the COVID-19 pandemic differently, China adopted a zero-COVID policy of strict lockdowns to control cases and outbreaks.
For most of 2021, the policy didn’t deter GDP growth. Despite some major cities fully or partially locked down to control regional outbreaks, the country’s economy still paced well ahead of many other major economies.
But the policy faced a challenge with the emergence of the Omicron variant. Despite lockdowns and an 88% vaccination rate nationally, seven out of China’s 31 provinces and all of the biggest cities have reported Omicron cases.
And China’s zero-COVID policy has not affected all sectors equally. Industrial production rose by more than 10% in the first 11 months of 2021, despite city lockdowns around the country. That’s because many factories in China are in suburban industrial parks outside the cities, and employees often live nearby.
But many sectors like hotels and restaurants have been more severely affected by city lockdowns. Many global economies are starting to transition to living with COVID, with China remaining as one of the last countries to follow a zero-COVID policy. Does that ensure the country’s economy will continue to slow in 2022, or will China manage to recover and maintain one of the world’s fastest growing economies?


Markets
Ranked: The Largest U.S. Corporations by Number of Employees
We visualized the top U.S. companies by employees, revealing the massive scale of retailers like Walmart, Target, and Home Depot.


The Largest U.S. Corporations by Number of Employees
This was originally posted on our Voronoi app. Download the app for free on Apple or Android and discover incredible data-driven charts from a variety of trusted sources.
Revenue and profit are common measures for measuring the size of a business, but what about employee headcount?
To see how big companies have become from a human perspective, we’ve visualized the top U.S. companies by employees. These figures come from companiesmarketcap.com, and were accessed in March 2024. Note that this ranking includes publicly-traded companies only.
Data and Highlights
The data we used to create this list of largest U.S. corporations by number of employees can be found in the table below.
| Company | Sector | Number of Employees |
|---|---|---|
| Walmart | Consumer Staples | 2,100,000 |
| Amazon | Consumer Discretionary | 1,500,000 |
| UPS | Industrials | 500,000 |
| Home Depot | Consumer Discretionary | 470,000 |
| Concentrix | Information Technology | 440,000 |
| Target | Consumer Staples | 440,000 |
| Kroger | Consumer Staples | 430,000 |
| UnitedHealth | Health Care | 400,000 |
| Berkshire Hathaway | Financials | 383,000 |
| Starbucks | Consumer Discretionary | 381,000 |
| Marriott International | Consumer Discretionary | 377,000 |
| Cognizant | Information Technology | 346,600 |
Retail and Logistics Top the List
Companies like Walmart, Target, and Kroger have a massive headcount due to having many locations spread across the country, which require everything from cashiers to IT professionals.
Moving goods around the world is also highly labor intensive, explaining why UPS has half a million employees globally.
Below the Radar?
Two companies that rank among the largest U.S. corporations by employees which may be less familiar to the public include Concentrix and Cognizant. Both of these companies are B2B brands, meaning they primarily work with other companies rather than consumers. This contrasts with brands like Amazon or Home Depot, which are much more visible among average consumers.
A Note on Berkshire Hathaway
Warren Buffett’s company doesn’t directly employ 383,000 people. This headcount actually includes the employees of the firm’s many subsidiaries, such as GEICO (insurance), Dairy Queen (retail), and Duracell (batteries).
If you’re curious to see how Buffett’s empire has grown over the years, check out this animated graphic that visualizes the growth of Berkshire Hathaway’s portfolio from 1994 to 2022.

-

 Business2 weeks ago
America’s Top Companies by Revenue (1994 vs. 2023)
-

 Environment1 week ago
Ranked: Top Countries by Total Forest Loss Since 2001
-

 Real Estate1 week ago
Visualizing America’s Shortage of Affordable Homes
-

 Maps2 weeks ago
Mapped: Average Wages Across Europe
-

 Mining2 weeks ago
Charted: The Value Gap Between the Gold Price and Gold Miners
-

 Demographics2 weeks ago
Visualizing the Size of the Global Senior Population
-

 Misc2 weeks ago
Tesla Is Once Again the World’s Best-Selling EV Company
-

 Technology2 weeks ago
Ranked: The Most Popular Smartphone Brands in the U.S.