Business
Visualizing America’s Entrepreneurial Spirit During COVID-19

Mapped: America’s Entrepreneurial Spirit During COVID-19
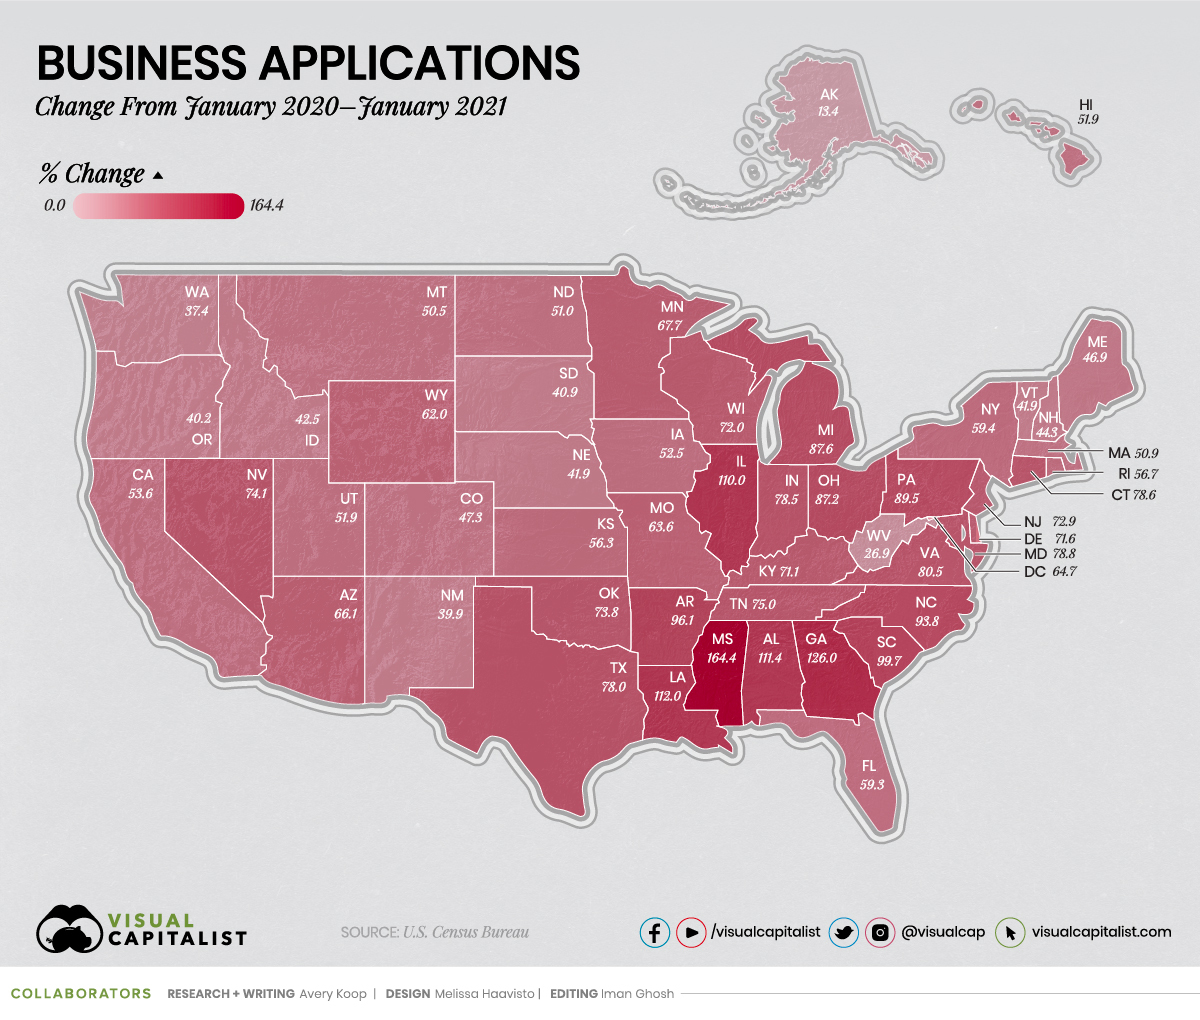
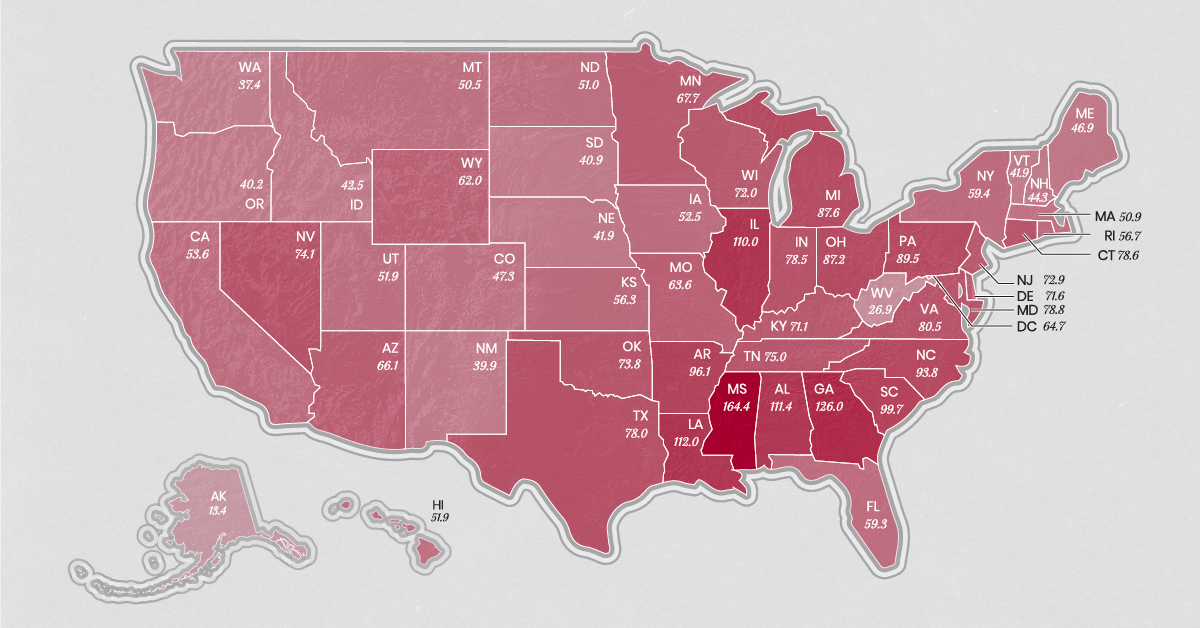
Despite the risks of opening a business during a global pandemic, new data from the U.S. Census Bureau reveals that the entrepreneurial spirit is alive and well in the United States.
In total, there were 492,133 new business applications in January 2021—an increase of over 73% year-over-year (YoY).
The region with the highest growth rate was the South at 84% with more than 220,000 new business applications in the region in January of this year. Mississippi had the highest percent increase at 164%, with over 6,000 new applications in January 2021.
Here’s a closer look at the number of total applications by state and region:
Notably, new business applications have soared in the last month or so, bouncing back from a dip between July and December 2020.
The growth rate from December 2020 to January 2021 stood at 42.6%, with the biggest change happening in the Midwest, where applications have gone up 48.6%. Here’s a look at the biggest changes in applications by region since December 2020:
| Region | Number of Applications in January 2021 | Percentage Change from December 2020 |
|---|---|---|
| Midwest | 85,503 | 48.6% |
| Northeast | 77,910 | 47.9% |
| West | 103,861 | 40.5% |
| South | 224,859 | 39.6% |
Note: Business applications are measured by collecting data on new applications for Employer Identification Numbers with the U.S. government.
Opportunity Out of Crisis
Prior to the pandemic, new business startups were actually on the decline, but in times of crisis there is often opportunity.
People have become wildly innovative during COVID-19, partly because they were forced to do so due to job or income loss. Economists call this ‘creative destruction,’ wherein new innovation springs up because of the failure of particular industries or businesses.
Here’s a look at new business applications by industry.
| Industry | Number of New Business Applications (Jan. 2021) |
|---|---|
| Retail Trade | 101,842 |
| Professional Services | 56,280 |
| Construction | 43,724 |
| Other Services | 43,511 |
| Transportation and Warehousing | 41,320 |
| Administrative Support | 32,765 |
| Accommodation and Food Services | 27,409 |
| Health Care and Social Assistance | 27,266 |
| Real Estate | 23,804 |
| Finance and Insurance | 22,607 |
| Arts and Entertainment | 14,407 |
| Unclassified | 13,442 |
| Wholesale Trade | 10,298 |
| Information | 9,907 |
| Manufacturing | 7,420 |
| Educational Services | 6,790 |
| Management of Companies | 4,273 |
| Agriculture | 3,978 |
| Mining | 585 |
| Utilities | 505 |
Creative destruction has been keenly exemplified in the rise of remote and digital services over traditional brick and mortar stores. In fact, the industry with the highest number of new business applications in January 2021 was retail services, mostly online, with over 101,000 applications.
Feeling the Entrepreneurial Spirit?
As business applications are on the rise, more jobs could potentially be created in the U.S., and competition will likely increase as well. While starting a business during COVID-19 is risky, it could have immense payoffs for the individuals involved and the overall economy.
In fact, a piece from the U.S. Chamber of Commerce actually recommends specific business ideas that are ‘pandemic-friendly.’ Among many virtually-based ideas, the list includes:
- Digital marketing
- App development
- Fitness and wellness services
- Box subscription services
Perhaps, for digitally minded entrepreneurs, there has never been a better time to start a business.
Technology
How Tech Logos Have Evolved Over Time
From complete overhauls to more subtle tweaks, these tech logos have had quite a journey. Featuring: Google, Apple, and more.

How Tech Logos Have Evolved Over Time
This was originally posted on our Voronoi app. Download the app for free on iOS or Android and discover incredible data-driven charts from a variety of trusted sources.
One would be hard-pressed to find a company that has never changed its logo. Granted, some brands—like Rolex, IBM, and Coca-Cola—tend to just have more minimalistic updates. But other companies undergo an entire identity change, thus necessitating a full overhaul.
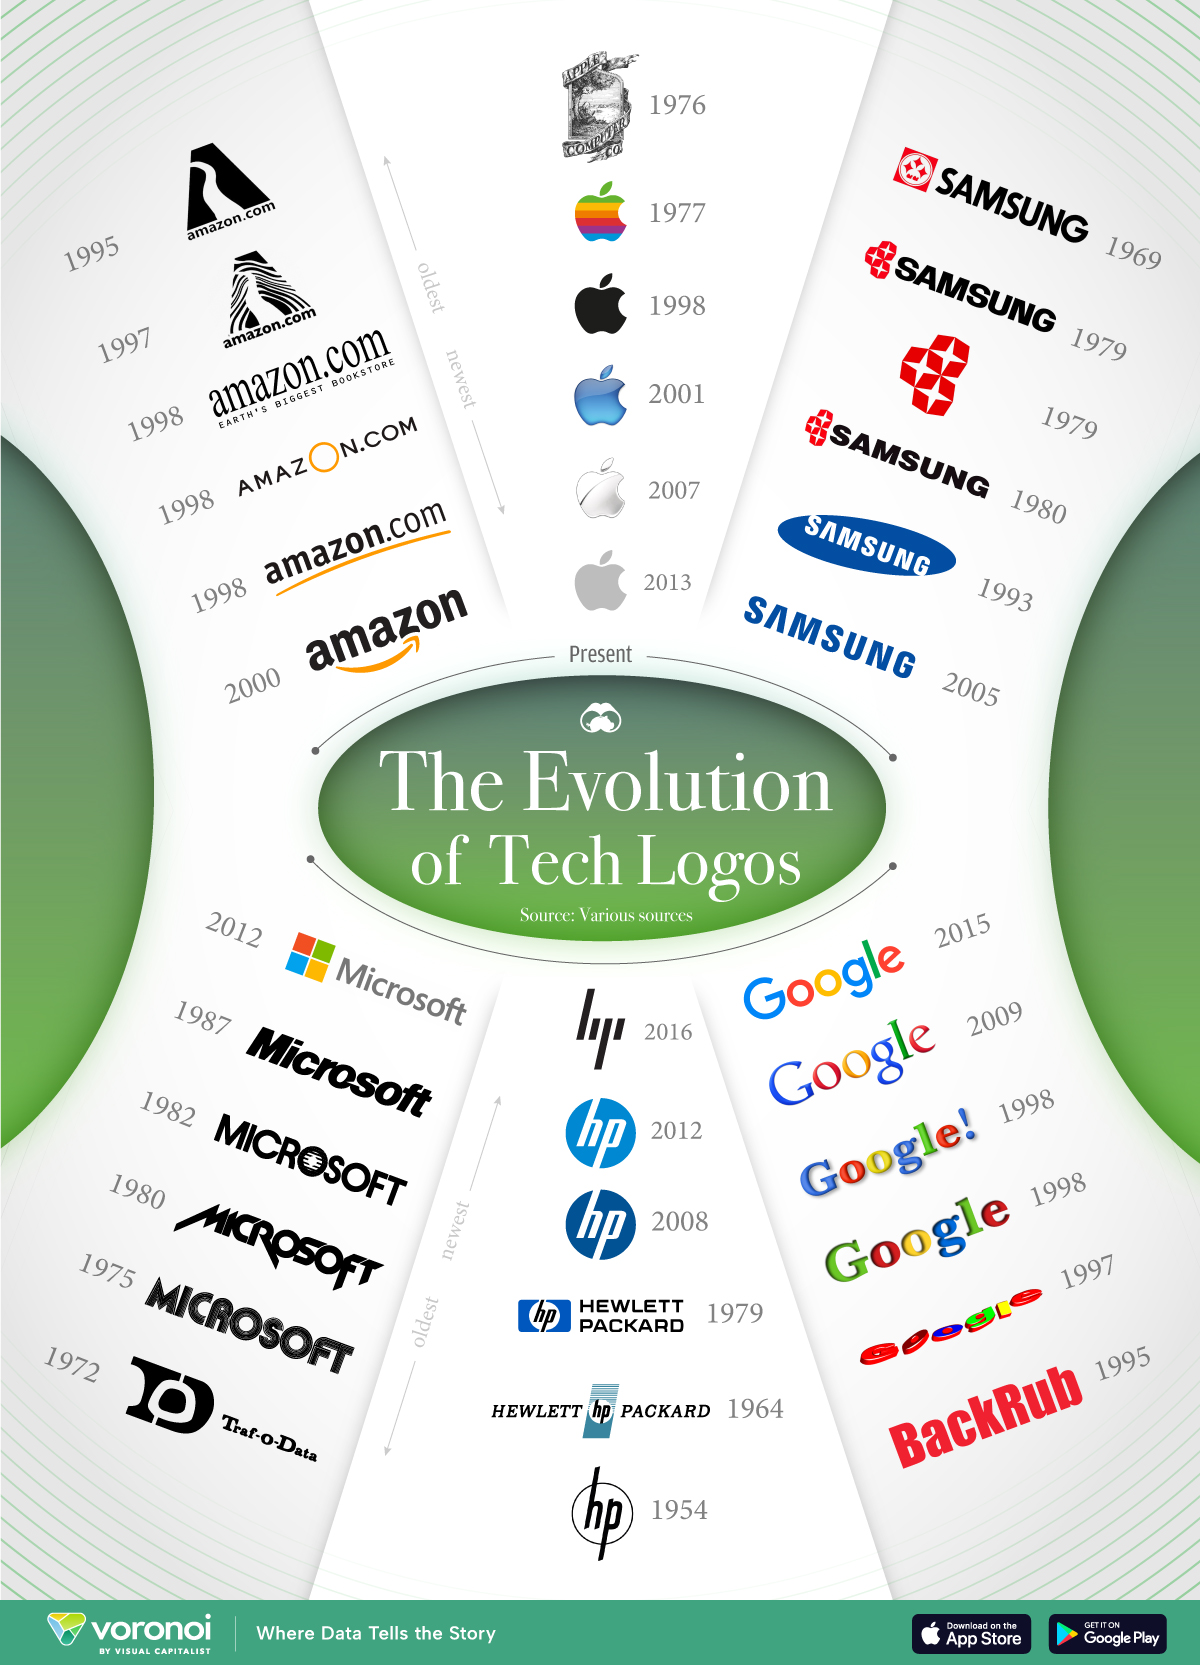
In this graphic, we visualized the evolution of prominent tech companies’ logos over time. All of these brands ranked highly in a Q1 2024 YouGov study of America’s most famous tech brands. The logo changes are sourced from 1000logos.net.
How Many Times Has Google Changed Its Logo?
Google and Facebook share a 98% fame rating according to YouGov. But while Facebook’s rise was captured in The Social Network (2010), Google’s history tends to be a little less lionized in popular culture.
For example, Google was initially called “Backrub” because it analyzed “back links” to understand how important a website was. Since its founding, Google has undergone eight logo changes, finally settling on its current one in 2015.
| Company | Number of Logo Changes |
|---|---|
| 8 | |
| HP | 8 |
| Amazon | 6 |
| Microsoft | 6 |
| Samsung | 6 |
| Apple | 5* |
Note: *Includes color changes. Source: 1000Logos.net
Another fun origin story is Microsoft, which started off as Traf-O-Data, a traffic counter reading company that generated reports for traffic engineers. By 1975, the company was renamed. But it wasn’t until 2012 that Microsoft put the iconic Windows logo—still the most popular desktop operating system—alongside its name.
And then there’s Samsung, which started as a grocery trading store in 1938. Its pivot to electronics started in the 1970s with black and white television sets. For 55 years, the company kept some form of stars from its first logo, until 1993, when the iconic encircled blue Samsung logo debuted.
Finally, Apple’s first logo in 1976 featured Isaac Newton reading under a tree—moments before an apple fell on his head. Two years later, the iconic bitten apple logo would be designed at Steve Jobs’ behest, and it would take another two decades for it to go monochrome.
-

 Markets1 week ago
U.S. Debt Interest Payments Reach $1 Trillion
-

 Business2 weeks ago
Charted: Big Four Market Share by S&P 500 Audits
-

 Real Estate2 weeks ago
Ranked: The Most Valuable Housing Markets in America
-

 Money2 weeks ago
Which States Have the Highest Minimum Wage in America?
-

 AI2 weeks ago
Ranked: Semiconductor Companies by Industry Revenue Share
-

 Markets2 weeks ago
Ranked: The World’s Top Flight Routes, by Revenue
-

 Demographics2 weeks ago
Population Projections: The World’s 6 Largest Countries in 2075
-

 Markets2 weeks ago
The Top 10 States by Real GDP Growth in 2023


