Visualizing Americans’ Financial Assets by Age


Visualizing Americans’ Financial Assets by Age
What do your account balances look like? Chances are you’ll answer that question differently if you’re a new graduate versus if you’re a retiree.
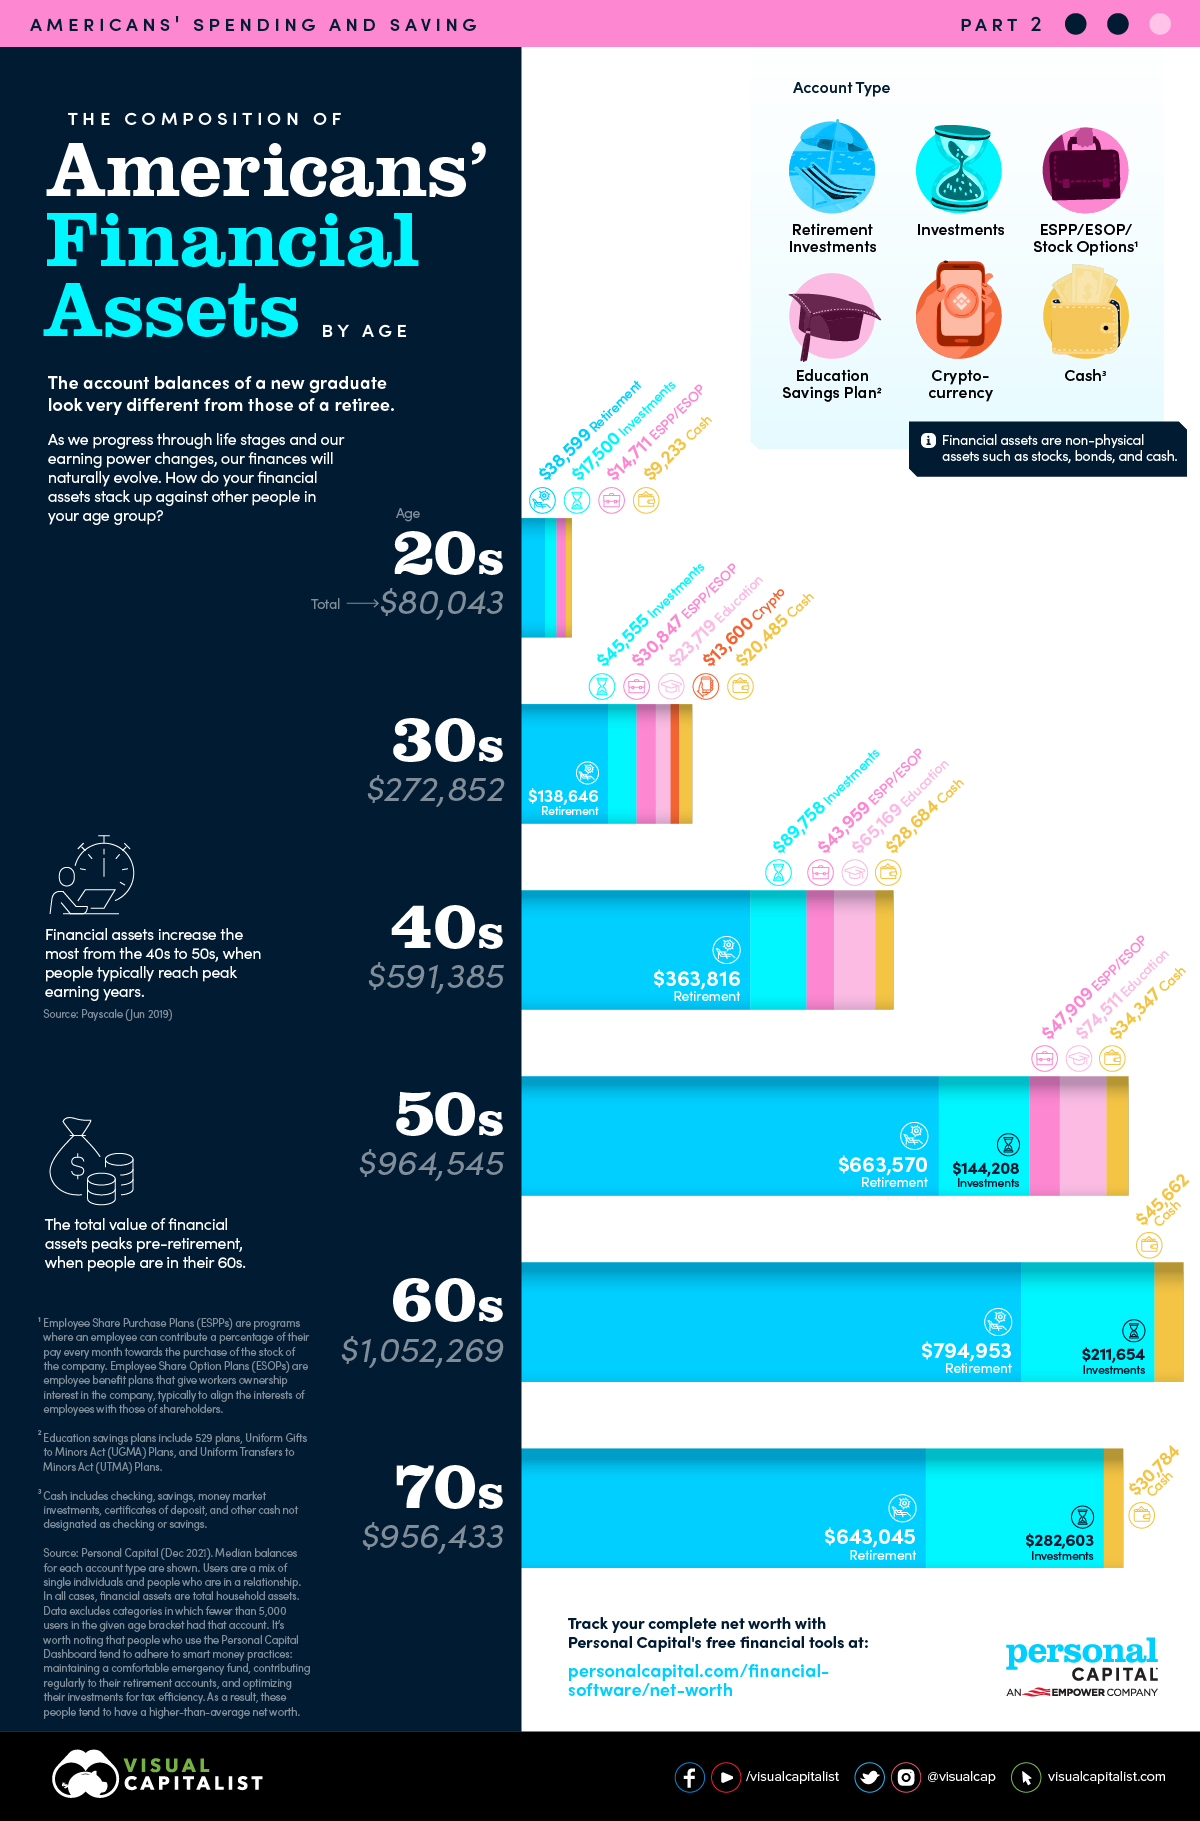
As we progress through life stages and our earning power changes, our finances will naturally evolve. In this graphic from Personal Capital, we look at a breakdown of financial assets by age. It’s the second in a three-part series that explores the spending and saving of Americans.
What Are Financial Assets?
Before we take a look at the data, it’s key to understand what financial assets are. Financial assets are non-physical assets that are typically liquid. This means they can be easily exchanged for cash. They derive their value from their contractual claim on an underlying entity, such as an ownership share in a company.
Some common examples are:
- Cash
- Certificates of deposit
- Bonds
- Mutual funds
- Stocks
They do not include physical assets such as real estate, vehicles, or commodities, which have an inherent value due to their physical attributes.
A Breakdown by Decade
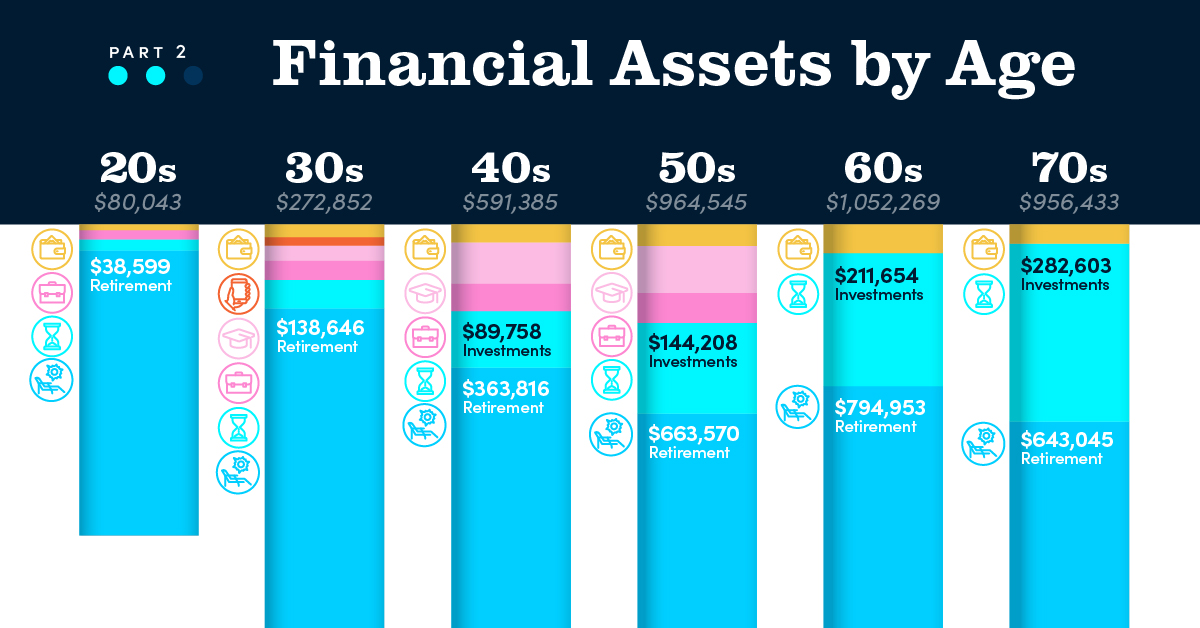
We calculated the breakdown of financial assets from the anonymized data of Personal Capital users, who tend to have a higher-than-average net worth. Here are the median balances for each account type by age.
| Account Type | 20s | 30s | 40s | 50s | 60s | 70s |
|---|---|---|---|---|---|---|
| Cash | $9,233 | $20,485 | $28,684 | $34,347 | $45,662 | $30,784 |
| Cryptocurrency | - | $13,600 | - | - | - | - |
| Education Savings Plans | - | $23,719 | $65,169 | $74,511 | - | - |
| ESPP/ESOP/Stock Options | $14,711 | $30,847 | $43,959 | $47,909 | - | - |
| Investments | $17,500 | $45,555 | $89,758 | $144,208 | $211,654 | $282,603 |
| Retirement Investments | $38,599 | $138,646 | $363,816 | $663,570 | $794,953 | $643,045 |
| Total | $80,043 | $272,852 | $591,385 | $964,545 | $1,052,269 | $956,433 |
Data excludes categories in which fewer than 5,000 users in the given age bracket had that account. Users are a mix of single individuals and people who are in a relationship. In all cases, assets are total household assets.
As is likely expected, people in their 20s had the lowest total balance. Interestingly, they held a whopping 30% of their financial assets in cash and employee share plans/stock options, the highest of any age group. One possible reason for this is that their investments haven’t yet had time to benefit from the power of compound interest.
The biggest jump in assets is from the 40s to 50s, when people reach peak earning years. In their 50s, the balances in Education Savings Plans are highest as people prepare to send their children to college.
Total asset balances typically max out when people are in their 60s, at just over $1 million. At this point, retirement investments make up 76% of their assets, but begin to decline in their 70s when most people have retired.
The Evolution of Financial Assets
At each stage of life, account balances can vary depending on personal goals and how long the money has had to grow. However, one thing is obvious based on this data: the importance Americans place on retirement investments. These investments made up about half or more of financial assets in every decade, from the 20s to the 70s.
In Part 3 of the Americans’ Spending and Saving Series, we’ll take a look at how much Americans plan to spend annually in retirement.

-

 Sponsored3 years ago
More Than Precious: Silver’s Role in the New Energy Era (Part 3 of 3)
Long known as a precious metal, silver in solar and EV technologies will redefine its role and importance to a greener economy.
-
 Sponsored7 years ago
The History and Evolution of the Video Games Market
Everything from Pong to the rise of mobile gaming and AR/VR. Learn about the $100 billion video games market in this giant infographic.
-
 Sponsored8 years ago
The Extraordinary Raw Materials in an iPhone 6s
Over 700 million iPhones have now been sold, but the iPhone would not exist if it were not for the raw materials that make the technology…
-
 Sponsored8 years ago
The Industrial Internet, and How It’s Revolutionizing Mining
The convergence of the global industrial sector with big data and the internet of things, or the Industrial Internet, will revolutionize how mining works.