Markets
Visualized: The World’s Population at 8 Billion

VC+ members get access to our World at 8 Billion Report.
Gain access to this exclusive new report and webinar by becoming a VC+ member.
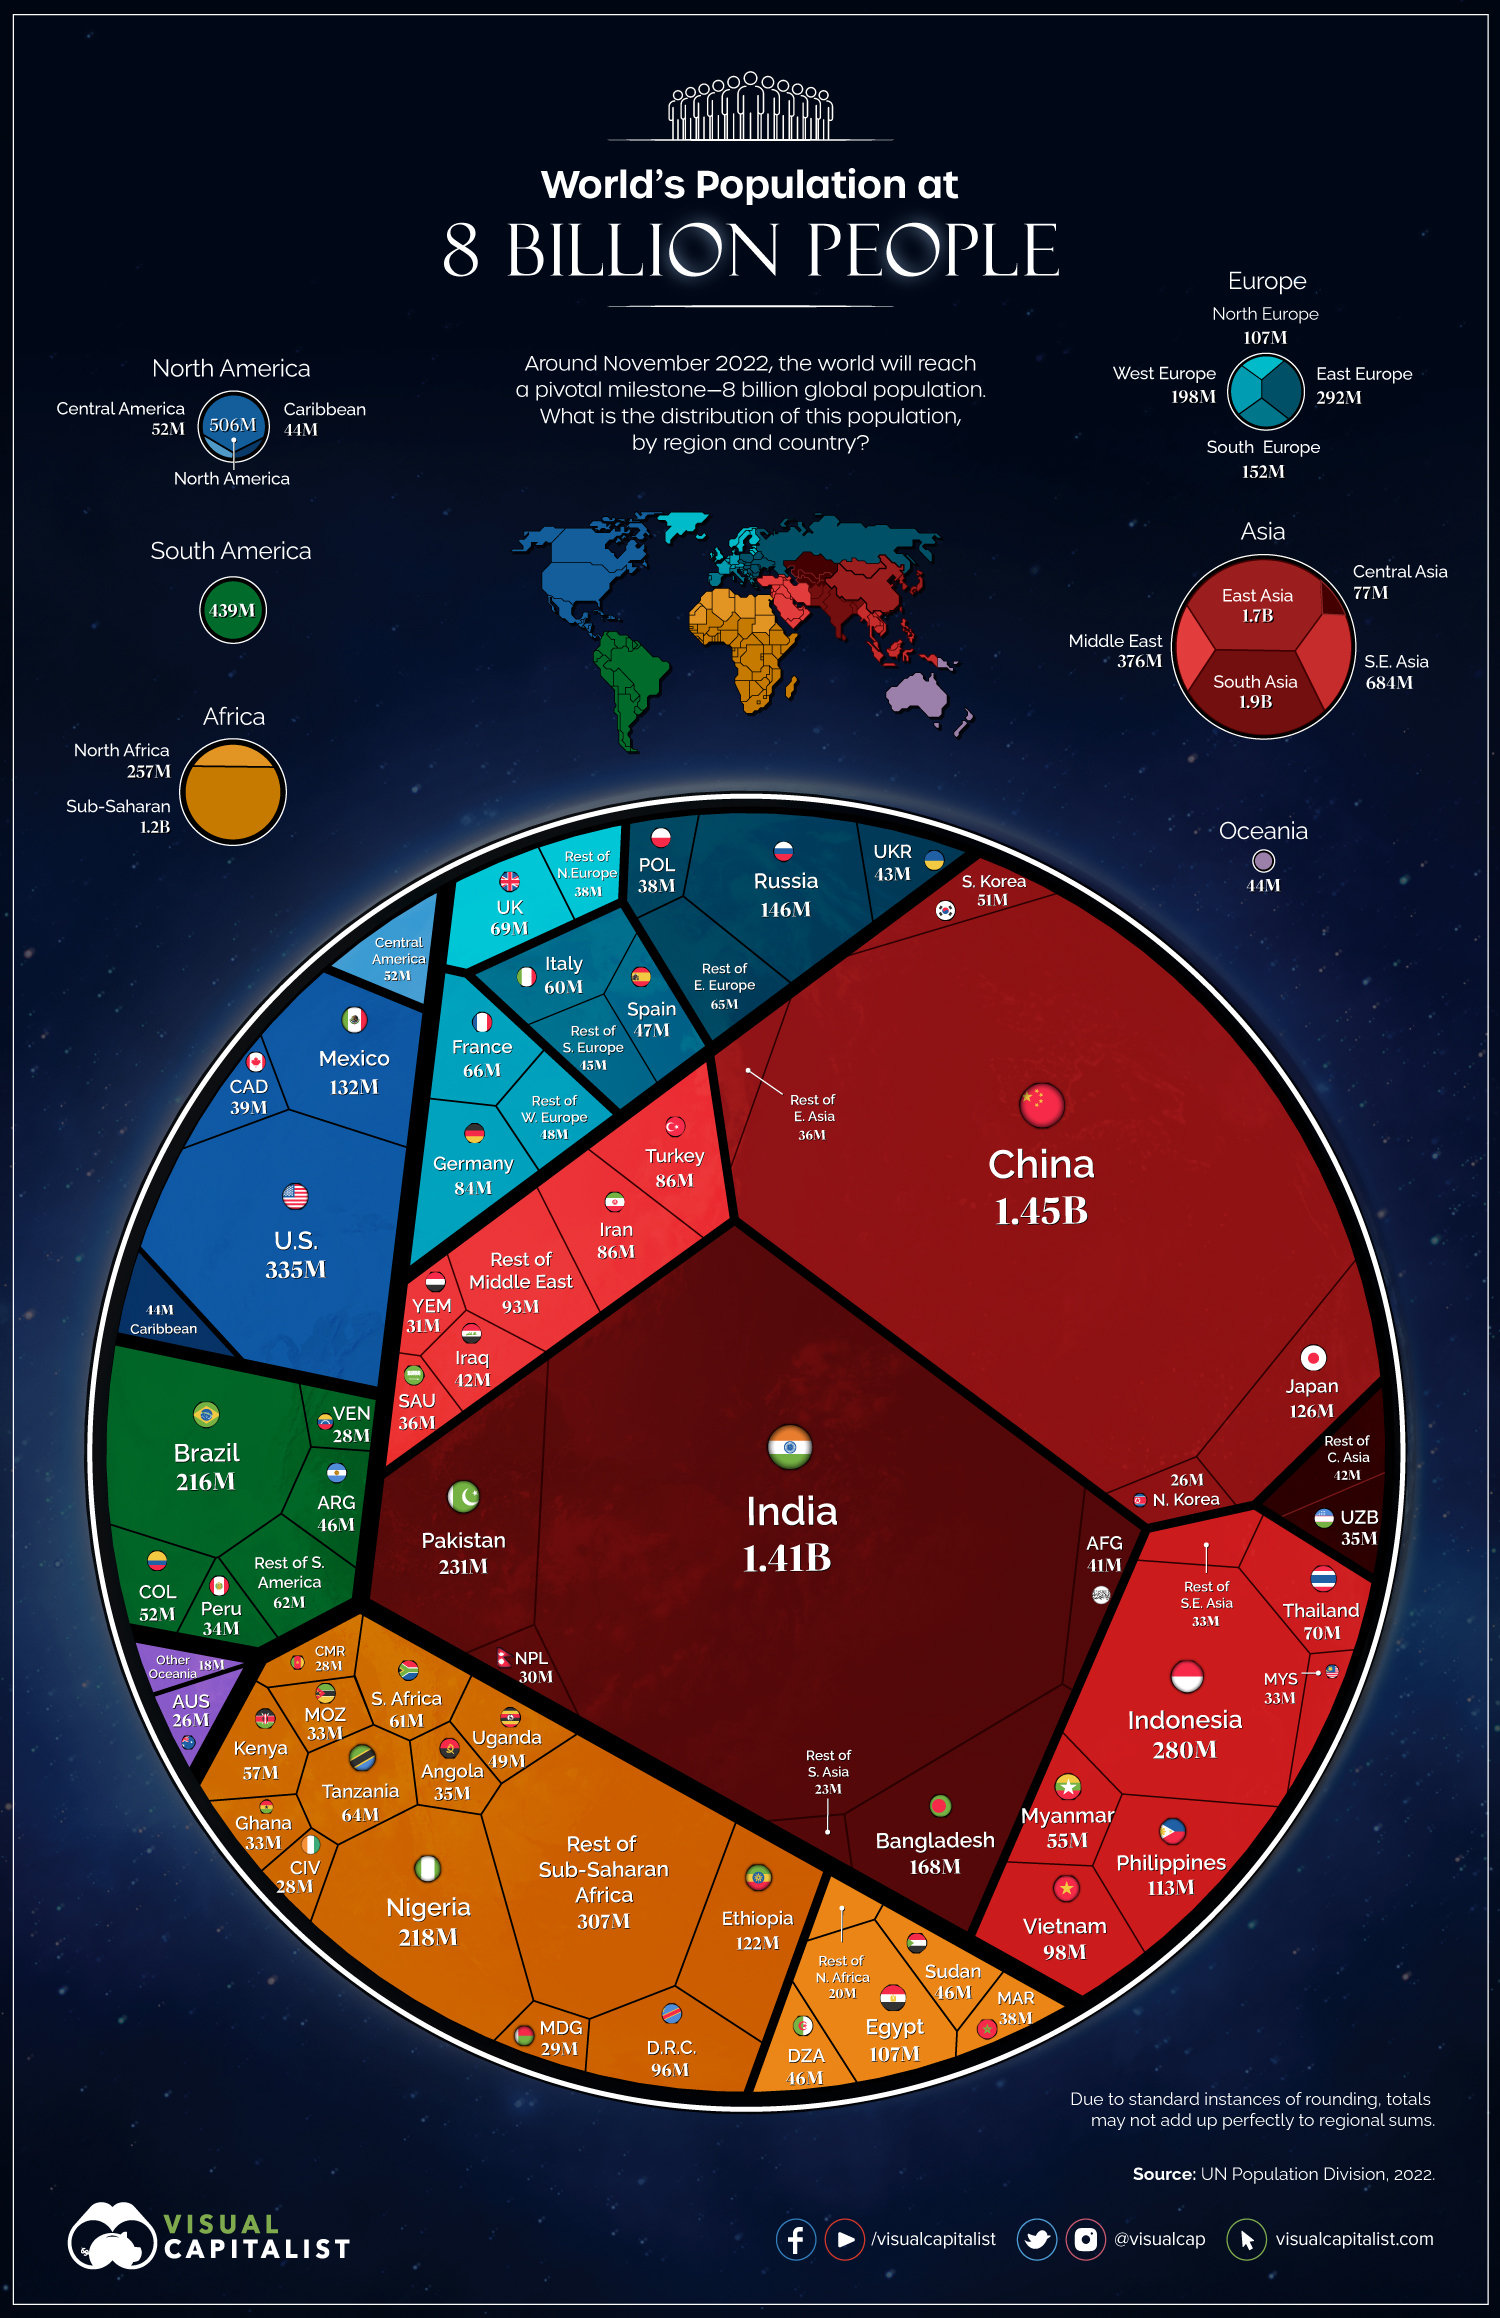
Visualized: The World’s Population at 8 Billion
At some point in late 2022, the eight billionth human being will enter the world, ushering in a new milestone for humanity.
In just 48 years, the world population has doubled in size, jumping from four to eight billion. Of course, humans are not equally spread throughout the planet, and countries take all shapes and sizes. The visualizations in this article aim to build context on how the eight billion people are distributed around the world.
For extended coverage of this moment and what it means to the world, you can get access to our full report and webinar by signing up to VC+, our premium newsletter.
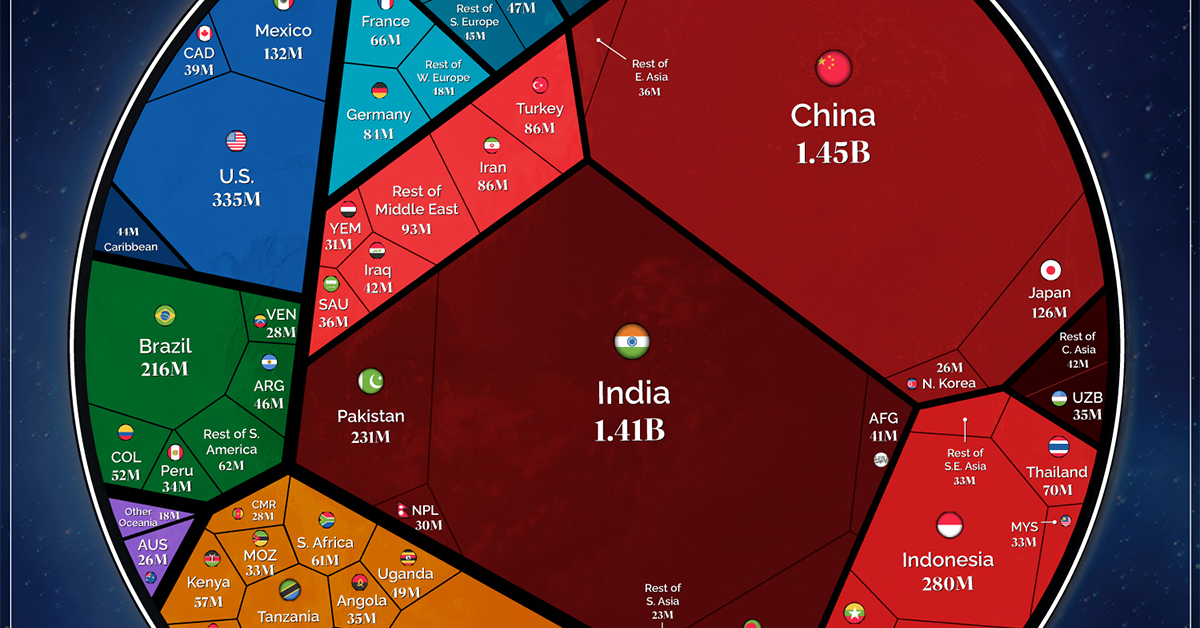
Now, here’s a look at each country’s population as of September 2022:
| Global Rank | Country/Region | Population (2022) |
|---|---|---|
| 1 | 🇨🇳 China | 1,451,832,064 |
| 2 | 🇮🇳 India | 1,410,982,243 |
| 3 | 🇺🇸 United States | 335,391,957 |
| 4 | 🇮🇩 Indonesia | 280,139,383 |
| 5 | 🇵🇰 Pakistan | 230,918,073 |
| 6 | 🇳🇬 Nigeria | 218,243,241 |
| 7 | 🇧🇷 Brazil | 215,986,577 |
| 8 | 🇧🇩 Bangladesh | 168,436,792 |
| 9 | 🇷🇺 Russia | 146,074,130 |
| 10 | 🇲🇽 Mexico | 132,030,739 |
| 11 | Japan | 125,619,457 |
| 12 | Ethiopia | 121,709,461 |
| 13 | Philippines | 112,939,493 |
| 14 | Egypt | 106,839,825 |
| 15 | Vietnam | 98,311,965 |
| 16 | Democratic Republic of Congo | 96,104,525 |
| 17 | Iran | 86,465,398 |
| 16 | Turkey | 86,415,852 |
| 19 | Germany | 84,385,892 |
| 20 | Thailand | 70,192,866 |
| 21 | United Kingdom | 68,691,253 |
| 22 | France | 65,597,276 |
| 23 | Tanzania | 63,802,882 |
| 24 | South Africa | 61,027,608 |
| 25 | Italy | 60,264,287 |
| 26 | Kenya | 56,557,929 |
| 27 | Myanmar | 55,236,333 |
| 28 | Colombia | 52,123,686 |
| 29 | South Korea | 51,367,770 |
| 30 | Uganda | 49,222,889 |
| 31 | Spain | 46,795,195 |
| 32 | Sudan | 46,265,964 |
| 33 | Argentina | 46,141,195 |
| 34 | Algeria | 45,695,757 |
| 35 | Ukraine | 43,156,242 |
| 36 | Iraq | 42,348,230 |
| 37 | Afghanistan | 40,993,541 |
| 38 | Canada | 38,495,773 |
| 39 | Morocco | 37,914,397 |
| 40 | Poland | 37,754,428 |
| 41 | Saudi Arabia | 36,069,266 |
| 42 | Angola | 35,327,540 |
| 43 | Uzbekistan | 34,589,376 |
| 44 | Peru | 34,031,086 |
| 45 | Mozambique | 33,346,961 |
| 46 | Malaysia | 33,319,730 |
| 47 | Ghana | 32,594,574 |
| 48 | Yemen | 31,371,445 |
| 49 | Nepal | 30,357,476 |
| 50 | Madagascar | 29,381,411 |
| 51 | Venezuela | 28,257,503 |
| 52 | Cameroon | 28,111,718 |
| 53 | Cote d'Ivoire | 27,925,649 |
| 54 | Niger | 26,344,186 |
| 55 | Australia | 26,178,342 |
| 56 | North Korea | 26,033,387 |
| 57 | Taiwan | 23,913,311 |
| 58 | Burkina Faso | 22,270,251 |
| 59 | Mali | 21,646,251 |
| 60 | Sri Lanka | 21,615,470 |
| 61 | Malawi | 20,304,147 |
| 62 | Chile | 19,489,734 |
| 63 | Zambia | 19,613,655 |
| 64 | Kazakhstan | 19,292,183 |
| 65 | Romania | 18,956,053 |
| 66 | Guatemala | 18,688,479 |
| 67 | Syria | 18,506,569 |
| 68 | Ecuador | 18,262,799 |
| 69 | Senegal | 17,793,385 |
| 70 | Chad | 17,553,601 |
| 71 | Cambodia | 17,252,457 |
| 72 | Netherlands | 17,219,859 |
| 73 | Somalia | 16,951,984 |
| 74 | Zimbabwe | 15,362,663 |
| 75 | Guinea | 13,981,705 |
| 76 | Rwanda | 13,712,855 |
| 77 | Benin | 12,878,142 |
| 78 | Burundi | 12,740,471 |
| 79 | Tunisia | 12,101,418 |
| 80 | Bolivia | 12,039,974 |
| 81 | Haiti | 11,721,737 |
| 82 | Belgium | 11,703,272 |
| 83 | South Sudan | 11,494,756 |
| 84 | Cuba | 11,311,223 |
| 85 | Dominican Republic | 11,096,411 |
| 86 | Czechia | 10,753,478 |
| 87 | Jordan | 10,434,463 |
| 88 | Azerbaijan | 10,347,430 |
| 89 | Greece | 10,310,847 |
| 90 | Honduras | 10,269,662 |
| 91 | Sweden | 10,241,804 |
| 92 | United Arab Emirates | 10,164,747 |
| 93 | Portugal | 10,130,876 |
| 94 | Hungary | 9,605,987 |
| 95 | Tajikistan | 10,042,202 |
| 96 | Belarus | 9,442,398 |
| 97 | Papua New Guinea | 9,342,727 |
| 98 | Austria | 9,122,566 |
| 99 | Israel | 8,969,013 |
| 100 | Switzerland | 8,798,256 |
| 101 | Togo | 8,737,152 |
| 102 | Serbia | 8,659,648 |
| 103 | Sierra Leone | 8,357,040 |
| 104 | Hong Kong SAR | 7,635,279 |
| 105 | Laos | 7,519,384 |
| 106 | Paraguay | 7,333,782 |
| 107 | Libya | 7,086,602 |
| 108 | Bulgaria | 6,833,885 |
| 109 | Nicaragua | 6,805,420 |
| 110 | Kyrgyzstan | 6,774,001 |
| 111 | Lebanon | 6,758,016 |
| 112 | El Salvador | 6,560,071 |
| 113 | Turkmenistan | 6,236,038 |
| 114 | Singapore | 5,954,898 |
| 115 | Congo | 5,839,721 |
| 116 | Denmark | 5,838,070 |
| 117 | Finland | 5,559,984 |
| 118 | Norway | 5,517,561 |
| 119 | Slovakia | 5,465,545 |
| 120 | Oman | 5,414,812 |
| 121 | Palestine | 5,381,277 |
| 122 | Liberia | 5,338,398 |
| 123 | Costa Rica | 5,200,150 |
| 124 | Ireland | 5,064,136 |
| 125 | Central African Republic | 5,025,077 |
| 126 | Mauritania | 4,940,298 |
| 127 | New Zealand | 4,911,293 |
| 128 | Panama | 4,472,108 |
| 129 | Kuwait | 4,416,533 |
| 130 | Croatia | 4,049,640 |
| 131 | Moldova | 4,013,174 |
| 132 | Georgia | 3,972,171 |
| 133 | Eritrea | 3,659,593 |
| 134 | Uruguay | 3,500,798 |
| 135 | Mongolia | 3,400,693 |
| 136 | Bosnia and Herzegovina | 3,235,985 |
| 137 | Armenia | 2,975,648 |
| 138 | Qatar | 2,994,073 |
| 139 | Jamaica | 2,990,290 |
| 140 | Albania | 2,870,809 |
| 141 | Puerto Rico | 2,704,519 |
| 142 | Namibia | 2,648,122 |
| 143 | Lithuania | 2,640,339 |
| 144 | Gambia | 2,578,866 |
| 145 | Botswana | 2,462,832 |
| 146 | Gabon | 2,349,783 |
| 147 | Lesotho | 2,180,846 |
| 148 | North Macedonia | 2,083,183 |
| 149 | Slovenia | 2,079,575 |
| 150 | Guinea-Bissau | 2,077,878 |
| 151 | Bahrain | 1,845,321 |
| 152 | Latvia | 1,840,901 |
| 153 | Equatorial Guinea | 1,514,454 |
| 154 | Trinidad and Tobago | 1,409,672 |
| 155 | Timor | 1,377,091 |
| 156 | Estonia | 1,328,527 |
| 157 | Mauritius | 1,276,493 |
| 158 | Cyprus | 1,227,303 |
| 159 | Eswatini | 1,187,627 |
| 160 | Djibouti | 1,021,185 |
| 161 | Comoros | 913,105 |
| 162 | Fiji | 911,185 |
| 163 | Réunion | 909,806 |
| 164 | Guyana | 795,114 |
| 165 | Bhutan | 791,064 |
| 166 | Solomon Islands | 726,764 |
| 167 | Macao SAR | 669,734 |
| 168 | Luxembourg | 649,600 |
| 169 | Montenegro | 628,243 |
| 170 | Western Sahara | 632,115 |
| 171 | Suriname | 598,608 |
| 172 | Cape Verde | 569,810 |
| 173 | Micronesia (Fed. States of) | 561,300 |
| 174 | Maldives | 561,291 |
| 175 | Brunei | 447,038 |
| 176 | Malta | 444,182 |
| 177 | Belize | 414,449 |
| 178 | Bahamas | 401,818 |
| 179 | Guadeloupe | 400,277 |
| 180 | Martinique | 374,617 |
| 181 | Iceland | 346,259 |
| 182 | Vanuatu | 324,088 |
| 183 | French Guiana | 317,076 |
| 184 | New Caledonia | 291,762 |
| 185 | Mayotte | 288,384 |
| 186 | Barbados | 288,162 |
| 187 | French Polynesia | 284,580 |
| 188 | Sao Tome and Principe | 228,652 |
| 189 | Samoa | 201,401 |
| 190 | Saint Lucia | 185,519 |
| 191 | Channel Islands | 177,517 |
| 192 | Guam | 172,146 |
| 193 | Curaçao | 165,604 |
| 194 | Kiribati | 123,690 |
| 195 | Grenada | 113,966 |
| 196 | Saint Vincent and the Grenadines | 111,732 |
| 197 | Tonga | 108,440 |
| 198 | Aruba | 107,787 |
| 199 | United States Virgin Islands | 104,083 |
| 200 | Antigua and Barbuda | 99,773 |
| 201 | Seychelles | 99,725 |
| 202 | Isle of Man | 86,049 |
| 203 | Andorra | 77,542 |
| 204 | Dominica | 72,387 |
| 205 | Cayman Islands | 67,492 |
| 206 | Bermuda | 61,769 |
| 207 | Marshall Islands | 60,095 |
| 208 | Northern Mariana Islands | 58,336 |
| 209 | Greenland | 56,991 |
| 210 | American Samoa | 54,920 |
| 211 | Saint Kitts and Nevis | 54,052 |
| 212 | Faeroe Islands | 49,281 |
| 213 | Sint Maarten | 43,991 |
| 214 | Turks and Caicos | 39,924 |
| 215 | Monaco | 39,873 |
| 216 | Saint Martin | 40,198 |
| 217 | Liechtenstein | 38,374 |
| 218 | San Marino | 34,091 |
| 219 | Gibraltar | 33,669 |
| 220 | British Virgin Islands | 30,687 |
| 221 | Caribbean Netherlands | 26,779 |
| 222 | Palau | 18,288 |
| 223 | Cook Islands | 17,600 |
| 224 | Anguilla | 15,308 |
| 225 | Tuvalu | 12,126 |
| 226 | Nauru | 10,978 |
| 227 | Wallis and Futuna | 10,818 |
| 228 | Saint Barthelemy | 9,945 |
| 229 | Saint Helena | 6,118 |
| 230 | Saint Pierre & Miquelon | 5,732 |
| 231 | Montserrat | 4,999 |
| 232 | Falkland Islands | 3,723 |
| 233 | Niue | 1,651 |
| 234 | Tokelau | 1,396 |
| 235 | Holy See | 806 |
Below are regional breakdowns of population.
Africa’s Population by Country
As of 2022, Africa’s total population stands at 1.4 billion people. Many of the countries with the fastest growth rates are located in Africa and by 2050, the population of the continent is expected to jump to 2.5 billion.
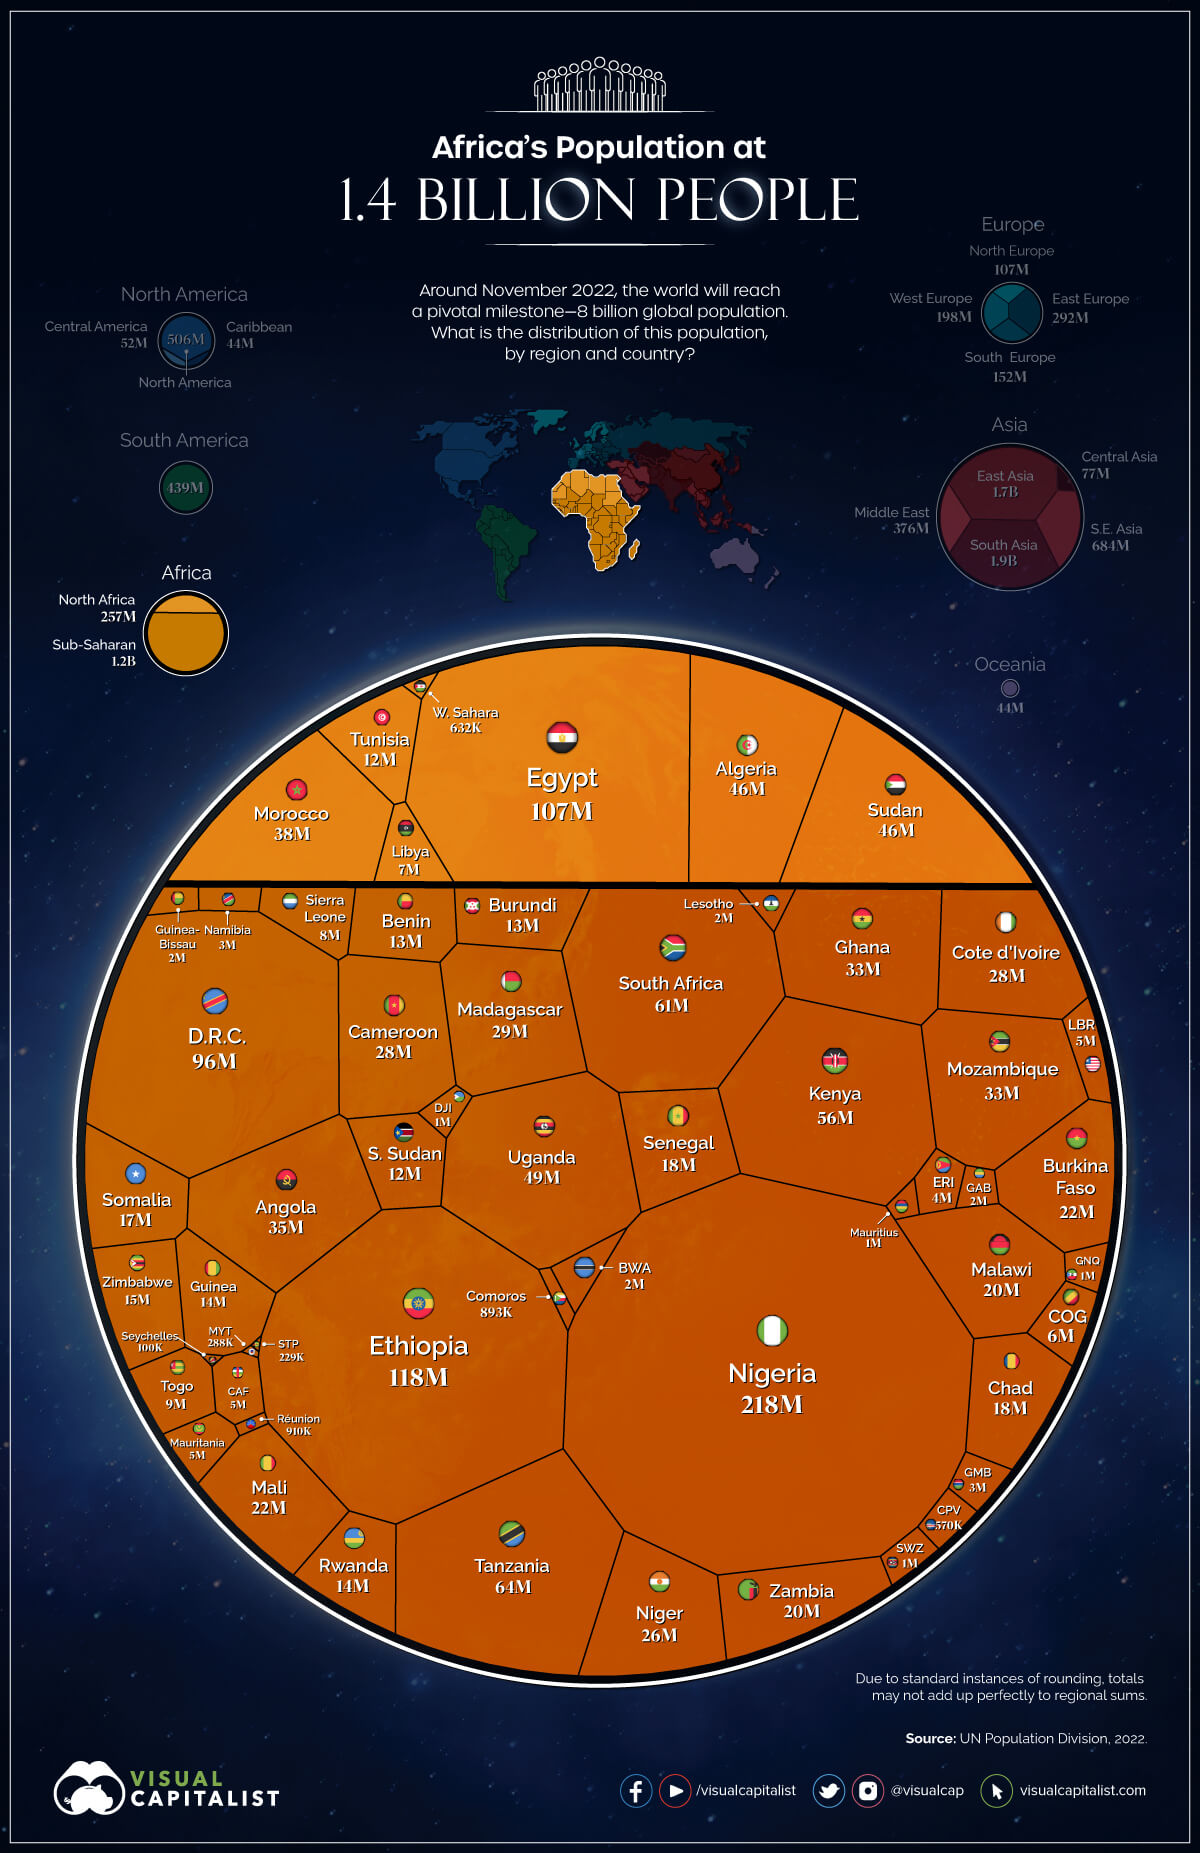
Nigeria is Africa’s most populous country and its largest economy. Based on current growth rates, Nigeria’s largest city, Lagos, could even emerge as the world’s top megacity by the end of the century.
Africa has by far the lowest median age of any of the other continents.
Asia’s Population by Country
With 4.7 billion people in 2022, Asia is by far the world’s most populous region.
The continent is dominated by the two massive population centers of China and India. In 2023, a big shift will occur, with India surpassing China to become the world’s most populous country. China has held top spot for centuries, but the mismatch between the two countries’ growth rates made it only a matter of time before this milestone arrived.
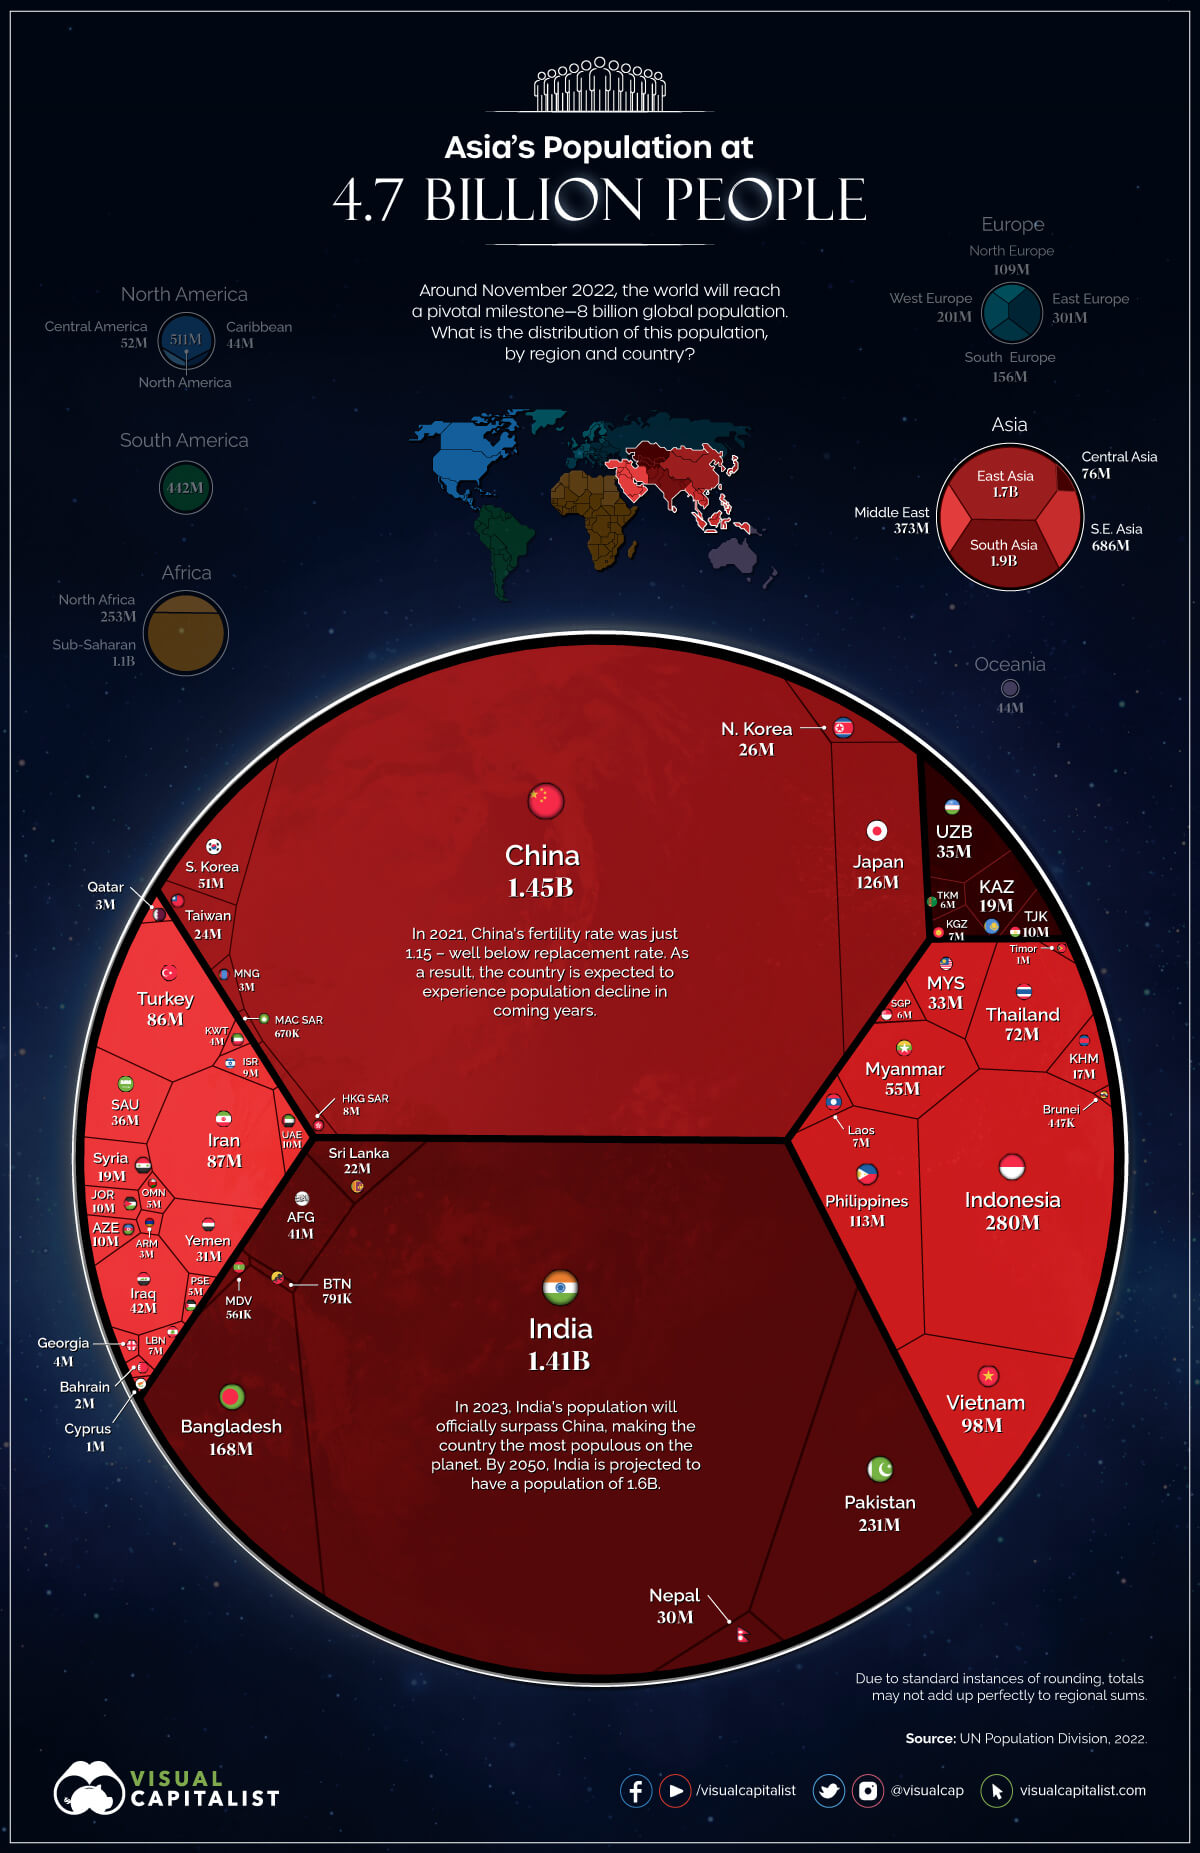
Asia is a region of contrast when it comes to population growth. On the one end are countries like Singapore and Japan, which are actually shrinking. On the other, are Middle Eastern nations like Oman and Qatar, which have robust population growth rates of 4-5%.
Vietnam is on the cusp of becoming the 15th country to surpass the 100 million population mark.
Europe’s Population by Country
Europe’s population in 2022 is 750 million people—more than twice the size of the United States.
A century ago, Europe’s population was close to 30% of the world total. Today, that figure stands at less than 10%. This is, in part, due to population growth throughout other regions of the world.
More importantly though, Europe’s population is contracting in a number of places—Eastern Europe in particular. Many of the countries with the slowest growth rates are located in the Balkans and former Soviet Bloc countries.
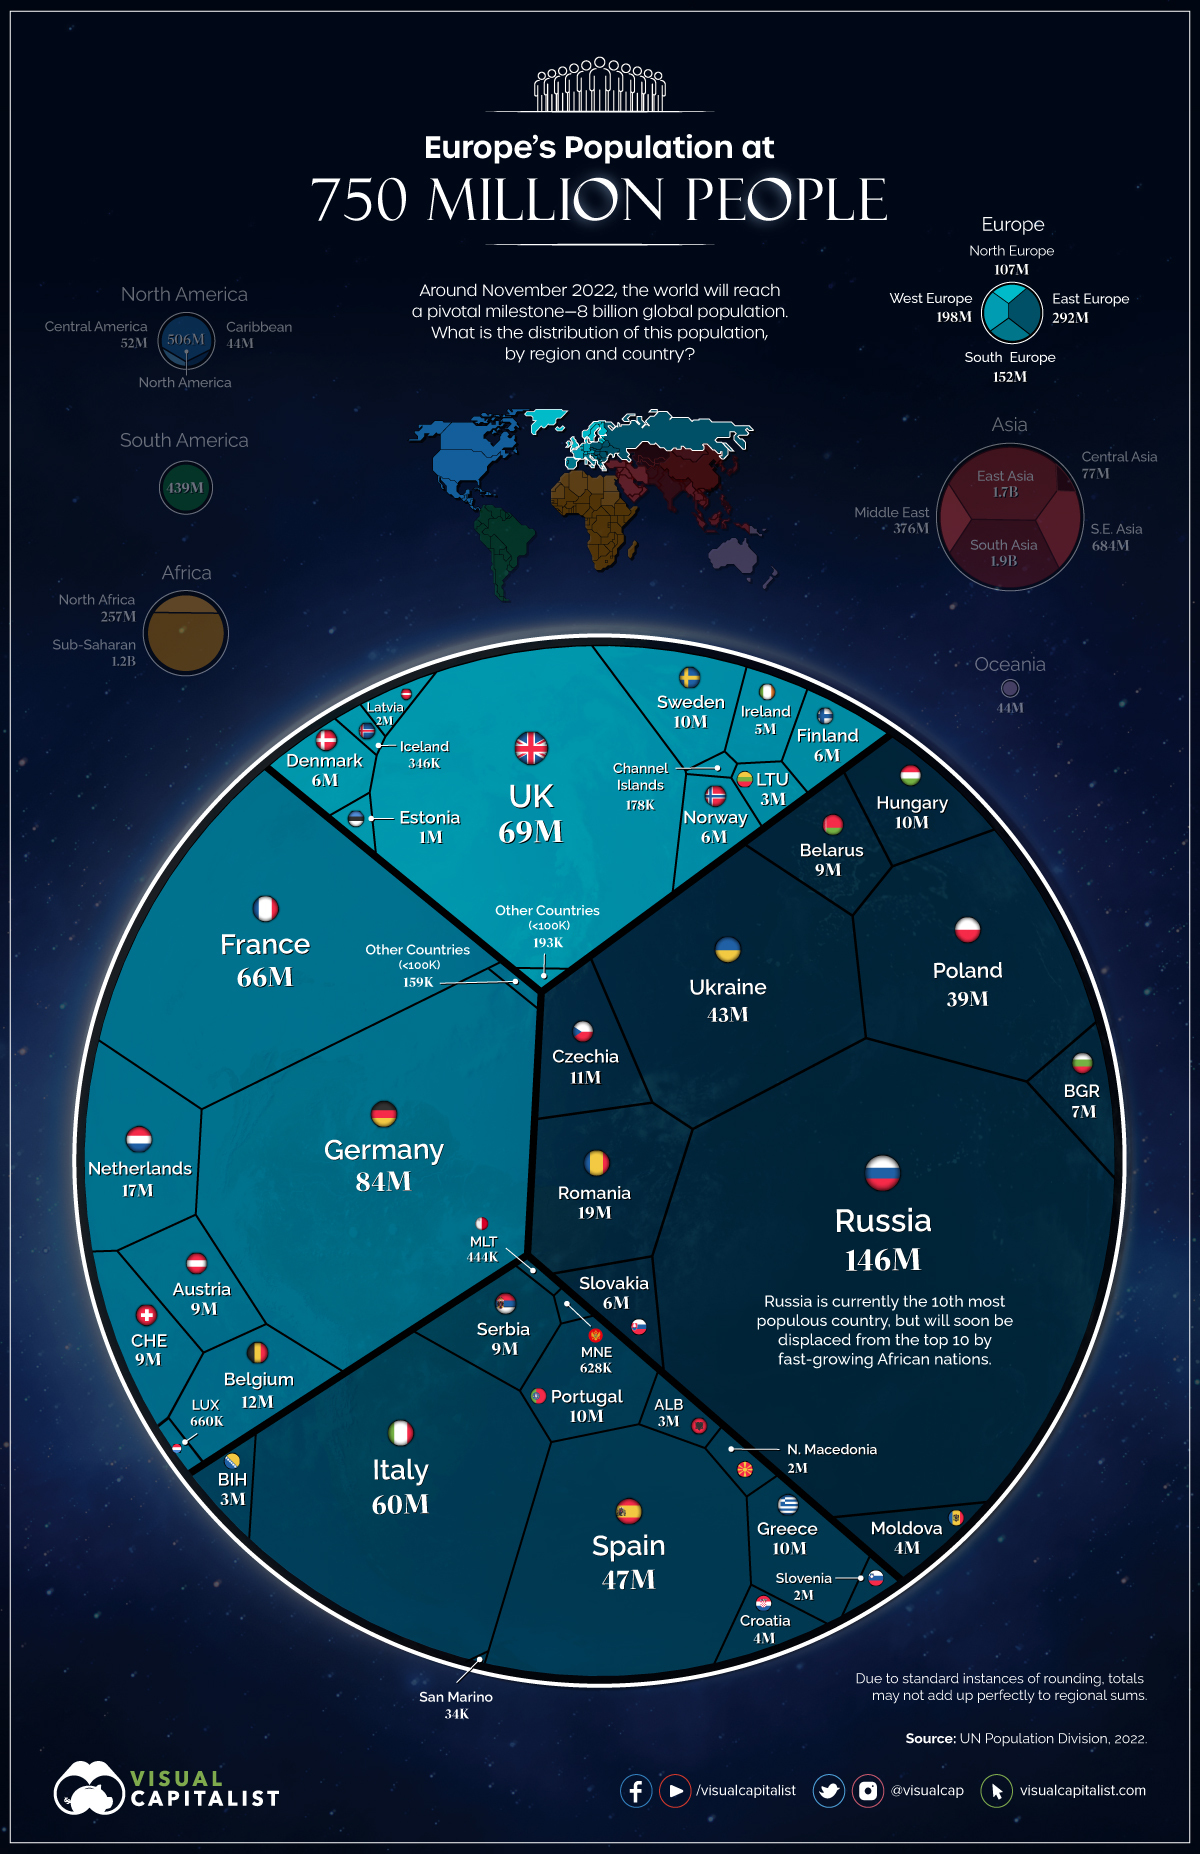
Russia remains Europe’s largest country by population. Although the country’s landmass extends all the way across Asia, three-quarters of Russia’s people live on the European side of the country.
Germany is the second largest country in Europe, followed by the UK, France, and Italy.
Ukraine is the seventh largest population center in Europe, but it remains to be seen how the current conflict with Russia impacts the country’s long-term population prospects.
North America’s Population by Country
North America’s population is 602 million people as of 2022.
The continent is dominated by the United States, which makes up more than half of the total population. America’s population is still growing modestly (by global standards), but perhaps more interesting are the internal migration patterns that are occurring. States like Texas and Florida are seeing an influx from other states.
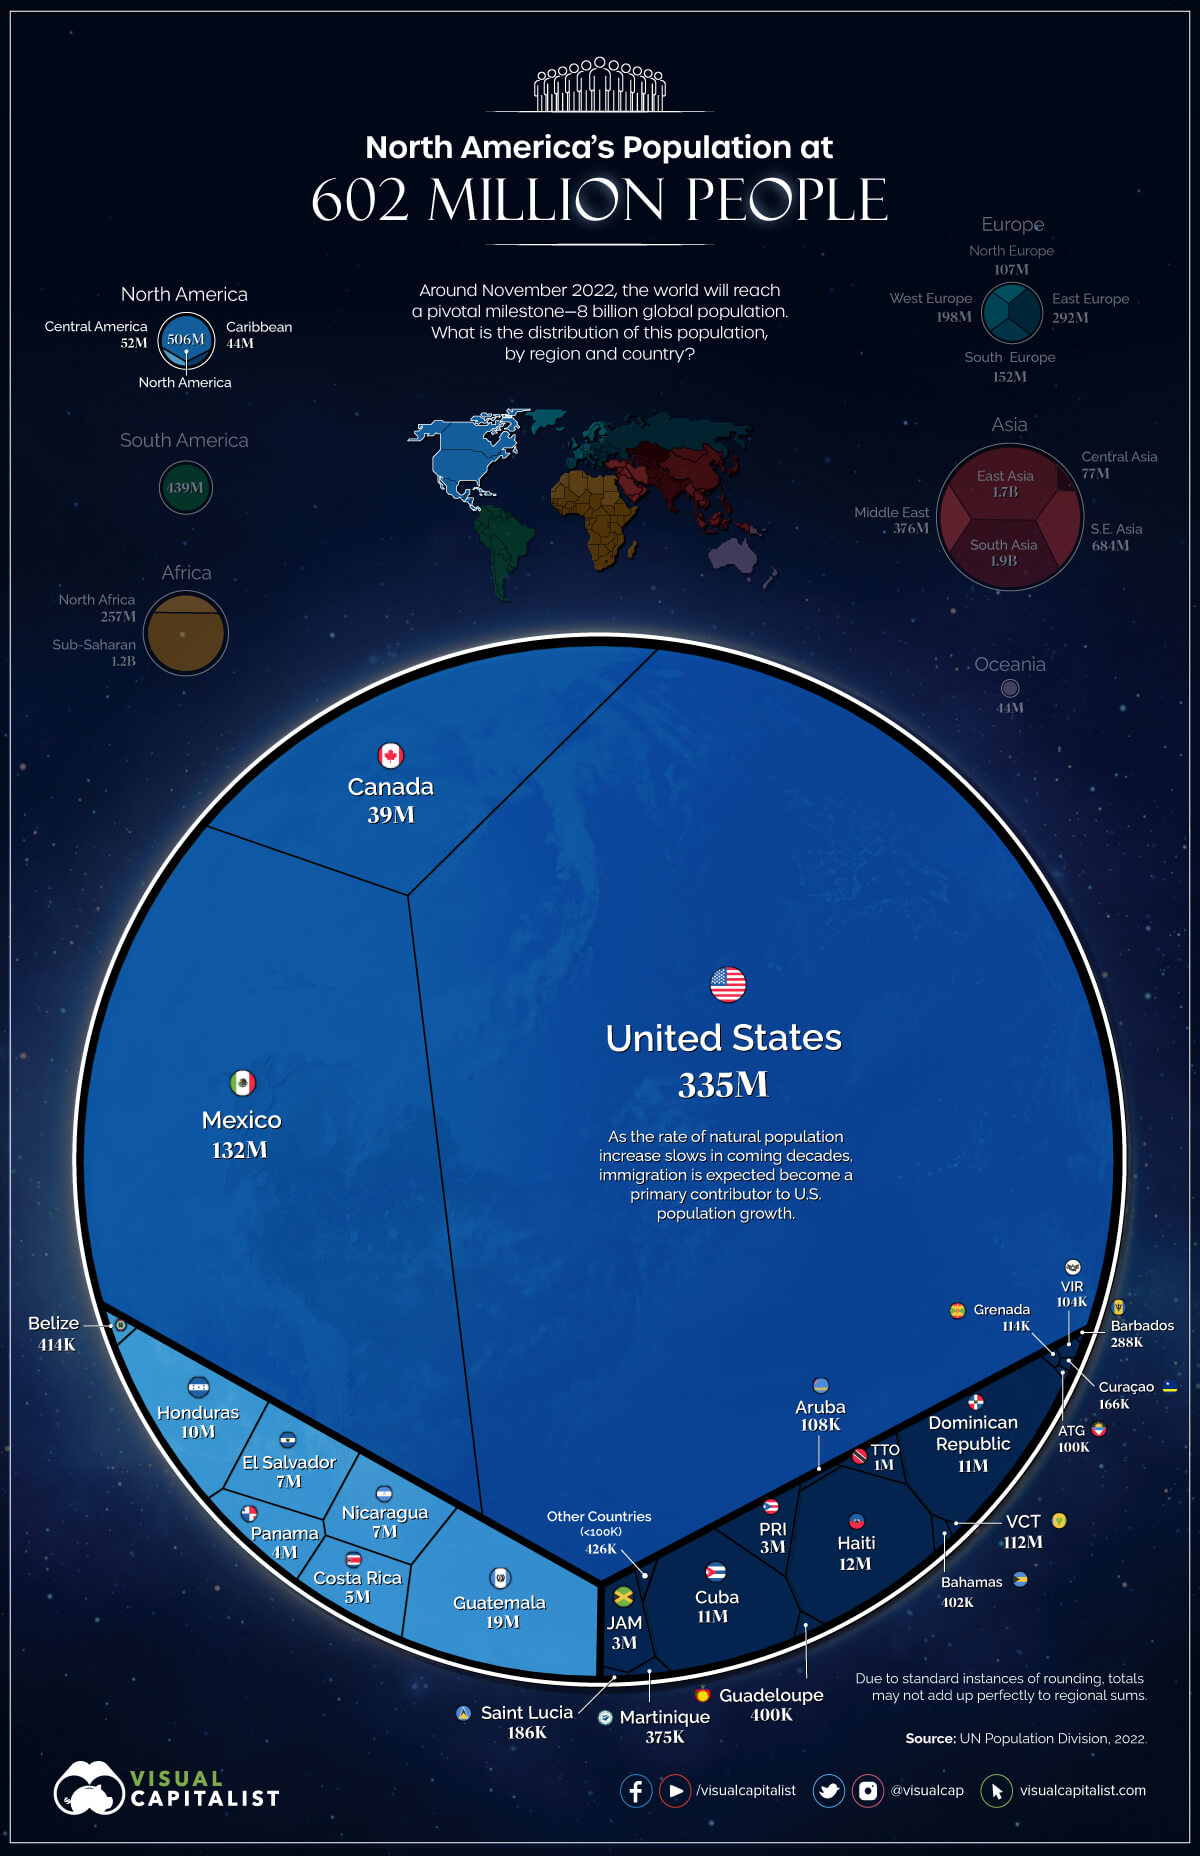
Canada has one of the highest population growth rates of major developed economies thanks to international migration.
Mexico is currently the 10th most populous country, but will eventually be bumped from the top 10 list by fast-growing African nations.
South America’s Population by Country
The population of South America in 2022 is 439 million. Brazil makes up nearly half of that total.
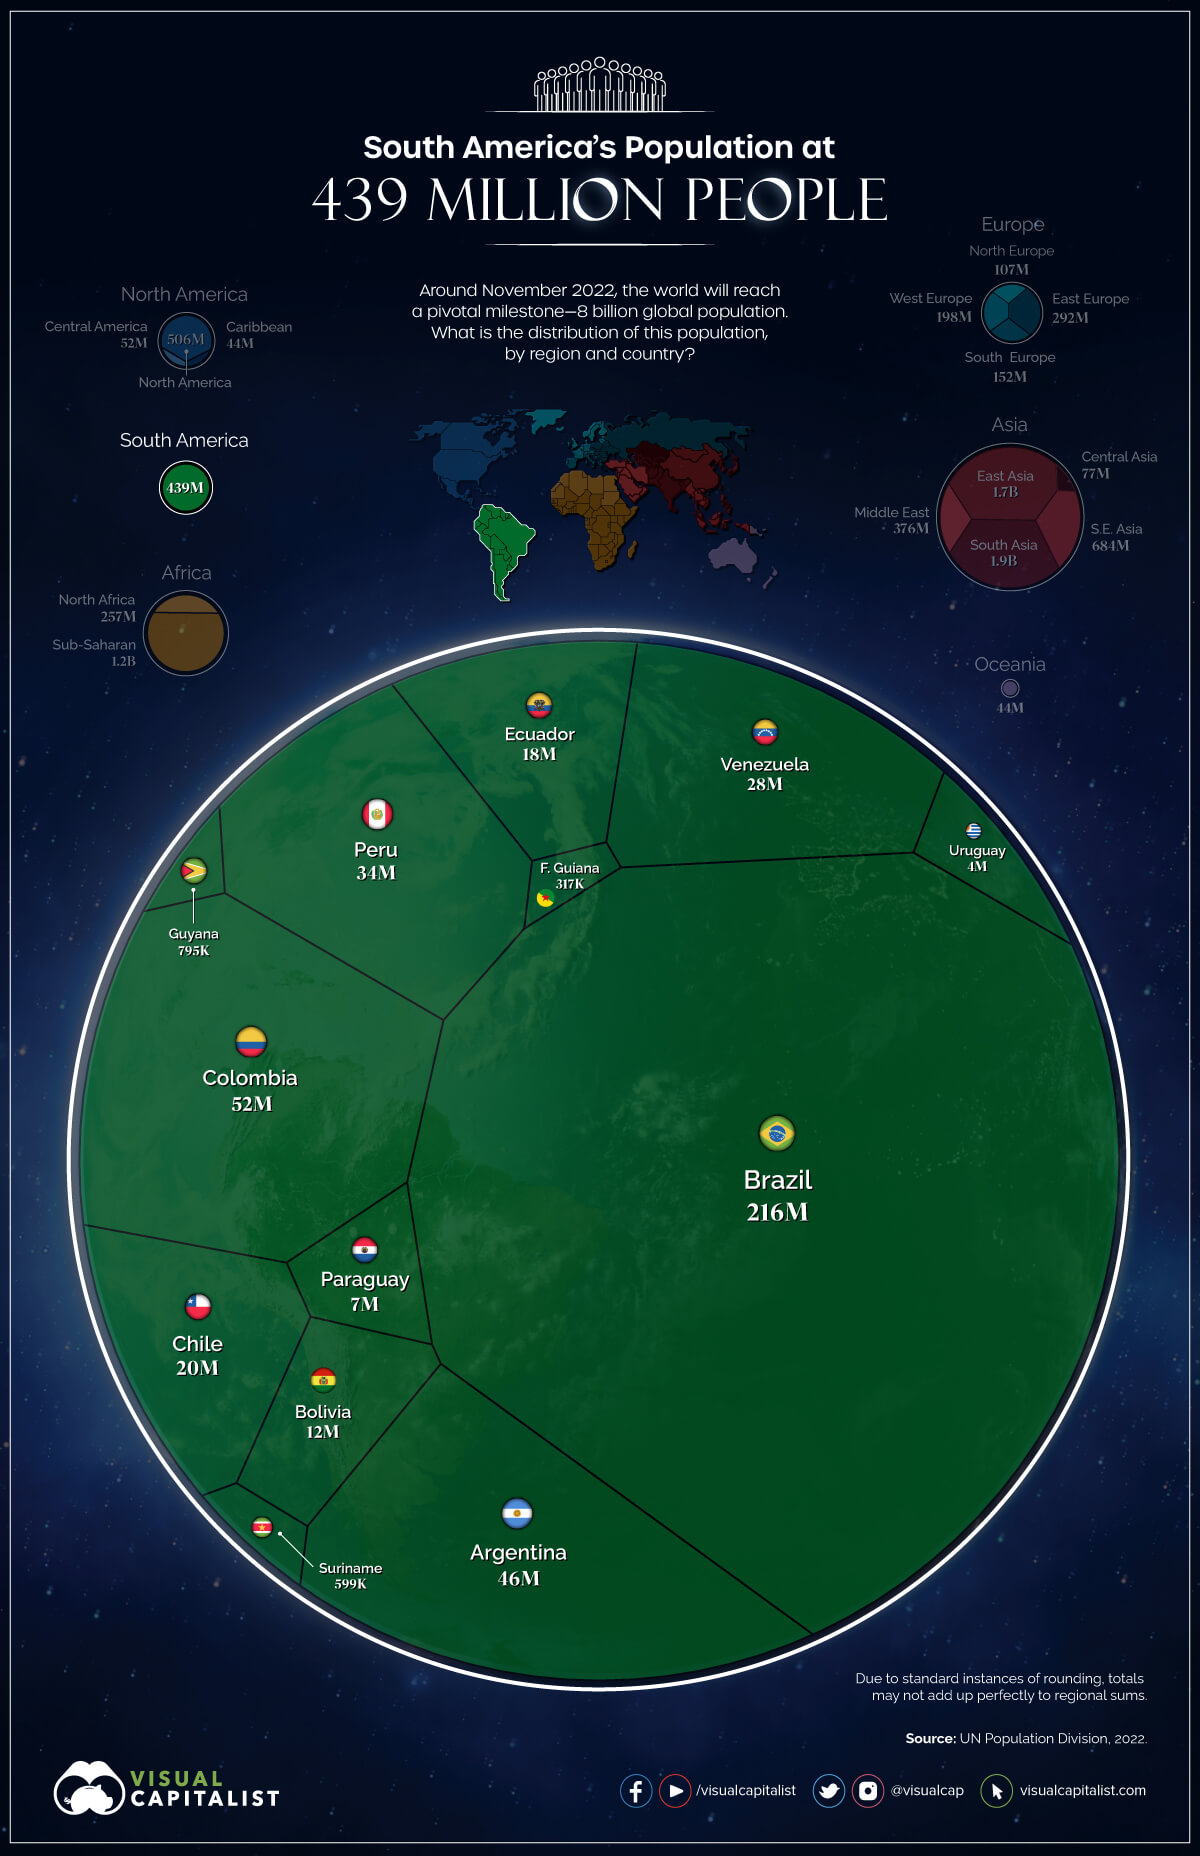
Sometime this decade, Colombia’s capital, Bogotá, will become the region’s fifth megacity (which is defined as having a population of 10 million or more). São Paulo, Rio de Janeiro, Buenos Aires, and Lima are South America’s current megacities.
Oceania’s Population by Country
The population of the Oceania region is 44 million people—just slightly higher than the population of California.
Australia, New Zealand, and Papua New Guinea make up the lion’s share of the population of this region.
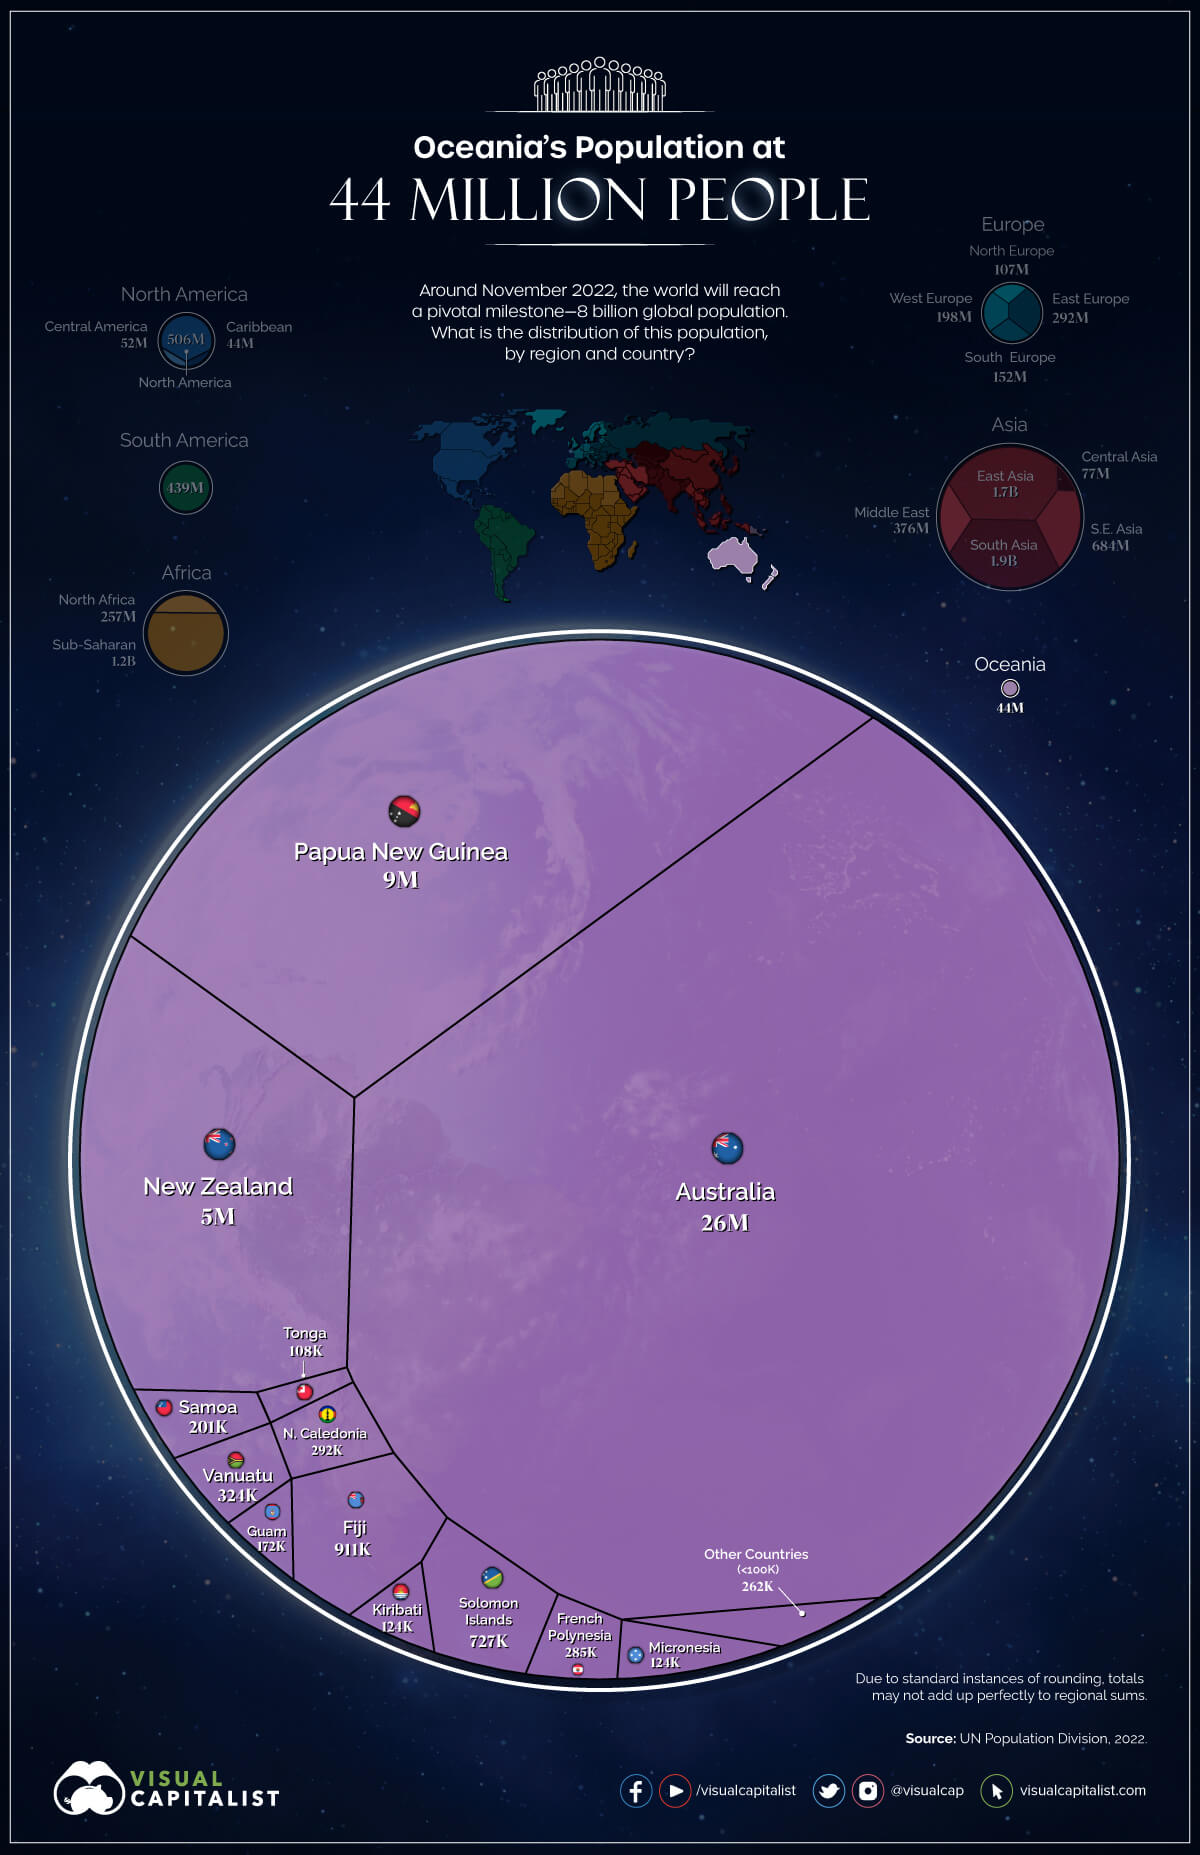
Interestingly, many of the smallest countries by population can also be found in this region.
When Will Earth’s Population Hit 9 Billion?
The next global population milestone—nine billion—will likely be hit sometime in the 2030s.
In fact, Earth’s population is expected to continue growing until it hits a peak at some point in the 2080s—possibly over the 10 billion mark.

Where does this data come from?
Source: United Nations, Department of Economic and Social Affairs, Population Division via Worldometer’s live tracker (as of Sept 27, 2022).
Context: The UN has estimated that November 15th, 2022, will be the date that the world population officially hits 8 billion.


Markets
U.S. Debt Interest Payments Reach $1 Trillion
U.S. debt interest payments have surged past the $1 trillion dollar mark, amid high interest rates and an ever-expanding debt burden.


U.S. Debt Interest Payments Reach $1 Trillion
This was originally posted on our Voronoi app. Download the app for free on iOS or Android and discover incredible data-driven charts from a variety of trusted sources.
The cost of paying for America’s national debt crossed the $1 trillion dollar mark in 2023, driven by high interest rates and a record $34 trillion mountain of debt.
Over the last decade, U.S. debt interest payments have more than doubled amid vast government spending during the pandemic crisis. As debt payments continue to soar, the Congressional Budget Office (CBO) reported that debt servicing costs surpassed defense spending for the first time ever this year.
This graphic shows the sharp rise in U.S. debt payments, based on data from the Federal Reserve.
A $1 Trillion Interest Bill, and Growing
Below, we show how U.S. debt interest payments have risen at a faster pace than at another time in modern history:
| Date | Interest Payments | U.S. National Debt |
|---|---|---|
| 2023 | $1.0T | $34.0T |
| 2022 | $830B | $31.4T |
| 2021 | $612B | $29.6T |
| 2020 | $518B | $27.7T |
| 2019 | $564B | $23.2T |
| 2018 | $571B | $22.0T |
| 2017 | $493B | $20.5T |
| 2016 | $460B | $20.0T |
| 2015 | $435B | $18.9T |
| 2014 | $442B | $18.1T |
| 2013 | $425B | $17.2T |
| 2012 | $417B | $16.4T |
| 2011 | $433B | $15.2T |
| 2010 | $400B | $14.0T |
| 2009 | $354B | $12.3T |
| 2008 | $380B | $10.7T |
| 2007 | $414B | $9.2T |
| 2006 | $387B | $8.7T |
| 2005 | $355B | $8.2T |
| 2004 | $318B | $7.6T |
| 2003 | $294B | $7.0T |
| 2002 | $298B | $6.4T |
| 2001 | $318B | $5.9T |
| 2000 | $353B | $5.7T |
| 1999 | $353B | $5.8T |
| 1998 | $360B | $5.6T |
| 1997 | $368B | $5.5T |
| 1996 | $362B | $5.3T |
| 1995 | $357B | $5.0T |
| 1994 | $334B | $4.8T |
| 1993 | $311B | $4.5T |
| 1992 | $306B | $4.2T |
| 1991 | $308B | $3.8T |
| 1990 | $298B | $3.4T |
| 1989 | $275B | $3.0T |
| 1988 | $254B | $2.7T |
| 1987 | $240B | $2.4T |
| 1986 | $225B | $2.2T |
| 1985 | $219B | $1.9T |
| 1984 | $205B | $1.7T |
| 1983 | $176B | $1.4T |
| 1982 | $157B | $1.2T |
| 1981 | $142B | $1.0T |
| 1980 | $113B | $930.2B |
| 1979 | $96B | $845.1B |
| 1978 | $84B | $789.2B |
| 1977 | $69B | $718.9B |
| 1976 | $61B | $653.5B |
| 1975 | $55B | $576.6B |
| 1974 | $50B | $492.7B |
| 1973 | $45B | $469.1B |
| 1972 | $39B | $448.5B |
| 1971 | $36B | $424.1B |
| 1970 | $35B | $389.2B |
| 1969 | $30B | $368.2B |
| 1968 | $25B | $358.0B |
| 1967 | $23B | $344.7B |
| 1966 | $21B | $329.3B |
Interest payments represent seasonally adjusted annual rate at the end of Q4.
At current rates, the U.S. national debt is growing by a remarkable $1 trillion about every 100 days, equal to roughly $3.6 trillion per year.
As the national debt has ballooned, debt payments even exceeded Medicaid outlays in 2023—one of the government’s largest expenditures. On average, the U.S. spent more than $2 billion per day on interest costs last year. Going further, the U.S. government is projected to spend a historic $12.4 trillion on interest payments over the next decade, averaging about $37,100 per American.
Exacerbating matters is that the U.S. is running a steep deficit, which stood at $1.1 trillion for the first six months of fiscal 2024. This has accelerated due to the 43% increase in debt servicing costs along with a $31 billion dollar increase in defense spending from a year earlier. Additionally, a $30 billion increase in funding for the Federal Deposit Insurance Corporation in light of the regional banking crisis last year was a major contributor to the deficit increase.
Overall, the CBO forecasts that roughly 75% of the federal deficit’s increase will be due to interest costs by 2034.

-

 Real Estate2 weeks ago
Visualizing America’s Shortage of Affordable Homes
-

 Technology1 week ago
Ranked: Semiconductor Companies by Industry Revenue Share
-

 Money1 week ago
Which States Have the Highest Minimum Wage in America?
-

 Real Estate1 week ago
Ranked: The Most Valuable Housing Markets in America
-

 Business2 weeks ago
Charted: Big Four Market Share by S&P 500 Audits
-

 AI2 weeks ago
The Stock Performance of U.S. Chipmakers So Far in 2024
-

 Misc2 weeks ago
Almost Every EV Stock is Down After Q1 2024
-

 Money2 weeks ago
Where Does One U.S. Tax Dollar Go?