Green
The Carbon Footprint of the Food Supply Chain
Which Foods Have the Greatest Environmental Impact?
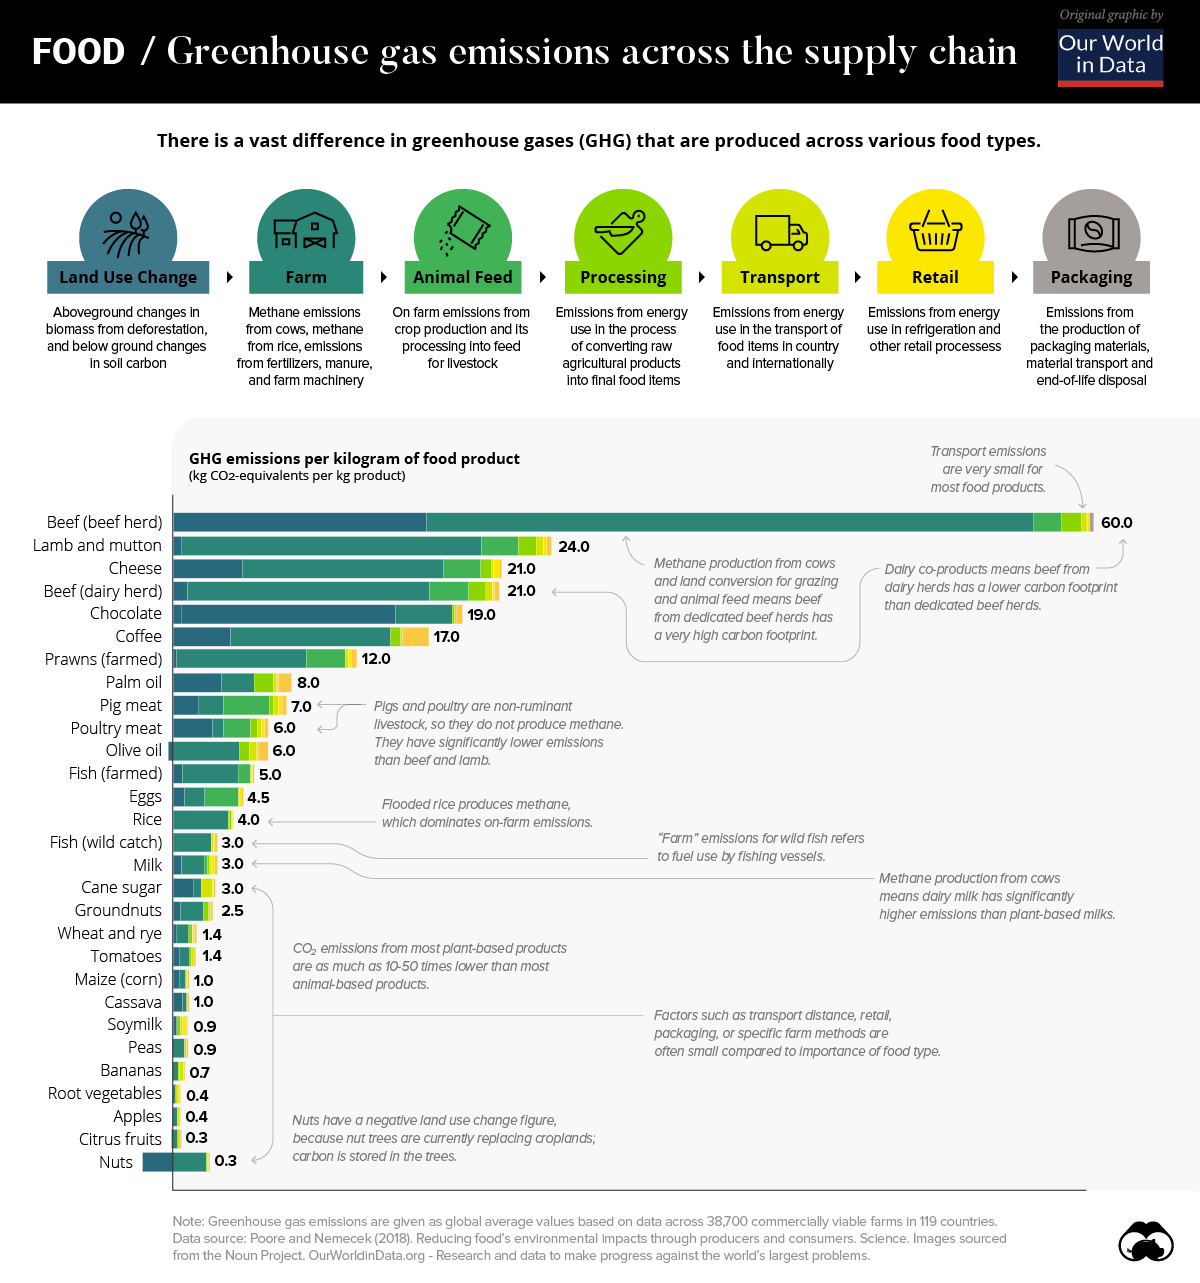
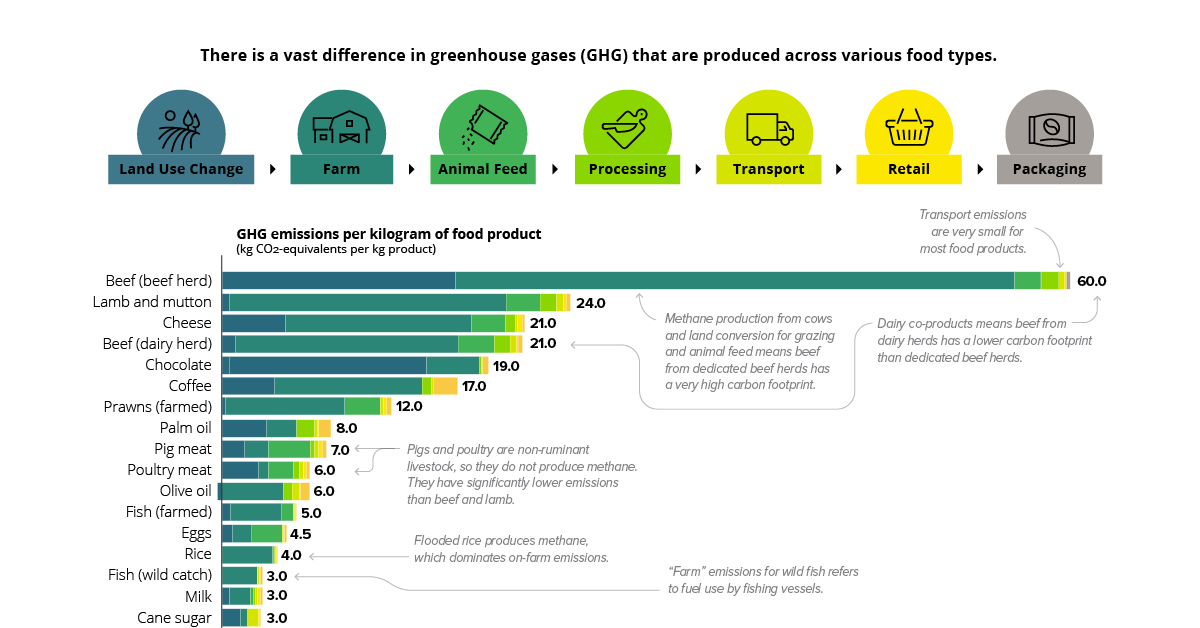
The quantity of greenhouse gases (GHGs) generated by our food can vary considerably across the global food supply chain.
In fact, the difference between specific food types can vary by orders of magnitude, meaning what we eat could be a significant factor impacting GHG emissions on the environment.
Today’s modified chart from Our World in Data relies on data from the largest meta-analysis of food systems in history. The study, published in Science was led by Joseph Poore and Thomas Nemecek to highlight the carbon footprint across different food types across the world.
The Foods With the Highest Carbon Footprint
Worldwide, there are approximately 13.7 billion metric tons of carbon dioxide equivalents (CO2e) emitted through the food supply chain per year.
Across a database extending through 119 countries and 38,000 commercial farms, the study found that, unsurprisingly, beef and other animal products have an outsize effect on emissions.
For example, one kilogram (kg) of beef results in 60 kg of GHG emissions—nearly 2.5x the closest food type, lamb and mutton. In contrast, the same weight of apples produce less than one kilogram of GHG emissions.
| Food Type | GHG Emissions per 1 kg Produced |
|---|---|
| Beef (beef herd) | 60 kgCO2e |
| Lamb & Mutton | 24 kgCO2e |
| Cheese | 21 kgCO2e |
| Beef (dairy herd) | 21 kgCO2e |
| Chocolate | 19 kgCO2e |
| Coffee | 17 kgCO2e |
| Prawns (farmed) | 12 kgCO2e |
| Palm Oil | 8 kgCO2e |
| Pig Meat | 7 kgCO2e |
| Poultry Meat | 6 kgCO2e |
| Olive Oil | 6 kgCO2e |
| Fish (farmed) | 5 kgCO2e |
| Eggs | 4.5 kgCO2e |
| Rice | 4 kgCO2e |
| Fish (wild catch) | 3 kgCO2e |
| Milk | 3 kgCO2e |
| Cane Sugar | 3 kgCO2e |
| Groundnuts | 2.5 kgCO2e |
| Wheat & Rye | 1.4 kgCO2e |
| Tomatoes | 1.4 kgCO2e |
| Maize (Corn) | 1.0 kgCO2e |
| Cassava | 1.0 kgCO2e |
| Soymilk | 0.9 kgCO2e |
| Peas | 0.9 kgCO2e |
| Bananas | 0.7 kgCO2e |
| Root Vegetables | 0.4 kgCO2e |
| Apples | 0.4 kgCO2e |
| Citrus Fruits | 0.3 kgCO2e |
| Nuts | 0.3 kgCO2e |
When it comes to plant-based foods, chocolate is among the highest GHG emitters. One kilogram of chocolate produces 19 kg of GHGs. On average, emissions from plant-based foods are 10 to 50 times lower than animal-based types.
Bottom line, it is clear that the spectrum of emissions differs significantly across each food type.
Food Supply Chain Stages
The food supply chain is complex and nuanced as it moves across each stage of the cycle.
Although the steps behind the supply chain for individual foods can vary considerably, each typically has seven stages:
- Land Use Change
- Farm
- Animal Feed
- Processing
- Transport
- Retail
- Packaging
Across all foods, the land use and farm stages of the supply chain account for 80% of GHG emissions. In beef production, for example, there are three key contributing factors to the carbon footprint at these stages: animal feed, land conversion, and methane production from cows. In the U.S., beef production accounts for 40% of total livestock-related land use domestically.
On the other end of the spectrum is transportation. This stage of the supply chain makes up 10% of total GHG emissions on average. When it comes to beef, the proportion of GHGs that transportation emits is even smaller, at just 0.5% of total emissions.
Contrary to popular belief, sourcing food locally may not help GHG emissions in a very significant way, especially in the case of foods with a large carbon footprint.
The Rise of Plant-Based Alternatives
Amid a growing market share of plant-based alternatives in markets around the world, the future of the food supply chain could undergo a significant transition.
For investors, this shift is already evident. Beyond Meat, a leading provider of meat substitutes, was one of the best performing stocks of 2019—gaining 202% after its IPO in May 2019.
As rising awareness about the environment becomes more prevalent, is it possible that growing meat consumption could be a thing of the past?


Green
How Carbon Credits Can Help Close the Climate Funding Gap
To keep a 1.5℃ world within reach, global emissions need to fall by as much as 45% by 2030, and carbon credits could help close the gap.


How Carbon Credits Can Help Close the Climate Funding Gap
Governments around the world have committed to the goals of the Paris Agreement, but their climate pledges are insufficient. To keep a 1.5℃ world within reach, global emissions need to fall by as much as 45% by 2030.
Bold and immediate action is essential, but so are resources that will make it happen.
In this graphic, we have partnered with Carbon Streaming to look at the role that the voluntary carbon market and carbon credits can play in closing that gap.
More Funds are Needed for Climate Finance
According to data from the Climate Policy Initiative, climate finance, which includes funds for both adaptation and mitigation, needs to increase at least five-fold, from $1.3T in 2021/2022, to an average $8.6T annually until 2030, and then to just over $10T in the two decades leading up to 2050.
That adds up to a very large number, but consider that in 2022, $7.0T went to fossil fuel subsidies, which almost covers the annual estimated outlay. And the world has shown that when pressed, governments can come up with the money, if the global pandemic is any indication.
Mobilizing Carbon Finance to the Developing World
But the same cannot be said of the developing world, where debt, inequality, and poverty reduce the ability of governments to act. And this is where carbon credits can play an important role. According to analyses from Ecosystem Marketplace, carbon credits help move capital from developed countries, to where funds are needed in the developing world.
For example, in 2019, 69.2% of the carbon credits by volume in the voluntary carbon market were purchased by buyers in Europe, and nearly a third from North America. Compare that to over 90% of the volume of carbon credits sold in the voluntary carbon market in 2022 came from projects that were located outside of those two regions.
Carbon Credits Can Complement Decarbonization Efforts
Carbon credits can also complement decarbonization efforts in the corporate world, where more and more companies have been signing up to reduce emissions. According to the 2022 monitoring report from the Science Based Targets initiative, 4,230 companies around the world had approved targets and commitments, which represented an 88% increase from the prior year. However, as of year end 2022, combined scope 1 and 2 emissions covered by science-based targets totaled approximately 2 GtCO2e, which represents just a fraction of global emissions.
The fine print is that this is just scope 1 and 2 emissions, and doesn’t include scope 3 emissions, which can account for more than 70% of a company’s total emissions. And as these emissions come under greater and greater scrutiny the closer we get to 2030 and beyond, the voluntary carbon credit market could expand exponentially to help meet the need to compensate for these emissions.
Potential Carbon Credit Market Size in 2030
OK, but how big? In 2022, the voluntary carbon credit market was around $2B, but some analysts predict that it could grow to between $5–250 billion by 2030.
| Firm | Low Estimate | High Estimate |
|---|---|---|
| Bain & Company | $15B | $30B |
| Barclays | N/A | $250B |
| Citigroup | $5B | $50B |
| McKinsey & Company | $5B | $50B |
| Morgan Stanley | N/A | $100B |
| Shell / Boston Consulting Group | $10B | $40B |
Morgan Stanley and Barclays were the most bullish on the size of the voluntary carbon credit market in 2030, but the latter firm was even more optimistic about 2050, and predicted that the voluntary carbon credit market could grow to a colossal $1.5 trillion.
Carbon Streaming is Focused on Carbon Credit Integrity
Ultimately, carbon credits could have an important role to play in marshaling the resources needed to keep the world on track to net zero by 2050, and avoiding the worst consequences of a warming world.
Carbon Streaming uses streaming transactions, a proven and flexible funding model, to scale high-integrity carbon credit projects to advance global climate action and UN Sustainable Development Goals.
Learn more at www.carbonstreaming.com.

-

 Green1 week ago
Ranking the Top 15 Countries by Carbon Tax Revenue
This graphic highlights France and Canada as the global leaders when it comes to generating carbon tax revenue.
-

 Green1 week ago
Ranked: The Countries With the Most Air Pollution in 2023
South Asian nations are the global hotspot for pollution. In this graphic, we rank the world’s most polluted countries according to IQAir.
-

 Environment2 weeks ago
Top Countries By Forest Growth Since 2001
One country is taking reforestation very seriously, registering more than 400,000 square km of forest growth in two decades.
-

 Green3 weeks ago
Ranked: Top Countries by Total Forest Loss Since 2001
The country with the most forest loss since 2001 lost as much forest cover as the next four countries combined.
-

 Markets2 months ago
The World’s Top Cocoa Producing Countries
Here are the largest cocoa producing countries globally—from Côte d’Ivoire to Brazil—as cocoa prices hit record highs.
-

 Environment2 months ago
Charted: Share of World Forests by Country
We visualize which countries have the biggest share of world forests by area—and while country size plays a factor, so too, does the environment.


-

 Maps1 week ago
The Largest Earthquakes in the New York Area (1970-2024)
-

 Money2 weeks ago
Where Does One U.S. Tax Dollar Go?
-

 Automotive2 weeks ago
Almost Every EV Stock is Down After Q1 2024
-

 AI2 weeks ago
The Stock Performance of U.S. Chipmakers So Far in 2024
-

 Markets2 weeks ago
Charted: Big Four Market Share by S&P 500 Audits
-

 Real Estate2 weeks ago
Ranked: The Most Valuable Housing Markets in America
-

 Money2 weeks ago
Which States Have the Highest Minimum Wage in America?
-

 AI2 weeks ago
Ranked: Semiconductor Companies by Industry Revenue Share