Green
The Carbon Footprint of the Food Supply Chain
Which Foods Have the Greatest Environmental Impact?
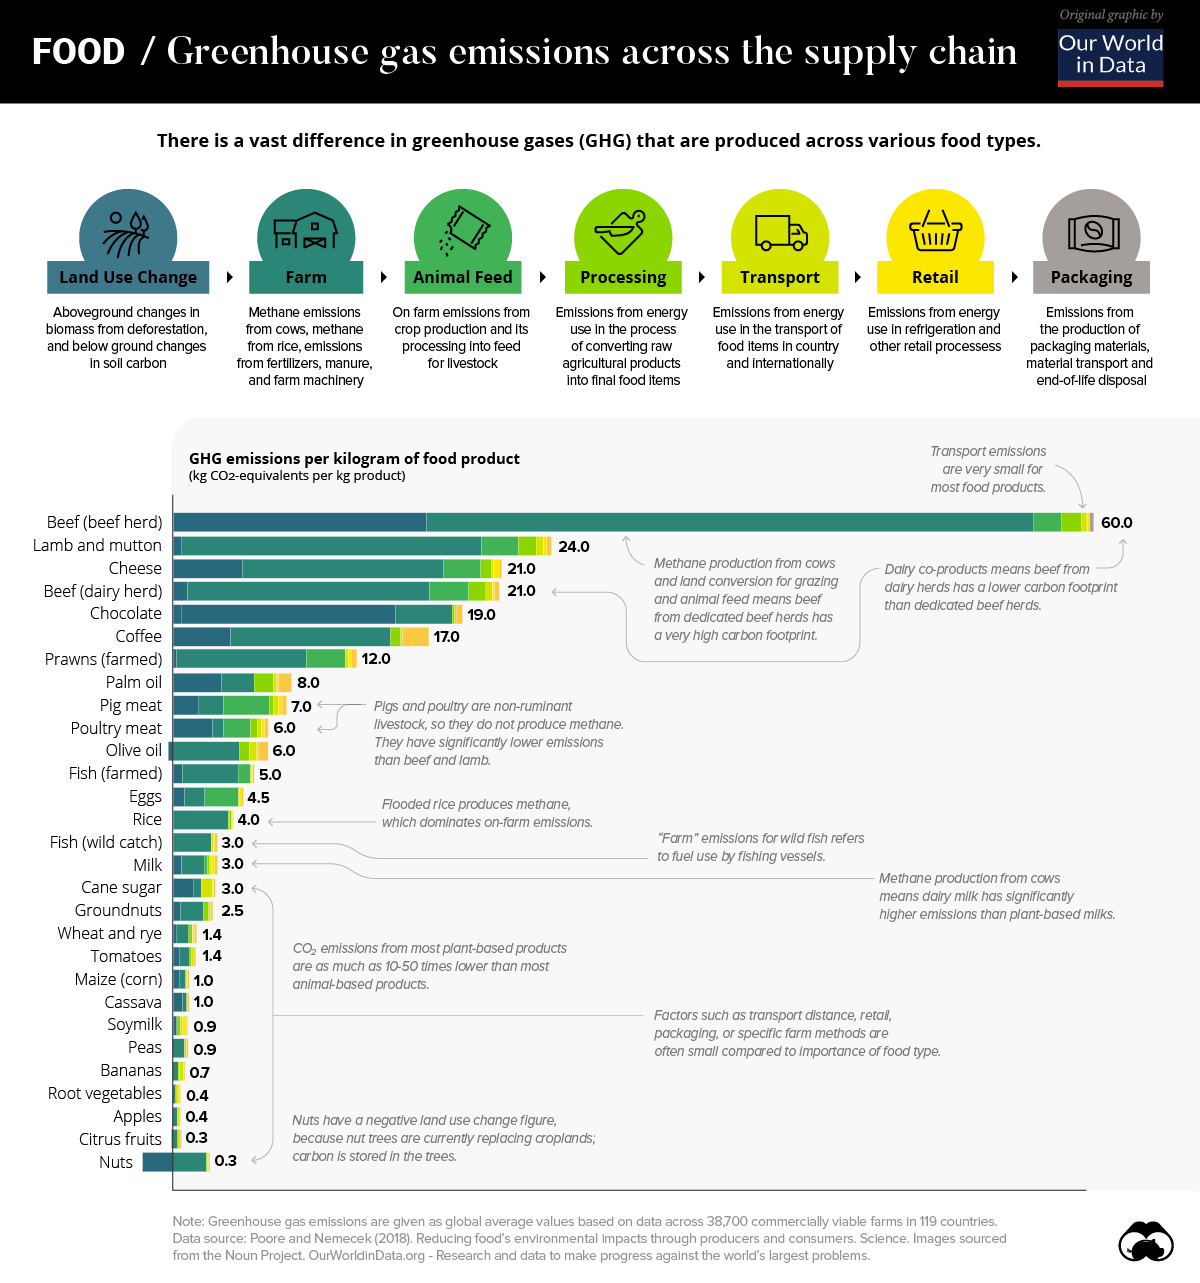
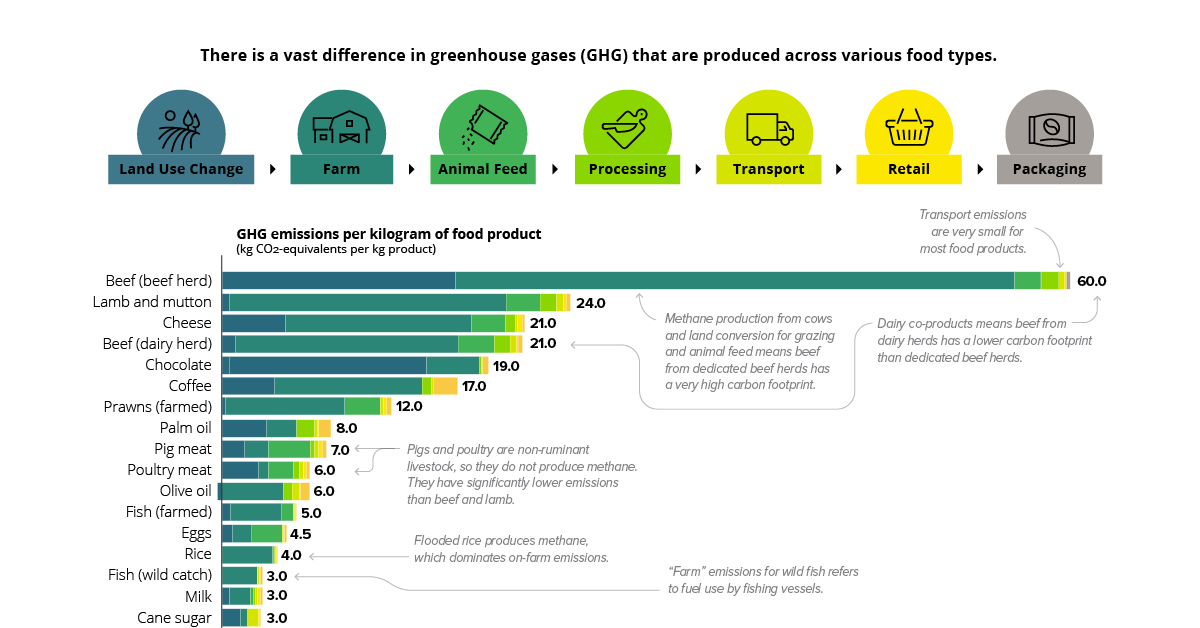
The quantity of greenhouse gases (GHGs) generated by our food can vary considerably across the global food supply chain.
In fact, the difference between specific food types can vary by orders of magnitude, meaning what we eat could be a significant factor impacting GHG emissions on the environment.
Today’s modified chart from Our World in Data relies on data from the largest meta-analysis of food systems in history. The study, published in Science was led by Joseph Poore and Thomas Nemecek to highlight the carbon footprint across different food types across the world.
The Foods With the Highest Carbon Footprint
Worldwide, there are approximately 13.7 billion metric tons of carbon dioxide equivalents (CO2e) emitted through the food supply chain per year.
Across a database extending through 119 countries and 38,000 commercial farms, the study found that, unsurprisingly, beef and other animal products have an outsize effect on emissions.
For example, one kilogram (kg) of beef results in 60 kg of GHG emissions—nearly 2.5x the closest food type, lamb and mutton. In contrast, the same weight of apples produce less than one kilogram of GHG emissions.
| Food Type | GHG Emissions per 1 kg Produced |
|---|---|
| Beef (beef herd) | 60 kgCO2e |
| Lamb & Mutton | 24 kgCO2e |
| Cheese | 21 kgCO2e |
| Beef (dairy herd) | 21 kgCO2e |
| Chocolate | 19 kgCO2e |
| Coffee | 17 kgCO2e |
| Prawns (farmed) | 12 kgCO2e |
| Palm Oil | 8 kgCO2e |
| Pig Meat | 7 kgCO2e |
| Poultry Meat | 6 kgCO2e |
| Olive Oil | 6 kgCO2e |
| Fish (farmed) | 5 kgCO2e |
| Eggs | 4.5 kgCO2e |
| Rice | 4 kgCO2e |
| Fish (wild catch) | 3 kgCO2e |
| Milk | 3 kgCO2e |
| Cane Sugar | 3 kgCO2e |
| Groundnuts | 2.5 kgCO2e |
| Wheat & Rye | 1.4 kgCO2e |
| Tomatoes | 1.4 kgCO2e |
| Maize (Corn) | 1.0 kgCO2e |
| Cassava | 1.0 kgCO2e |
| Soymilk | 0.9 kgCO2e |
| Peas | 0.9 kgCO2e |
| Bananas | 0.7 kgCO2e |
| Root Vegetables | 0.4 kgCO2e |
| Apples | 0.4 kgCO2e |
| Citrus Fruits | 0.3 kgCO2e |
| Nuts | 0.3 kgCO2e |
When it comes to plant-based foods, chocolate is among the highest GHG emitters. One kilogram of chocolate produces 19 kg of GHGs. On average, emissions from plant-based foods are 10 to 50 times lower than animal-based types.
Bottom line, it is clear that the spectrum of emissions differs significantly across each food type.
Food Supply Chain Stages
The food supply chain is complex and nuanced as it moves across each stage of the cycle.
Although the steps behind the supply chain for individual foods can vary considerably, each typically has seven stages:
- Land Use Change
- Farm
- Animal Feed
- Processing
- Transport
- Retail
- Packaging
Across all foods, the land use and farm stages of the supply chain account for 80% of GHG emissions. In beef production, for example, there are three key contributing factors to the carbon footprint at these stages: animal feed, land conversion, and methane production from cows. In the U.S., beef production accounts for 40% of total livestock-related land use domestically.
On the other end of the spectrum is transportation. This stage of the supply chain makes up 10% of total GHG emissions on average. When it comes to beef, the proportion of GHGs that transportation emits is even smaller, at just 0.5% of total emissions.
Contrary to popular belief, sourcing food locally may not help GHG emissions in a very significant way, especially in the case of foods with a large carbon footprint.
The Rise of Plant-Based Alternatives
Amid a growing market share of plant-based alternatives in markets around the world, the future of the food supply chain could undergo a significant transition.
For investors, this shift is already evident. Beyond Meat, a leading provider of meat substitutes, was one of the best performing stocks of 2019—gaining 202% after its IPO in May 2019.
As rising awareness about the environment becomes more prevalent, is it possible that growing meat consumption could be a thing of the past?


Green
Ranking the Top 15 Countries by Carbon Tax Revenue
This graphic highlights France and Canada as the global leaders when it comes to generating carbon tax revenue.


Top 15 Countries by Carbon Tax Revenue
This was originally posted on our Voronoi app. Download the app for free on iOS or Android and discover incredible data-driven charts from a variety of trusted sources.
Carbon taxes are designed to discourage CO2 emissions by increasing the cost of carbon-intensive activities and incentivizing the adoption of cleaner energy alternatives.
In this graphic we list the top 15 countries by carbon tax revenue as of 2022. The data is from the World Bank’s State and Trends of Carbon Pricing Report, published in April 2023.
France and Canada Lead in Global Carbon Tax Revenue
In 2022, the top 15 countries generated approximately $30 billion in revenue from carbon taxes.
France and Canada lead in this regard, accounting for over half of the total amount. Both countries have implemented comprehensive carbon pricing systems that cover a wide range of sectors, including transportation and industry, and they have set relatively high carbon tax rates.
| Country | Government revenue in 2022 ($ billions) |
|---|---|
| 🇫🇷 France | $8.9 |
| 🇨🇦 Canada | $7.8 |
| 🇸🇪 Sweden | $2.3 |
| 🇳🇴 Norway | $2.1 |
| 🇯🇵 Japan | $1.8 |
| 🇫🇮 Finland | $1.7 |
| 🇨🇭 Switzerland | $1.6 |
| 🇬🇧 United Kingdom | $0.9 |
| 🇮🇪 Ireland | $0.7 |
| 🇩🇰 Denmark | $0.5 |
| 🇵🇹 Portugal | $0.5 |
| 🇦🇷 Argentina | $0.3 |
| 🇲🇽 Mexico | $0.2 |
| 🇸🇬 Singapore | $0.1 |
| 🇿🇦 South Africa | $0.1 |
In Canada, the total carbon tax revenue includes both national and provincial taxes.
While carbon pricing has been recognized internationally as one of the more efficient mechanisms for reducing CO2 emissions, research is divided over what the global average carbon price should be to achieve the goals of the Paris Climate Agreement, which aims to limit global warming to 1.5–2°C by 2100 relative to pre-industrial levels.
A recent study has shown that carbon pricing must be supported by other policy measures and innovations. According to a report from Queen’s University, there is no feasible carbon pricing scenario that is high enough to limit emissions sufficiently to achieve anything below 2.4°C warming on its own.

-

 Technology2 weeks ago
Ranked: The Most Popular Smartphone Brands in the U.S.
-

 Automotive1 week ago
Almost Every EV Stock is Down After Q1 2024
-

 Money1 week ago
Where Does One U.S. Tax Dollar Go?
-

 Green2 weeks ago
Ranked: Top Countries by Total Forest Loss Since 2001
-

 Real Estate2 weeks ago
Visualizing America’s Shortage of Affordable Homes
-

 Maps2 weeks ago
Mapped: Average Wages Across Europe
-

 Mining2 weeks ago
Charted: The Value Gap Between the Gold Price and Gold Miners
-

 Demographics2 weeks ago
Visualizing the Size of the Global Senior Population