A Visual Guide to 5 Types of Climate Indexes
The following content is sponsored by MSCI.
A Visual Guide to 5 Types of Climate Indexes
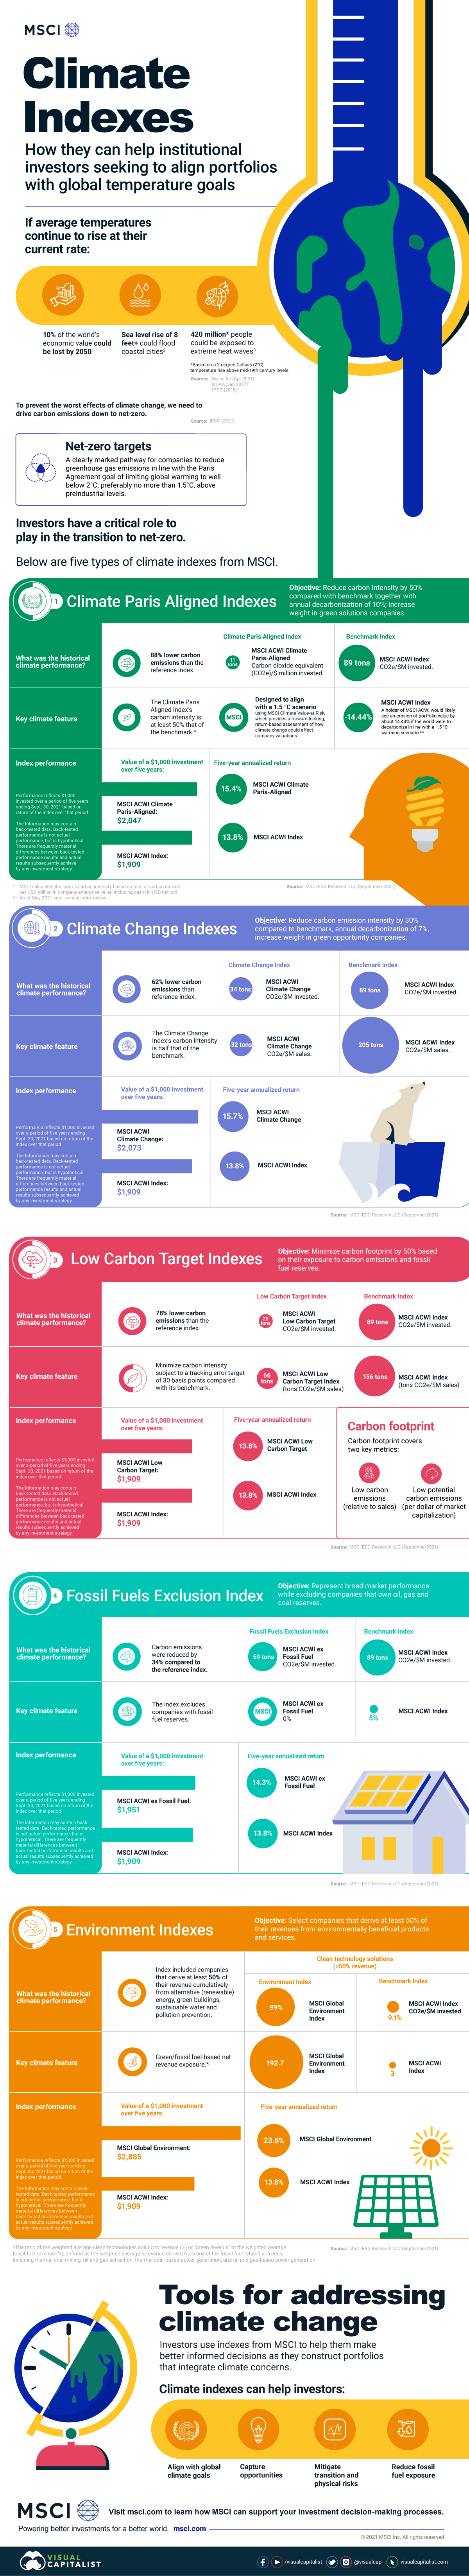
If average temperatures continue to rise at their current rate:
- 10% of the world’s economic value could be lost by 2050
- A sea level rise of over 8 feet could flood coastal cities
- 420 million people could be exposed to extreme heat waves
To prevent the worst effects of climate change, climate experts believe we need to drive carbon emissions down to net-zero.
This infographic from MSCI shows five climate indexes that can help align investor portfolios to the goals of the Paris Agreement, mitigate emissions, and reduce fossil fuel exposure.
What is Net-Zero?
Net-zero targets are a clearly marked pathway for companies to reduce greenhouse gas (GHG) emissions in line with the Paris Agreement.
The Paris Agreement’s goal is to limit global warming to well below 2°C, preferably no more than 1.5°C above pre-industrial levels. Investors have a critical role to play in this transition to net-zero.
5 Types of Climate Indexes
First, here are the key metrics used to assess the environmental profile of indexes:
- Carbon emissions: Based on tons of carbon dioxide across all constituents divided by millions of dollars invested in the index (tons CO2e/$M invested).
- Carbon intensity: Based on tons of carbon dioxide per $1 million in sales (tons CO2e/$M sales).
Let’s look at five types of climate indexes from MSCI:
1. Climate Paris Aligned Indexes
Objective: Reduce carbon intensity by 50% compared to benchmark, annual decarbonization of 10%, increase weight in green solutions companies.
The indexes have also shown strong performance on the Climate Value at Risk (Var) metric.
Climate Var provides a forward-looking return-based assessment of how climate change could affect company valuations. For instance, a holder of MSCI ACWI would likely see an erosion of portfolio value by about 14.44% if the world were to decarbonize in line with a 1.5°C warming scenario.
A holder of a Climate Paris Aligned Index, by contrast, would see little to no erosion in value.
| Metric | Description | Climate Paris Aligned Index | Benchmark Index |
|---|---|---|---|
| What was the historical climate performance? | 88% lower carbon emissions than the reference index | 11 tons CO2e/$ million invested | 89 tons CO2e/$ million invested |
| Key climate feature* | Climate Value at Risk (Var) | 0% | -14.44% |
| Index performance (Five-year annualized return as of Sep 30 2021) | Outperformed benchmark MSCI ACWI Index | 15.40% | 13.80% |
*As of May 2021 semi-annual index review
2. Climate Change Indexes
Objective: Reduce carbon emission intensity by 30% compared to benchmark, annual decarbonization of 7%, increase weight in green opportunity companies.
Green opportunity companies may include green bonds, companies with low carbon patents, or provide exposure to UN Sustainable Development Goals. These are companies which see opportunity from the climate transition.
| Metric | Description | Climate Change Index | Benchmark Index |
|---|---|---|---|
| What was the historical climate performance? | 62% lower carbon emissions than reference index | 34 tons CO2e/$M invested | 89 tons CO2e/$M invested |
| Key climate feature | Carbon intensity is at least 50% lower than that of the benchmark | 32 tons CO2e/$M sales | 205 tons CO2e/$M sales |
| Index performance (Five-year annualized return as of Sep 30 2021) | Outperformed benchmark MSCI ACWI Index | 15.70% | 13.80% |
3. Low Carbon Target Indexes
Objective: Minimize carbon footprint by 50% based on exposure to carbon emissions and fossil fuel reserves.
The carbon footprint covers two key metrics:
- Low carbon emissions (relative to sales)
- Low potential carbon emissions (per dollar of market capitalization)
| Metric | Description | Low Carbon Target Index | Benchmark Index |
|---|---|---|---|
| What was the historical climate performance? | 78% lower carbon emissions than the reference index | 20 tons CO2e/$M invested | 89 tons CO2e/$M invested |
| Key climate feature | Minimize carbon intensity | 66 tons CO2e/$M sales | 156 tons CO2e/$M sales |
| Index performance (Five-year annualized return as of Sep 30 2021) | Performed equally to MSCI ACWI Index benchmark | 13.80% | 13.80% |
4. Fossil Fuels Exclusion Index
Objective: Represent broad market performance while excluding companies that own oil, gas and coal reserves.
| Metric | Description | Fossil Fuels Exclusion Index | Benchmark Index |
|---|---|---|---|
| What was the historical climate performance? | Carbon emissions were reduced by 34% compared to the reference index | 59 tons CO2e/$M invested | 89 tons CO2e/$M invested |
| Key climate feature | Proportion of index invested in fossil fuel reserves | 0% | 5% |
| Index performance (Five-year annualized return as of Sep 30 2021) | Outperformed benchmark MSCI ACWI Index | 14.30% | 13.80% |
5. Environment Indexes
Objective: Select companies that derive at least 50% of their revenues from environmentally beneficial products and services.
The green to fossil fuel-based net revenue exposure compares revenues from green companies in relation to companies with revenues from fossil fuel. This can be used as a metric to assess the shift from fossil fuel-related activities to greener alternatives.
| Metric | Description | Environment Index | Benchmark Index |
|---|---|---|---|
| What was the historical climate performance? | Included companies that derive at least 50% of revenues from green energy* | 99% | 9.10% |
| Key climate feature | Green/fossil fuel-based net revenue exposure | 192.7 | 3 |
| Index performance (Five-year annualized return as of Sep 30 2021) | Outperformed benchmark MSCI ACWI Index | 23.60% | 13.80% |
*Cumulative measure across holdings, includes alternative (renewable) energy, green buildings, sustainable water and pollution prevention
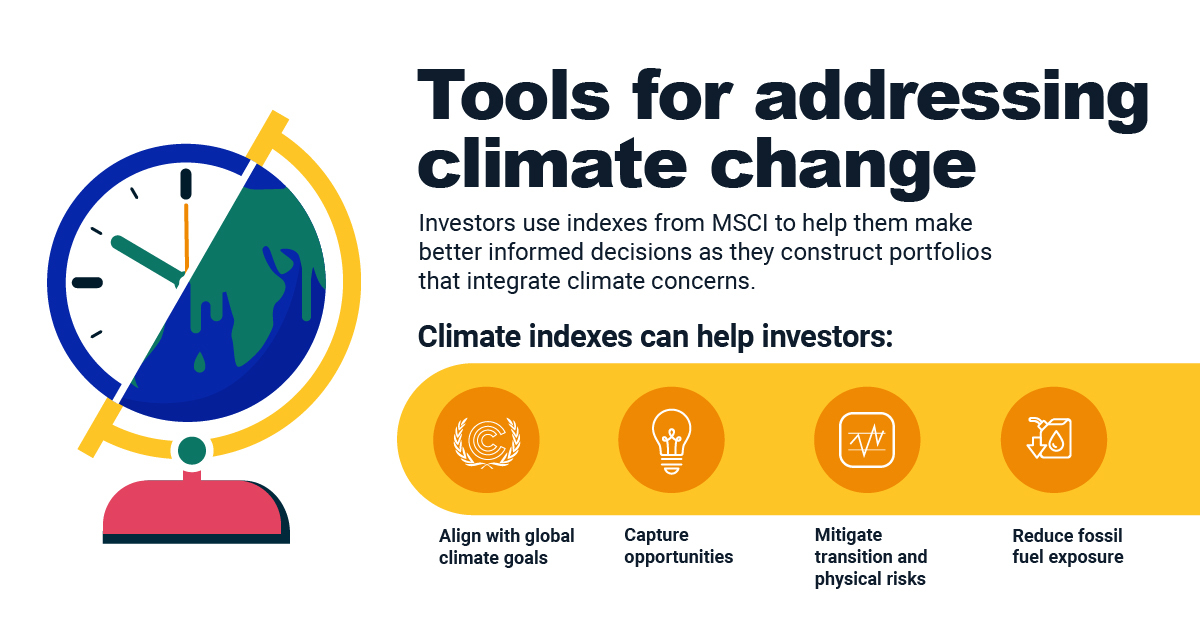
Climate Indexes: Tools for Addressing Climate Change
As investors integrate climate concerns in their portfolios, they can use indexes from MSCI to help make more informed decisions.
Climate indexes can help investors:
- Align with global climate goals
- Capture opportunities
- Mitigate transition and physical risks
- Reduce fossil fuel exposure
These climate tools can help investors with future investment strategies—and catalyze change.
-

 Sponsored3 years ago
More Than Precious: Silver’s Role in the New Energy Era (Part 3 of 3)
Long known as a precious metal, silver in solar and EV technologies will redefine its role and importance to a greener economy.
-
 Sponsored7 years ago
The History and Evolution of the Video Games Market
Everything from Pong to the rise of mobile gaming and AR/VR. Learn about the $100 billion video games market in this giant infographic.
-
 Sponsored8 years ago
The Extraordinary Raw Materials in an iPhone 6s
Over 700 million iPhones have now been sold, but the iPhone would not exist if it were not for the raw materials that make the technology...
-
 Sponsored8 years ago
The Industrial Internet, and How It’s Revolutionizing Mining
The convergence of the global industrial sector with big data and the internet of things, or the Industrial Internet, will revolutionize how mining works.
