Chart of the Week
War and Peace: How Violence is Disrupting the Global Economy


War and Peace: How Violence is Disrupting the Global Economy
Although you may not see it, millions of lives are disrupted by violence everyday.
War, homicide, terrorism, suicide, and sexual assault can be found across the world in various degrees. While certain types of violence can incur costs that result in personal traumas, violence can also create significant economic disruptions.
In today’s Chart of the Week, we visualize data estimates from the Global Peace Index 2019 on the global cost of violence, and its geographical spread.
How is Violence Linked to the Economy?
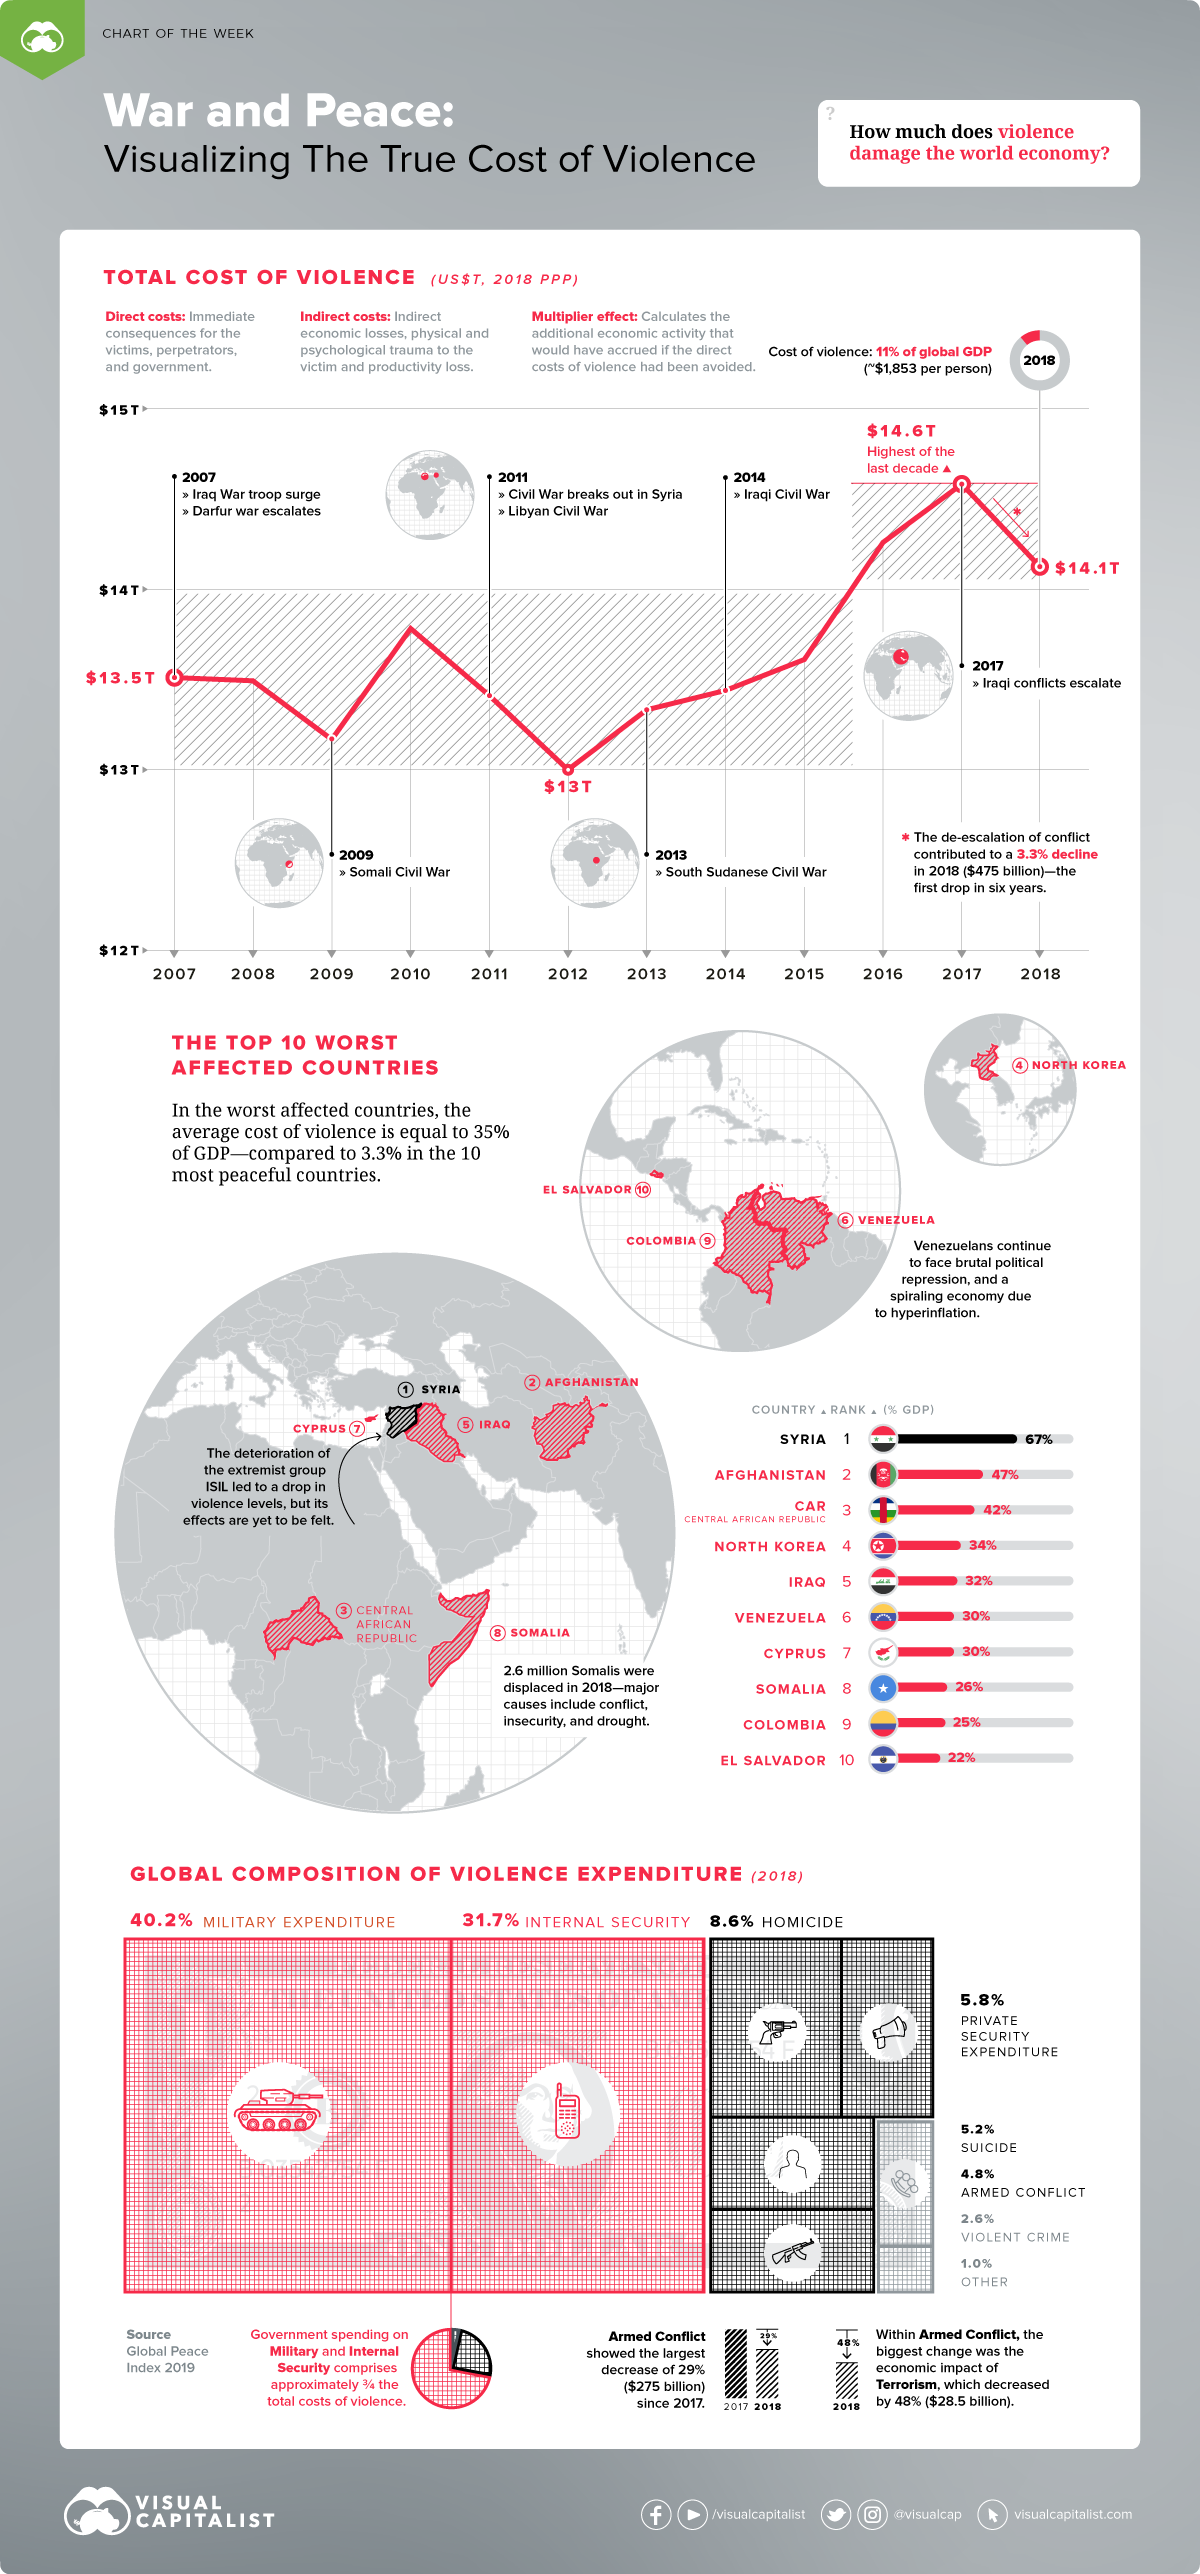
The Global Peace Index calculates the total cost of violence using purchasing power parity (PPP) by considering three factors:
- Direct costs: Immediate consequences to the victims, perpetrators and the government
- Indirect costs: Delayed economic losses following the violent event, including the after-effects of trauma experienced by the victim
- Multiplier effect: Calculates the additional economic activity that would have accrued if the direct costs of violence had been avoided.
Between 2012-2017, the cost of violence increased by 11% to $14.6 trillion—mainly due to rising violence in Syria, Libya, Yemen, and other parts of the Middle East and North Africa.
In 2018, the total cost of violence decreased for the first time in six years to $14.1 trillion. That’s the equivalent of 11.2% of global GDP (PPP), or $1,853 for every person.
In this one year, the $475 billion saved from decreased violence costs was largely due to lower levels of armed conflict in Syria, Ukraine, and Colombia.
The Top 10 Worst Affected Countries
It comes as no surprise that countries affected by conflict incur the greatest costs due to a higher than average death toll, and sizable military expenditures.
Here are the countries with the highest cost of violence according to the report:
| Rank | Country | Cost of violence (% of GDP) | ||||
|---|---|---|---|---|---|---|
| #1 | 🇸🇾 Syria | 67% | ||||
| #2 | 🇦🇫 Afghanistan | 47% | ||||
| #3 | 🇨🇫 Central African Republic | 42% | ||||
| #4 | 🇰🇵 North Korea | 34% | ||||
| #5 | 🇮🇶 Iraq | 32% | ||||
| #6 | 🇻🇪 Venezuela | 30% | ||||
| #7 | 🇨🇾 Cyprus | 30% | ||||
| #8 | 🇸🇴 Somalia | 26% | ||||
| #9 | 🇨🇴 Colombia | 25% | ||||
| #10 | 🇸🇻 El Salvador | 22% |
Since 2017, Venezuela has climbed the ranking and now sits in the top 10, due to continuing political repression and a spiraling economy as a result of hyperinflation.
The Global Composition of Violence
Government spending on military comprises 40% of the global total, or $5.7 trillion in constant purchasing power parity (PPP).
| Type of economic impact | Share of total | |||||
|---|---|---|---|---|---|---|
| Military expenditure | 40.2% | |||||
| Internal security expenditure | 31.7% | |||||
| Homicide | 8.6% | |||||
| Private security expenditure | 5.8% | |||||
| Suicide | 5.2% | |||||
| Armed conflict | 4.8% | |||||
| Violent crime | 2.6% | |||||
| Other | 1% |
Naturally, the types of violence costs vary by region, and the most noticeable difference is in military expenditure. It represents 59% of Middle East and North Africa’s violence costs—but only 8% for Central America and the Caribbean.
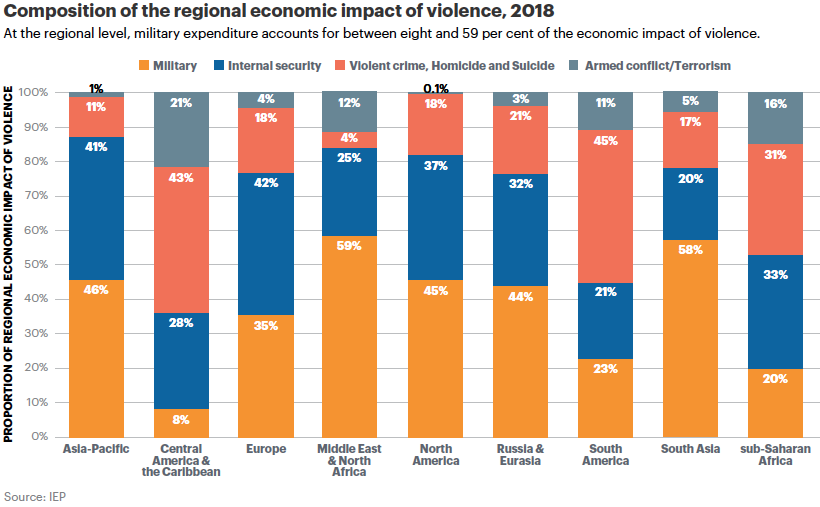
Interestingly, the Middle East and North Africa boast the lowest levels of violent crime, homicide, and suicide, representing only 4% of the total, compared to South America’s 45%.
Keeping the Peace
Despite today’s chart painting a picture of the world as a dangerous place, it is worth noting that there are two sides to this story.
Of the 163 countries ranked in the index, 86 countries improved their peace score in the last year, with Iceland retaining its number one position for over a decade. In fact, the country has not had any gun murders since the Global Peace Index began in 2007.
Is the recent drop in costs of violence a sign that we are moving towards a more peaceful planet, or just a blip on the radar?
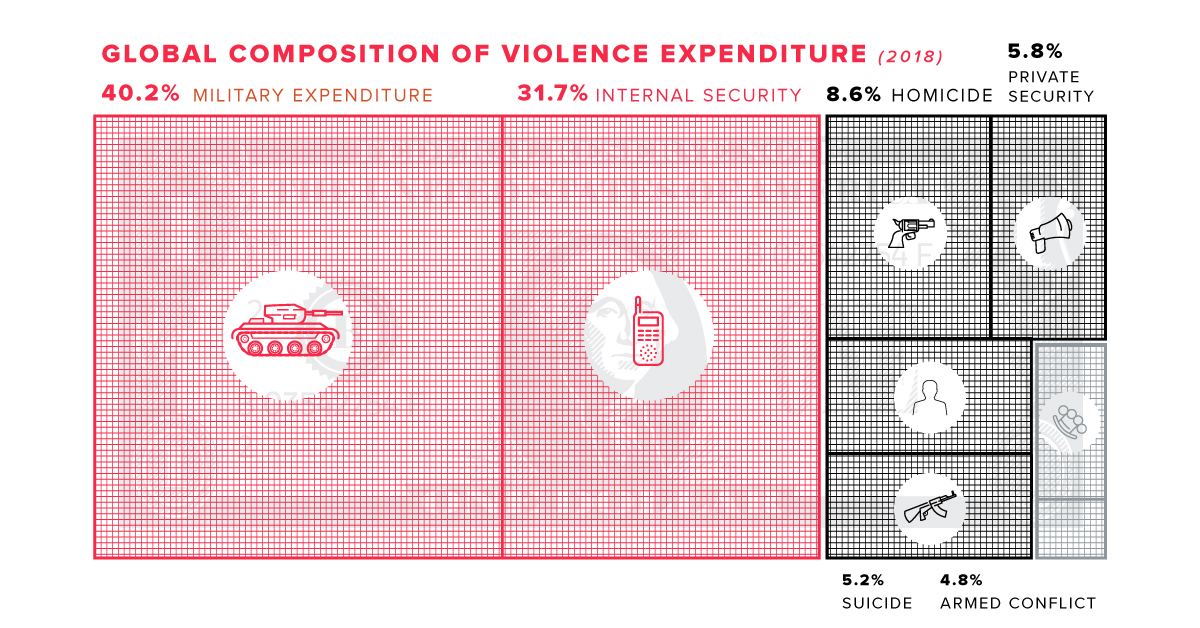

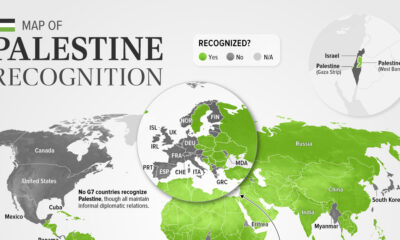


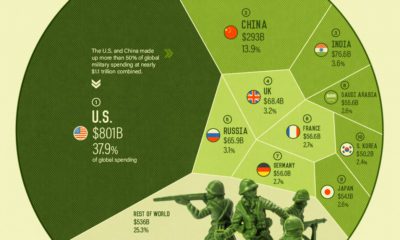

Chart of the Week
The Road to Recovery: Which Economies are Reopening?
We look at mobility rates as well as COVID-19 recovery rates for 41 economies, to see which countries are reopening for business.

The Road to Recovery: Which Economies are Reopening?
COVID-19 has brought the world to a halt—but after months of uncertainty, it seems that the situation is slowly taking a turn for the better.
Today’s chart measures the extent to which 41 major economies are reopening, by plotting two metrics for each country: the mobility rate and the COVID-19 recovery rate:
- Mobility Index
This refers to the change in activity around workplaces, subtracting activity around residences, measured as a percentage deviation from the baseline. - COVID-19 Recovery Rate
The number of recovered cases in a country is measured as the percentage of total cases.
Data for the first measure comes from Google’s COVID-19 Community Mobility Reports, which relies on aggregated, anonymous location history data from individuals. Note that China does not show up in the graphic as the government bans Google services.
COVID-19 recovery rates rely on values from CoronaTracker, using aggregated information from multiple global and governmental databases such as WHO and CDC.
Reopening Economies, One Step at a Time
In general, the higher the mobility rate, the more economic activity this signifies. In most cases, mobility rate also correlates with a higher rate of recovered people in the population.
Here’s how these countries fare based on the above metrics.
| Country | Mobility Rate | Recovery Rate | Total Cases | Total Recovered |
|---|---|---|---|---|
| Argentina | -56% | 31.40% | 14,702 | 4,617 |
| Australia | -41% | 92.03% | 7,150 | 6,580 |
| Austria | -100% | 91.93% | 16,628 | 15,286 |
| Belgium | -105% | 26.92% | 57,849 | 15,572 |
| Brazil | -48% | 44.02% | 438,812 | 193,181 |
| Canada | -67% | 52.91% | 88,512 | 46,831 |
| Chile | -110% | 41.58% | 86,943 | 36,150 |
| Colombia | -73% | 26.28% | 25,366 | 6,665 |
| Czechia | -29% | 70.68% | 9,140 | 6,460 |
| Denmark | -93% | 88.43% | 11,512 | 10,180 |
| Finland | -93% | 81.57% | 6,743 | 5,500 |
| France | -100% | 36.08% | 186,238 | 67,191 |
| Germany | -99% | 89.45% | 182,452 | 163,200 |
| Greece | -32% | 47.28% | 2,906 | 1,374 |
| Hong Kong | -10% | 97.00% | 1,067 | 1,035 |
| Hungary | -49% | 52.31% | 3,816 | 1,996 |
| India | -65% | 42.88% | 165,386 | 70,920 |
| Indonesia | -77% | 25.43% | 24,538 | 6,240 |
| Ireland | -79% | 88.92% | 24,841 | 22,089 |
| Israel | -31% | 87.00% | 16,872 | 14,679 |
| Italy | -52% | 64.99% | 231,732 | 150,604 |
| Japan | -33% | 84.80% | 16,683 | 14,147 |
| Malaysia | -53% | 80.86% | 7,629 | 6,169 |
| Mexico | -69% | 69.70% | 78,023 | 54,383 |
| Netherlands | -97% | 0.01% | 45,950 | 3 |
| New Zealand | -21% | 98.01% | 1,504 | 1,474 |
| Norway | -100% | 91.87% | 8,411 | 7,727 |
| Philippines | -87% | 23.08% | 15,588 | 3,598 |
| Poland | -36% | 46.27% | 22,825 | 10,560 |
| Portugal | -65% | 58.99% | 31,596 | 18,637 |
| Singapore | -105% | 55.02% | 33,249 | 18,294 |
| South Africa | -74% | 52.44% | 27,403 | 14,370 |
| South Korea | -4% | 91.15% | 11,344 | 10,340 |
| Spain | -67% | 69.11% | 284,986 | 196,958 |
| Sweden | -93% | 13.91% | 35,727 | 4,971 |
| Switzerland | -101% | 91.90% | 30,796 | 28,300 |
| Taiwan | 4% | 95.24% | 441 | 420 |
| Thailand | -36% | 96.08% | 3,065 | 2,945 |
| U.S. | -56% | 28.20% | 1,768,346 | 498,720 |
| United Kingdom | -82% | 0.05% | 269,127 | 135 |
| Vietnam | 15% | 85.02% | 327 | 278 |
Mobility data as of May 21, 2020 (Latest available). COVID-19 case data as of May 29, 2020.
In the main scatterplot visualization, we’ve taken things a step further, assigning these countries into four distinct quadrants:
1. High Mobility, High Recovery
High recovery rates are resulting in lifted restrictions for countries in this quadrant, and people are steadily returning to work.
New Zealand has earned praise for its early and effective pandemic response, allowing it to curtail the total number of cases. This has resulted in a 98% recovery rate, the highest of all countries. After almost 50 days of lockdown, the government is recommending a flexible four-day work week to boost the economy back up.
2. High Mobility, Low Recovery
Despite low COVID-19 related recoveries, mobility rates of countries in this quadrant remain higher than average. Some countries have loosened lockdown measures, while others did not have strict measures in place to begin with.
Brazil is an interesting case study to consider here. After deferring lockdown decisions to state and local levels, the country is now averaging the highest number of daily cases out of any country. On May 28th, for example, the country had 24,151 new cases and 1,067 new deaths.
3. Low Mobility, High Recovery
Countries in this quadrant are playing it safe, and holding off on reopening their economies until the population has fully recovered.
Italy, the once-epicenter for the crisis in Europe is understandably wary of cases rising back up to critical levels. As a result, it has opted to keep its activity to a minimum to try and boost the 65% recovery rate, even as it slowly emerges from over 10 weeks of lockdown.
4. Low Mobility, Low Recovery
Last but not least, people in these countries are cautiously remaining indoors as their governments continue to work on crisis response.
With a low 0.05% recovery rate, the United Kingdom has no immediate plans to reopen. A two-week lag time in reporting discharged patients from NHS services may also be contributing to this low number. Although new cases are leveling off, the country has the highest coronavirus-caused death toll across Europe.
The U.S. also sits in this quadrant with over 1.7 million cases and counting. Recently, some states have opted to ease restrictions on social and business activity, which could potentially result in case numbers climbing back up.
Over in Sweden, a controversial herd immunity strategy meant that the country continued business as usual amid the rest of Europe’s heightened regulations. Sweden’s COVID-19 recovery rate sits at only 13.9%, and the country’s -93% mobility rate implies that people have been taking their own precautions.
COVID-19’s Impact on the Future
It’s important to note that a “second wave” of new cases could upend plans to reopen economies. As countries reckon with these competing risks of health and economic activity, there is no clear answer around the right path to take.
COVID-19 is a catalyst for an entirely different future, but interestingly, it’s one that has been in the works for a while.
Without being melodramatic, COVID-19 is like the last nail in the coffin of globalization…The 2008-2009 crisis gave globalization a big hit, as did Brexit, as did the U.S.-China trade war, but COVID is taking it to a new level.
—Carmen Reinhart, incoming Chief Economist for the World Bank
Will there be any chance of returning to “normal” as we know it?

-

 Green2 weeks ago
Ranked: Top Countries by Total Forest Loss Since 2001
-

 Travel1 week ago
Ranked: The World’s Top Flight Routes, by Revenue
-

 Technology1 week ago
Ranked: Semiconductor Companies by Industry Revenue Share
-

 Money2 weeks ago
Which States Have the Highest Minimum Wage in America?
-

 Real Estate2 weeks ago
Ranked: The Most Valuable Housing Markets in America
-

 Markets2 weeks ago
Charted: Big Four Market Share by S&P 500 Audits
-

 AI2 weeks ago
The Stock Performance of U.S. Chipmakers So Far in 2024
-

 Automotive2 weeks ago
Almost Every EV Stock is Down After Q1 2024