Economy
Visualized: The Value of U.S. Imports of Goods by State
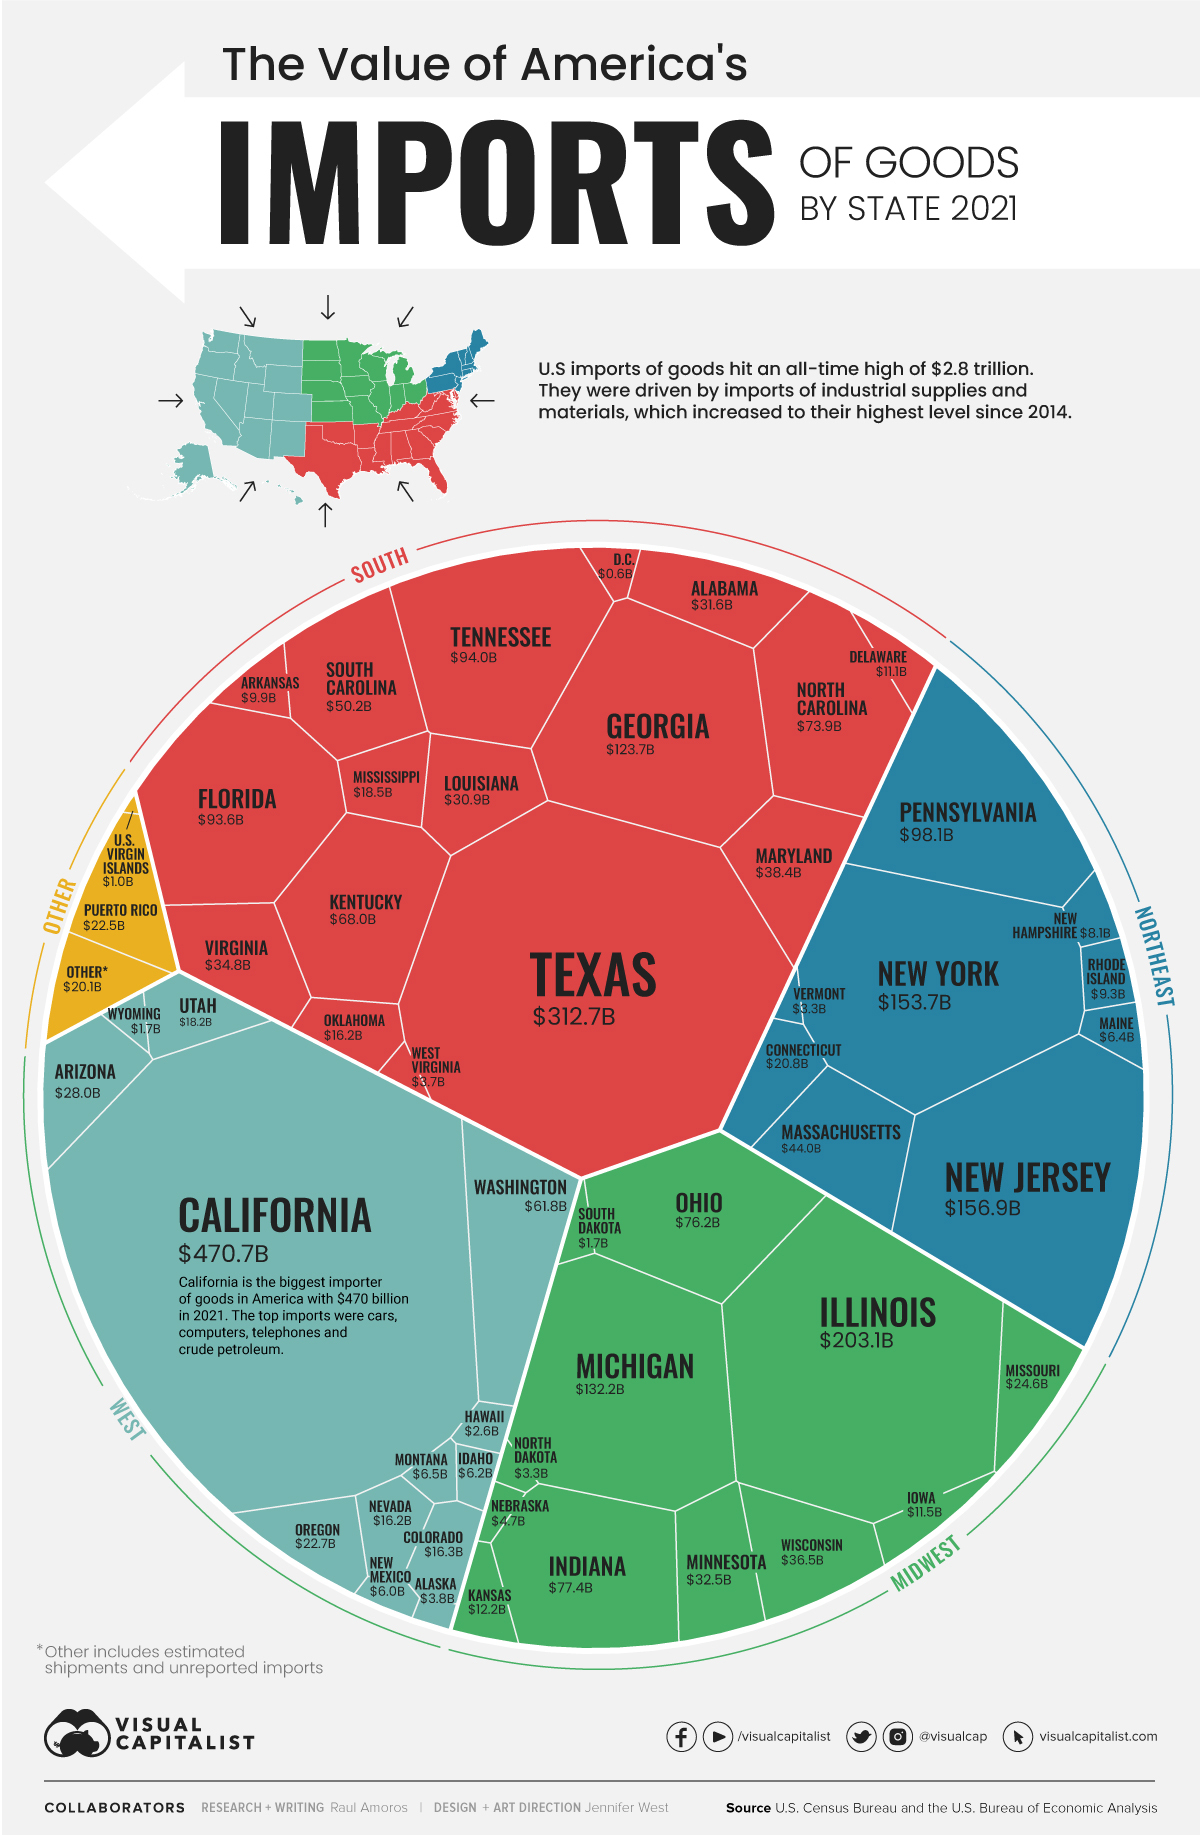
Visualized: The Value of U.S. Imports of Goods by State 2021
For nearly 50 years and counting, U.S. imports have exceeded exports—and 2021 was no exception. Imports of goods to the U.S. equaled $2.8 trillion, relative to $1.8 trillion for exports, putting the 2021 goods trade deficit at its highest level on record.
Using the most recent data on global trade from the U.S. Census Bureau and the U.S. Bureau of Economic Analysis, we take a closer look at the value of American goods imports and visualize them state by state.
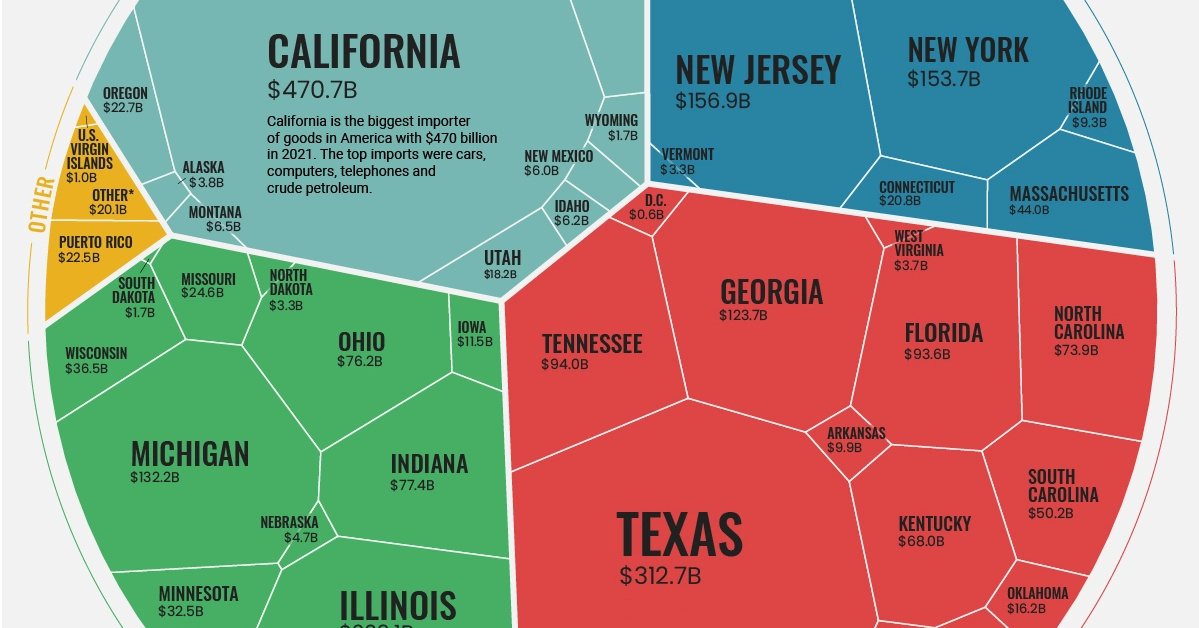
The Top 10 Importing States, by Total Goods Value
The top 10 states by import value account for 64.5% of all U.S. imports, or $1.8 trillion.
| Rank | State | Import Value ($B) | Share (%) |
|---|---|---|---|
| #1 | California | $470.7 | 16.5% |
| #2 | Texas | $312.6 | 11.0% |
| #3 | Illinois | $203.1 | 7.1% |
| #4 | New Jersey | $156.9 | 5.5% |
| #5 | New York | $153.7 | 5.4% |
| #6 | Michigan | $132.2 | 4.6% |
| #7 | Georgia | $123.7 | 4.3% |
| #8 | Pennsylvania | $98.1 | 3.4% |
| #9 | Tennessee | $94.0 | 3.3% |
| #10 | Florida | $93.6 | 3.3% |
| Top 10 States | $1,838.6 | 64.5% |
Overall, the goods trade deficit—the amount by which a country’s imports exceed its exports—was more than $1 trillion in 2021, increasing over 18% from the previous year. Goods imports specifically increased by nearly $502 billion, a 21% increase year-over-year.
California, the U.S.’s top importer, saw over $470 billion worth of goods come in last year. Some of its big ticket items fell in line with the state’s tech sector’s needs, like automatic data processing machines and accessories and parts for said machinery. California’s own deficit is quite high—the state’s goods exports were only valued at approximately $175 billion. The state’s busy ports are a key entry point for goods arriving from Asia, which helps explain this deficit.
In contrast, the country’s top export state is Texas at $375 billion, outweighing its imports and shipping out goods like coal and petroleum. All but three of the country’s top importers—Tennessee, Pennsylvania, and Georgia—were also among the country’s top 10 exporters.
Where are Imports Coming From?
Here’s a look at the country’s top trade partners for goods imports and the value of their imports in 2022 as of April.
| Rank | Country | Import Value ($B) as of April '22 | Share of Total |
|---|---|---|---|
| #1 | 🇨🇳 China | $179.3 | 17.0% |
| #2 | 🇲🇽 Mexico | $145.1 | 13.8% |
| #3 | 🇨🇦 Canada | $141.7 | 13.5% |
| #4 | 🇯🇵 Japan | $49.6 | 4.7% |
| #5 | 🇩🇪 Germany | $44.2 | 4.2% |
| #6 | 🇻🇳 Vietnam | $40.5 | 3.8% |
| #7 | 🇰🇷 South Korea | $36.5 | 3.5% |
| #8 | 🇹🇼 Taiwan | $29.6 | 2.8% |
| #9 | 🇮🇳 India | $27.5 | 2.6% |
| #10 | 🇮🇪 Ireland | $26.5 | 2.5% |
Over half of the top import partners for the United States are located in Asia. China is by far America’s top source of goods, making up 17% of the country’s imports.
Meanwhile, Canada and Mexico each account for roughly 14% of America’s goods imports due to the close proximity, strong economic ties, and trade agreements.
What’s Being Imported?
Imports of goods increased to a value of $2.8 trillion in 2021, the highest on record. According to the U.S. Census Bureau, industrial supplies and materials and crude oil saw some of the most notable increases.
Consumer goods like cell phones, household goods, toys, games, and sporting equipment increased in import value as well, reflecting a trend that the pandemic’s online shopping and delivery demand started.
Additionally, imports of foods, feeds, and beverages were the highest on record in 2021. It is also notable that in April of 2022, exports of goods hit the highest number on record at nearly $175 billion, with exports of feeds, food, and beverage also reaching the highest number of exports recorded. This is likely attributed to food shortages worldwide caused by the war in Ukraine.


Copper
Brass Rods: The Secure Choice
This graphic shows why brass rods are the secure choice for precision-machined and forged parts.


Brass Rods: The Secure Choice
The unique combination of machinability and recyclability makes brass rods the secure choice for manufacturers seeking future-proof raw material solutions.
This infographic, from the Copper Development Association, shows three ways brass rods give manufacturers greater control and a license to grow in the competitive market for precision-machined and forged products.
Future-Proof Investments in New Machine Tools
A material’s machinability directly impacts machine throughput, which typically has the largest impact on machine shop profitability.
The high-speed machining capabilities of brass rods maximize machine tool performance, allowing manufacturers to run the material faster and longer without sacrificing tool life, chip formation, or surface quality.
The high machining efficiency of brass leads to reduced per-part costs, quicker return on investment (ROI) for new machine tools, and expanded production capacity for new projects.
Supply Security Through Closed Loop Recycling
Brass, like its parent element copper, can be infinitely recycled.
In 2022, brass- and wire-rod mills accounted for the majority of the 830,000 tonnes of copper recycled from scrap in the United States.
Given that scrap ratios for machined parts typically range from 60-70% by weight, producing mills benefit from a secure and steady supply of clean scrap returned directly from customers, which is recycled to create new brass rods.
The high residual value of brass scrap creates a strong recycling incentive. Scrap buy back programs give manufacturers greater control over raw material net costs as scrap value is often factored into supplier purchase agreements.
Next Generation Alloys for a Lead-Free Future
Increasingly stringent global regulations continue to pressure manufacturers to minimize the use of materials containing trace amounts of lead and other harmful impurities.
The latest generation of brass-rod alloys is engineered to meet the most demanding criteria for lead leaching in drinking water and other sensitive applications.
Seven brass-rod alloys passed rigorous testing to become the only ‘Acceptable Materials’ against lower lead leaching criteria recently adopted in the national U.S. drinking water quality standard, NSF 61.
Learn more about the advantages of brass rods solutions.

-

 Base Metals1 year ago
Ranked: The World’s Largest Copper Producers
Many new technologies critical to the energy transition rely on copper. Here are the world’s largest copper producers.
-

 Silver2 years ago
Mapped: Solar Power by Country in 2021
In 2020, solar power saw its largest-ever annual capacity expansion at 127 gigawatts. Here’s a snapshot of solar power capacity by country.
-

 Batteries5 years ago
Visualizing Copper’s Role in the Transition to Clean Energy
A clean energy transition is underway as wind, solar, and batteries take center stage. Here’s how copper plays the critical role in these technologies.
-

 Science5 years ago
Everything You Need to Know on VMS Deposits
Deep below the ocean’s waves, VMS deposits spew out massive amounts of minerals like copper, zinc, and gold, making them a key source of the metals…
-
 Copper5 years ago
How Much Copper is in an Electric Vehicle?
Have you ever wondered how much copper is in an electric vehicle? This infographic shows the metal’s properties as well as the quantity of copper used.
-
 Copper6 years ago
Copper: Driving the Green Energy Revolution
Renewable energy is set to fuel a new era of copper demand – here’s how much copper is used in green applications from EVs to photovoltaics.


-

 Maps1 week ago
The Largest Earthquakes in the New York Area (1970-2024)
-

 Money2 weeks ago
Where Does One U.S. Tax Dollar Go?
-

 Automotive2 weeks ago
Almost Every EV Stock is Down After Q1 2024
-

 AI2 weeks ago
The Stock Performance of U.S. Chipmakers So Far in 2024
-

 Markets2 weeks ago
Charted: Big Four Market Share by S&P 500 Audits
-

 Real Estate2 weeks ago
Ranked: The Most Valuable Housing Markets in America
-

 Money2 weeks ago
Which States Have the Highest Minimum Wage in America?
-

 AI2 weeks ago
Ranked: Semiconductor Companies by Industry Revenue Share