Technology
USA vs. Canada: Which Country is the Most Innovative? [Chart]
![USA vs. Canada: Which is the Most Innovative Country? [Chart]](https://www.visualcapitalist.com/wp-content/uploads/2015/09/united-states-canada-innovation-chart.jpg)
USA vs. Canada: Which is the Most Innovative Country? [Chart]
The Chart of the Week is a weekly Visual Capitalist feature on Fridays.
This week, an in-depth report on global innovation was co-released by Cornell University, INSEAD, and the World Intellectual Property Organization. The 2015 version of the report is not for the faint of heart: it clocks in at 453 pages long and covers a total of 141 countries that make up 98.6% of global GDP.
The methodology of the report uses innovation inputs and outputs to create an overall Global Innovation Index with a score for each country. Inputs include factors such as institutions, human capital, infrastructure, market sophistication, and business sophistication. Outputs deal with actual innovation results such as knowledge, technology, and creative outputs.
Lastly, there is also a curious measure which divides outputs by inputs to find an “efficiency” factor: in other words, which countries are getting the most bang for their buck in terms of innovation.
Global Innovation Index Framework:
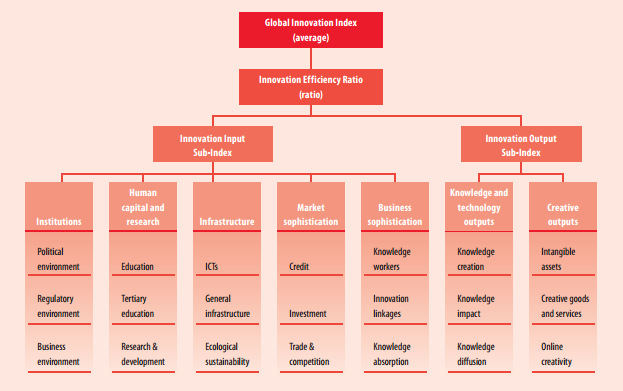
The data is quite granular, and each innovation score is based on 79 variables. Rather than comparing all countries together, we decided to look at Canada and the United States to see which of the 49th parallel neighbors is the most innovative country. If you’d prefer to read an executive summary of the report itself, there is an abstract here that includes more analysis on other countries such as Switzerland and the United Kingdom, which came in first and second place respectively in the overall rankings.
USA vs. Canada
Many of the wealthy countries in the report, including Canada and the United States, have a quality set of inputs for innovation: world-class universities, fair regulatory environments, sophisticated economies, and strong knowledge workers.
However, the report shows a few big differences specifically between Canada and the United States that are worth noting.
Firstly, the “quality of innovation” in the United States is higher. University performance, the reach of scholarly articles, the international dimension of patent applications, and other such measures have the USA as the top place within the entire high-income group, followed by countries such as the UK, Japan, Germany, and Switzerland.
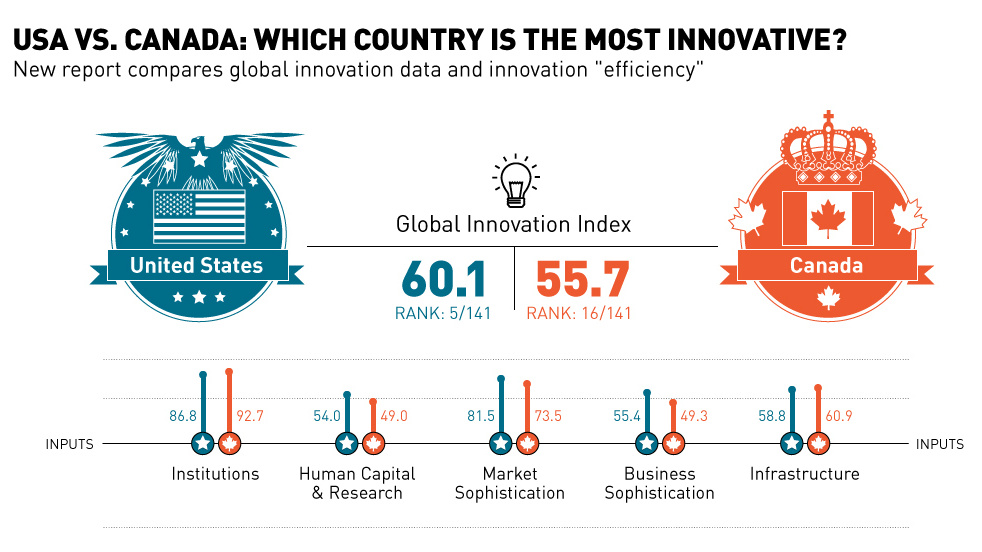
This helps the United States get a better score than Canada in terms of Knowledge and Technology Outputs, which make up half of the formula for the overall index. The United States scores a 58.0 on those outputs, while Canada scores 41.9.
Next, the United States holds the top position globally in measures concerning Market Sophistication, which gives it a score of 81.5 compared to Canada’s 73.5 in that category. Canada almost makes up for this with its strong institutions. In terms of Business Environment (a sub-category to “Institutions”) Canada has the best ranking in the world. However, the United States has strong institutions as well, and the difference here is only 5.9 points.
Lastly, Canada’s score was impacted by its weakness in the Human Capital and Research category, where it dropped from 13th to 22nd in ranking since the previous year’s report. This weakness is described by the authors as being linked to “government spending on secondary education per pupil, where [Canada] ranks 65th”.


Technology
Ranked: Semiconductor Companies by Industry Revenue Share
Nvidia is coming for Intel’s crown. Samsung is losing ground. AI is transforming the space. We break down revenue for semiconductor companies.


Semiconductor Companies by Industry Revenue Share
This was originally posted on our Voronoi app. Download the app for free on Apple or Android and discover incredible data-driven charts from a variety of trusted sources.
Did you know that some computer chips are now retailing for the price of a new BMW?
As computers invade nearly every sphere of life, so too have the chips that power them, raising the revenues of the businesses dedicated to designing them.
But how did various chipmakers measure against each other last year?
We rank the biggest semiconductor companies by their percentage share of the industry’s revenues in 2023, using data from Omdia research.
Which Chip Company Made the Most Money in 2023?
Market leader and industry-defining veteran Intel still holds the crown for the most revenue in the sector, crossing $50 billion in 2023, or 10% of the broader industry’s topline.
All is not well at Intel, however, with the company’s stock price down over 20% year-to-date after it revealed billion-dollar losses in its foundry business.
| Rank | Company | 2023 Revenue | % of Industry Revenue |
|---|---|---|---|
| 1 | Intel | $51B | 9.4% |
| 2 | NVIDIA | $49B | 9.0% |
| 3 | Samsung Electronics | $44B | 8.1% |
| 4 | Qualcomm | $31B | 5.7% |
| 5 | Broadcom | $28B | 5.2% |
| 6 | SK Hynix | $24B | 4.4% |
| 7 | AMD | $22B | 4.1% |
| 8 | Apple | $19B | 3.4% |
| 9 | Infineon Tech | $17B | 3.2% |
| 10 | STMicroelectronics | $17B | 3.2% |
| 11 | Texas Instruments | $17B | 3.1% |
| 12 | Micron Technology | $16B | 2.9% |
| 13 | MediaTek | $14B | 2.6% |
| 14 | NXP | $13B | 2.4% |
| 15 | Analog Devices | $12B | 2.2% |
| 16 | Renesas Electronics Corporation | $11B | 1.9% |
| 17 | Sony Semiconductor Solutions Corporation | $10B | 1.9% |
| 18 | Microchip Technology | $8B | 1.5% |
| 19 | Onsemi | $8B | 1.4% |
| 20 | KIOXIA Corporation | $7B | 1.3% |
| N/A | Others | $126B | 23.2% |
| N/A | Total | $545B | 100% |
Note: Figures are rounded. Totals and percentages may not sum to 100.
Meanwhile, Nvidia is very close to overtaking Intel, after declaring $49 billion of topline revenue for 2023. This is more than double its 2022 revenue ($21 billion), increasing its share of industry revenues to 9%.
Nvidia’s meteoric rise has gotten a huge thumbs-up from investors. It became a trillion dollar stock last year, and broke the single-day gain record for market capitalization this year.
Other chipmakers haven’t been as successful. Out of the top 20 semiconductor companies by revenue, 12 did not match their 2022 revenues, including big names like Intel, Samsung, and AMD.
The Many Different Types of Chipmakers
All of these companies may belong to the same industry, but they don’t focus on the same niche.
According to Investopedia, there are four major types of chips, depending on their functionality: microprocessors, memory chips, standard chips, and complex systems on a chip.
Nvidia’s core business was once GPUs for computers (graphics processing units), but in recent years this has drastically shifted towards microprocessors for analytics and AI.
These specialized chips seem to be where the majority of growth is occurring within the sector. For example, companies that are largely in the memory segment—Samsung, SK Hynix, and Micron Technology—saw peak revenues in the mid-2010s.

-

 Green2 weeks ago
Ranked: Top Countries by Total Forest Loss Since 2001
-

 Travel1 week ago
Ranked: The World’s Top Flight Routes, by Revenue
-

 Technology1 week ago
Ranked: Semiconductor Companies by Industry Revenue Share
-

 Money2 weeks ago
Which States Have the Highest Minimum Wage in America?
-

 Real Estate2 weeks ago
Ranked: The Most Valuable Housing Markets in America
-

 Markets2 weeks ago
Charted: Big Four Market Share by S&P 500 Audits
-

 AI2 weeks ago
The Stock Performance of U.S. Chipmakers So Far in 2024
-

 Automotive2 weeks ago
Almost Every EV Stock is Down After Q1 2024