Economy
The U.S. States with the Top Tech Salaries in 2021
The U.S. States with the Top Tech Salaries in 2021
In 2020, despite the economic turmoil caused by the global pandemic, America’s tech sector experienced rapid growth. Last year, the total number of U.S. tech jobs grew by 60,000.
Because of this demand, U.S. employers are willing to pay for the right talent—on average, tech workers in the U.S. earn about 61% more than the average salary. But some tech workers make more than others, depending on where they live.
This graphic by business.org uses data from the Bureau of Labor Statistics (BLS) to highlight the average annual tech salaries in each state, compared to the average salary of other occupations. We’ll also touch on the top-paying metro areas, and what type of tech jobs offer the highest compensation across the country.
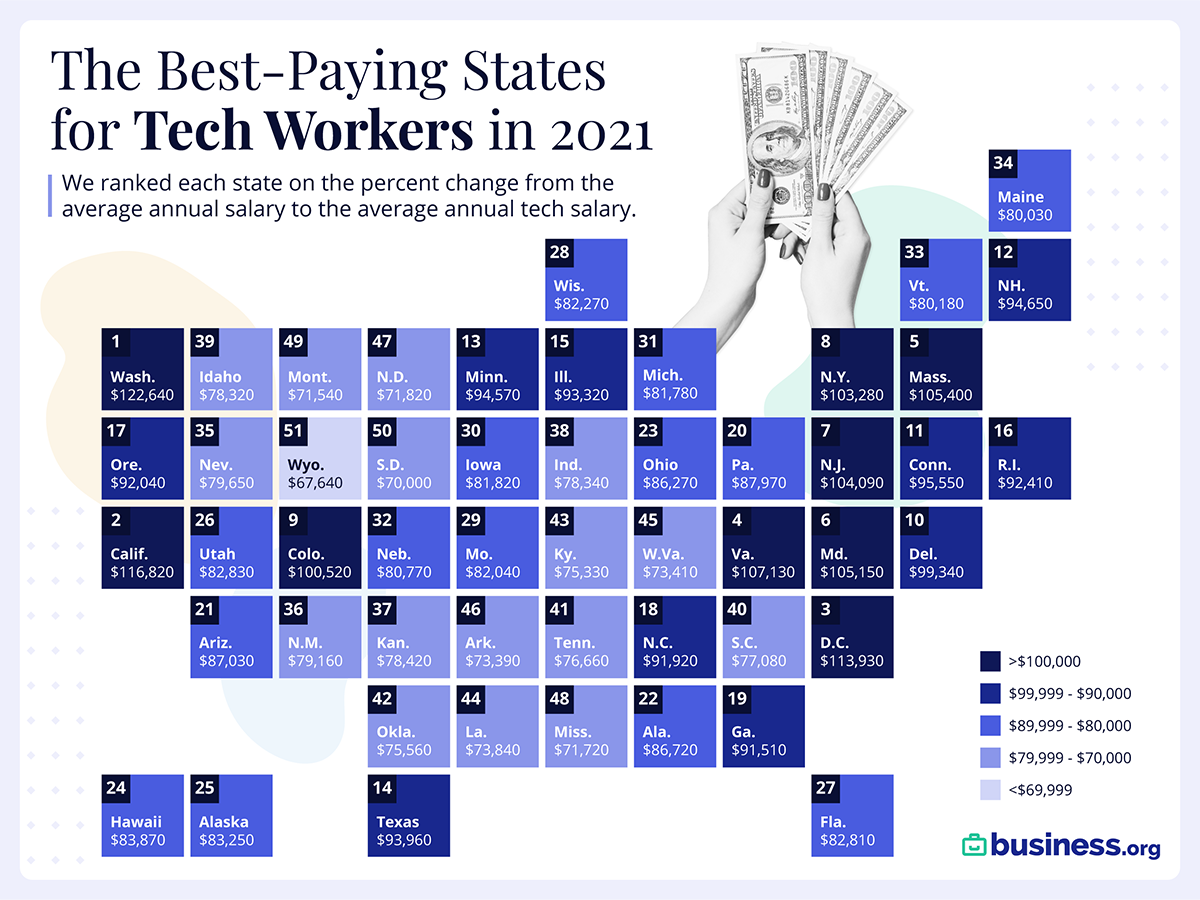
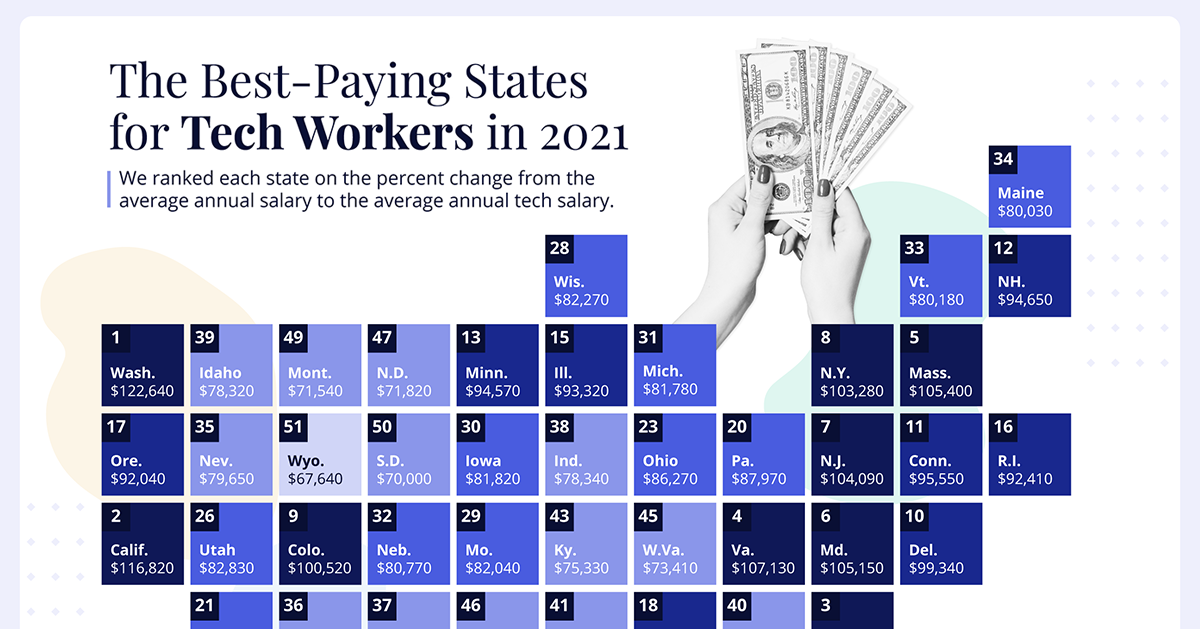
Average U.S. Tech Salaries by State
Perhaps unsurprisingly, Washington and California have the highest average salaries, largely because of the high job density in those areas.
However, when it comes to the difference in tech salary versus average salary, Alabama takes the top spot—on average, tech jobs pay 85% more than other occupations in that state.
| Rank | State | Average hourly wage for tech workers | Average salary for tech workers | % more that tech workers earn than all occupations |
|---|---|---|---|---|
| 1 | Alabama | $41.69 | $86,720 | 85% |
| 2 | Washington | $58.96 | $122,640 | 83% |
| 3 | North Carolina | $44.19 | $91,920 | 80% |
| 4 | Texas | $45.04 | $93,690 | 79% |
| 5 | Virginia | $51.50 | $107,130 | 78% |
| 6 | California | $56.16 | $116,820 | 78% |
| 7 | Georgia | $44.00 | $91,510 | 76% |
| 8 | Delaware | $47.76 | $99,340 | 75% |
| 9 | Mississippi | $34.48 | $71,720 | 72% |
| 10 | Ohio | $41.48 | $86,270 | 67% |
| 11 | Idaho | $37.65 | $78,320 | 67% |
| 12 | New Hampshire | $45.50 | $94,650 | 67% |
| 13 | South Carolina | $37.06 | $77,080 | 67% |
| 14 | Iowa | $39.34 | $81,820 | 66% |
| 15 | Florida | $39.81 | $82,810 | 66% |
| 16 | Maryland | $50.55 | $105,150 | 65% |
| 17 | Colorado | $48.33 | $100,520 | 65% |
| 18 | Arkansas | $35.28 | $73,390 | 64% |
| 19 | Kentucky | $36.21 | $75,330 | 64% |
| 20 | Missouri | $39.44 | $82,040 | 64% |
| 21 | New Jersey | $50.04 | $104,090 | 63% |
| 22 | Pennsylvania | $42.29 | $87,970 | 63% |
| 23 | Arizona | $41.84 | $87,030 | 63% |
| 24 | Oregon | $44.25 | $92,040 | 62% |
| 25 | West Virginia | $35.29 | $73,410 | 62% |
| 26 | Kansas | $37.70 | $78,420 | 61% |
| 27 | Tennessee | $36.86 | $76,660 | 61% |
| 28 | Utah | $39.82 | $82,830 | 61% |
| 29 | Minnesota | $45.47 | $94,570 | 61% |
| 30 | Indiana | $37.66 | $78,340 | 61% |
| 31 | Nebraska | $38.83 | $80,770 | 61% |
| 32 | Illinois | $44.87 | $93,320 | 61% |
| 33 | Wisconsin | $39.55 | $82,270 | 61% |
| 34 | Oklahoma | $36.33 | $75,560 | 60% |
| 35 | New Mexico | $38.06 | $79,160 | 59% |
| 36 | Louisiana | $35.50 | $73,840 | 59% |
| 37 | Nevada | $38.29 | $79,650 | 58% |
| 38 | Maine | $38.48 | $80,030 | 56% |
| 39 | South Dakota | $33.65 | $70,000 | 56% |
| 40 | Rhode Island | $44.43 | $92,410 | 53% |
| 41 | Michigan | $39.32 | $81,780 | 53% |
| 42 | New York | $49.65 | $103,280 | 52% |
| 43 | Montana | $34.40 | $71,540 | 51% |
| 44 | Massachusetts | $50.67 | $105,400 | 51% |
| 45 | Vermont | $38.55 | $80,180 | 50% |
| 46 | Connecticut | $45.94 | $95,550 | 46% |
| 47 | Hawaii | $40.32 | $83,870 | 44% |
| 48 | North Dakota | $34.53 | $71,820 | 37% |
| 49 | Alaska | $40.02 | $83,250 | 35% |
| 50 | Wyoming | $32.52 | $67,640 | 32% |
| 51 | District of Columbia | $54.78 | $113,930 | 20% |
Why are tech workers so generously compensated in Alabama? It could be because the area’s talent pool is not keeping up with demand.
In 2021, Huntsville, Alabama is expected to see 25,000 new jobs in aerospace, logistics, defense, and other tech-related industries. But these jobs could be difficult to fill given the area’s low unemployment rate.
On the other end of the spectrum, the District of Columbia has the smallest discrepancy between tech and other salaries. But at $95,330, the area has the highest average yearly salary for other occupations in the country—and tech workers still make 20% more.
Top 10 Metro Areas for Tech Salaries
Some of the highest-paying states are also home to the highest-paying metro areas.
For instance, when it comes to pay differences in tech, two of the top 10 metro areas are located in Washington state, while three are in California. The graphic below shows the metros with the highest difference between the area’s average salary and the average salary of tech jobs.
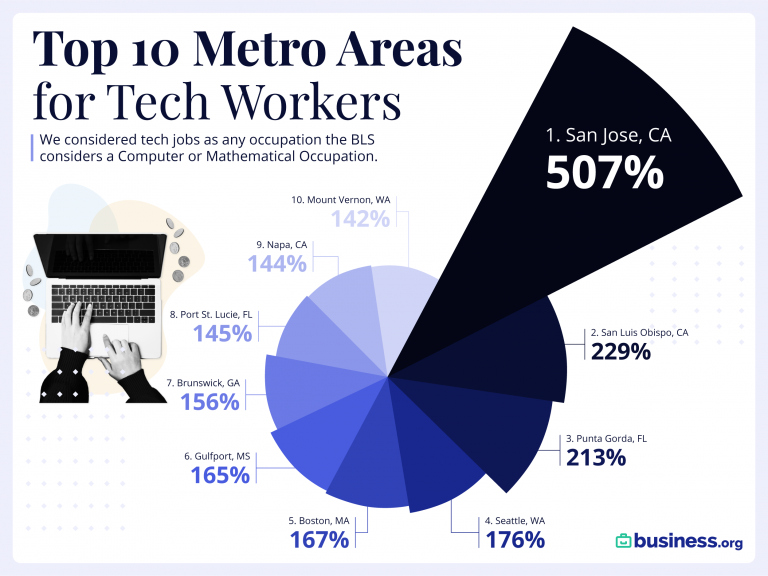
The highest pay difference between tech jobs vs the average salary is in San Jose, where tech workers make 507% more on average. This figure is almost certainly skewed because of the area’s high concentration of tech millionaires and top tier programmers.
Highest Paying Tech Jobs Nationally
Of course, location isn’t the only factor that plays into salary—the type of job is important, too. Here’s a look at U.S. tech salaries, organized by job type:
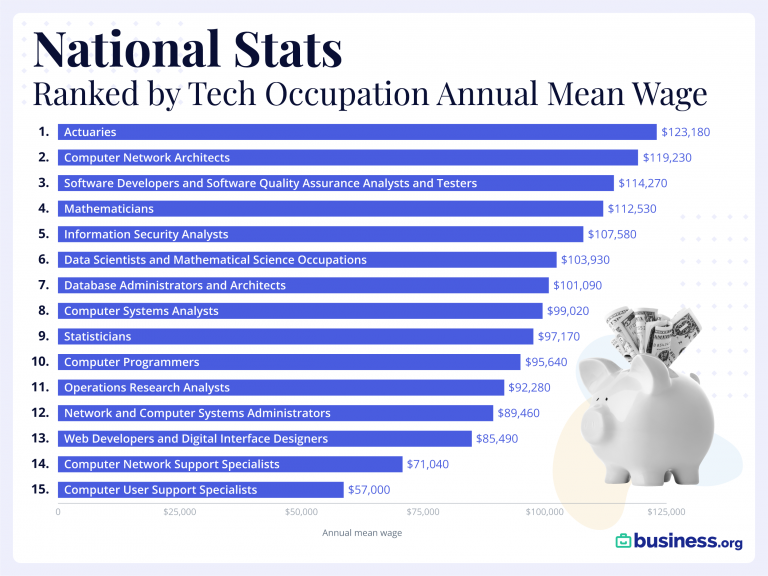
In this analysis, which looked at jobs in computer science as well as mathematics, actuaries are the highest paid professionals on average.
While actuaries are more on the mathematical and financial side of the equation, more commonly associated jobs with tech are all over the list as well: software developers, computer network architects, information security analysts, data scientists, computer programmers, web developers, computer systems analysts, and so on.
The Future of Tech is Bright
America’s information technology sector, worth about $1.6 trillion, is expected to grow to $5 trillion by the end of 2021. And as this fast-growing industry continues to boom, jobs in this sector are likely to remain in high supply.
Augmented Reality (AR) in the U.S. is looking especially promising and is projected to grow by a CAGR of 100% between 2021-2025.
In short, tech is expected to keep growing. And salaries will likely follow suit.


Markets
Ranked: The Largest U.S. Corporations by Number of Employees
We visualized the top U.S. companies by employees, revealing the massive scale of retailers like Walmart, Target, and Home Depot.


The Largest U.S. Corporations by Number of Employees
This was originally posted on our Voronoi app. Download the app for free on Apple or Android and discover incredible data-driven charts from a variety of trusted sources.
Revenue and profit are common measures for measuring the size of a business, but what about employee headcount?
To see how big companies have become from a human perspective, we’ve visualized the top U.S. companies by employees. These figures come from companiesmarketcap.com, and were accessed in March 2024. Note that this ranking includes publicly-traded companies only.
Data and Highlights
The data we used to create this list of largest U.S. corporations by number of employees can be found in the table below.
| Company | Sector | Number of Employees |
|---|---|---|
| Walmart | Consumer Staples | 2,100,000 |
| Amazon | Consumer Discretionary | 1,500,000 |
| UPS | Industrials | 500,000 |
| Home Depot | Consumer Discretionary | 470,000 |
| Concentrix | Information Technology | 440,000 |
| Target | Consumer Staples | 440,000 |
| Kroger | Consumer Staples | 430,000 |
| UnitedHealth | Health Care | 400,000 |
| Berkshire Hathaway | Financials | 383,000 |
| Starbucks | Consumer Discretionary | 381,000 |
| Marriott International | Consumer Discretionary | 377,000 |
| Cognizant | Information Technology | 346,600 |
Retail and Logistics Top the List
Companies like Walmart, Target, and Kroger have a massive headcount due to having many locations spread across the country, which require everything from cashiers to IT professionals.
Moving goods around the world is also highly labor intensive, explaining why UPS has half a million employees globally.
Below the Radar?
Two companies that rank among the largest U.S. corporations by employees which may be less familiar to the public include Concentrix and Cognizant. Both of these companies are B2B brands, meaning they primarily work with other companies rather than consumers. This contrasts with brands like Amazon or Home Depot, which are much more visible among average consumers.
A Note on Berkshire Hathaway
Warren Buffett’s company doesn’t directly employ 383,000 people. This headcount actually includes the employees of the firm’s many subsidiaries, such as GEICO (insurance), Dairy Queen (retail), and Duracell (batteries).
If you’re curious to see how Buffett’s empire has grown over the years, check out this animated graphic that visualizes the growth of Berkshire Hathaway’s portfolio from 1994 to 2022.

-

 Business2 weeks ago
America’s Top Companies by Revenue (1994 vs. 2023)
-

 Environment1 week ago
Ranked: Top Countries by Total Forest Loss Since 2001
-

 Markets1 week ago
Visualizing America’s Shortage of Affordable Homes
-

 Maps2 weeks ago
Mapped: Average Wages Across Europe
-

 Mining2 weeks ago
Charted: The Value Gap Between the Gold Price and Gold Miners
-

 Demographics2 weeks ago
Visualizing the Size of the Global Senior Population
-

 Misc2 weeks ago
Tesla Is Once Again the World’s Best-Selling EV Company
-

 Technology2 weeks ago
Ranked: The Most Popular Smartphone Brands in the U.S.