Markets
Ranked: Visualizing the Largest Trading Partners of the U.S.


Ranked: The Largest Trading Partners of the U.S.
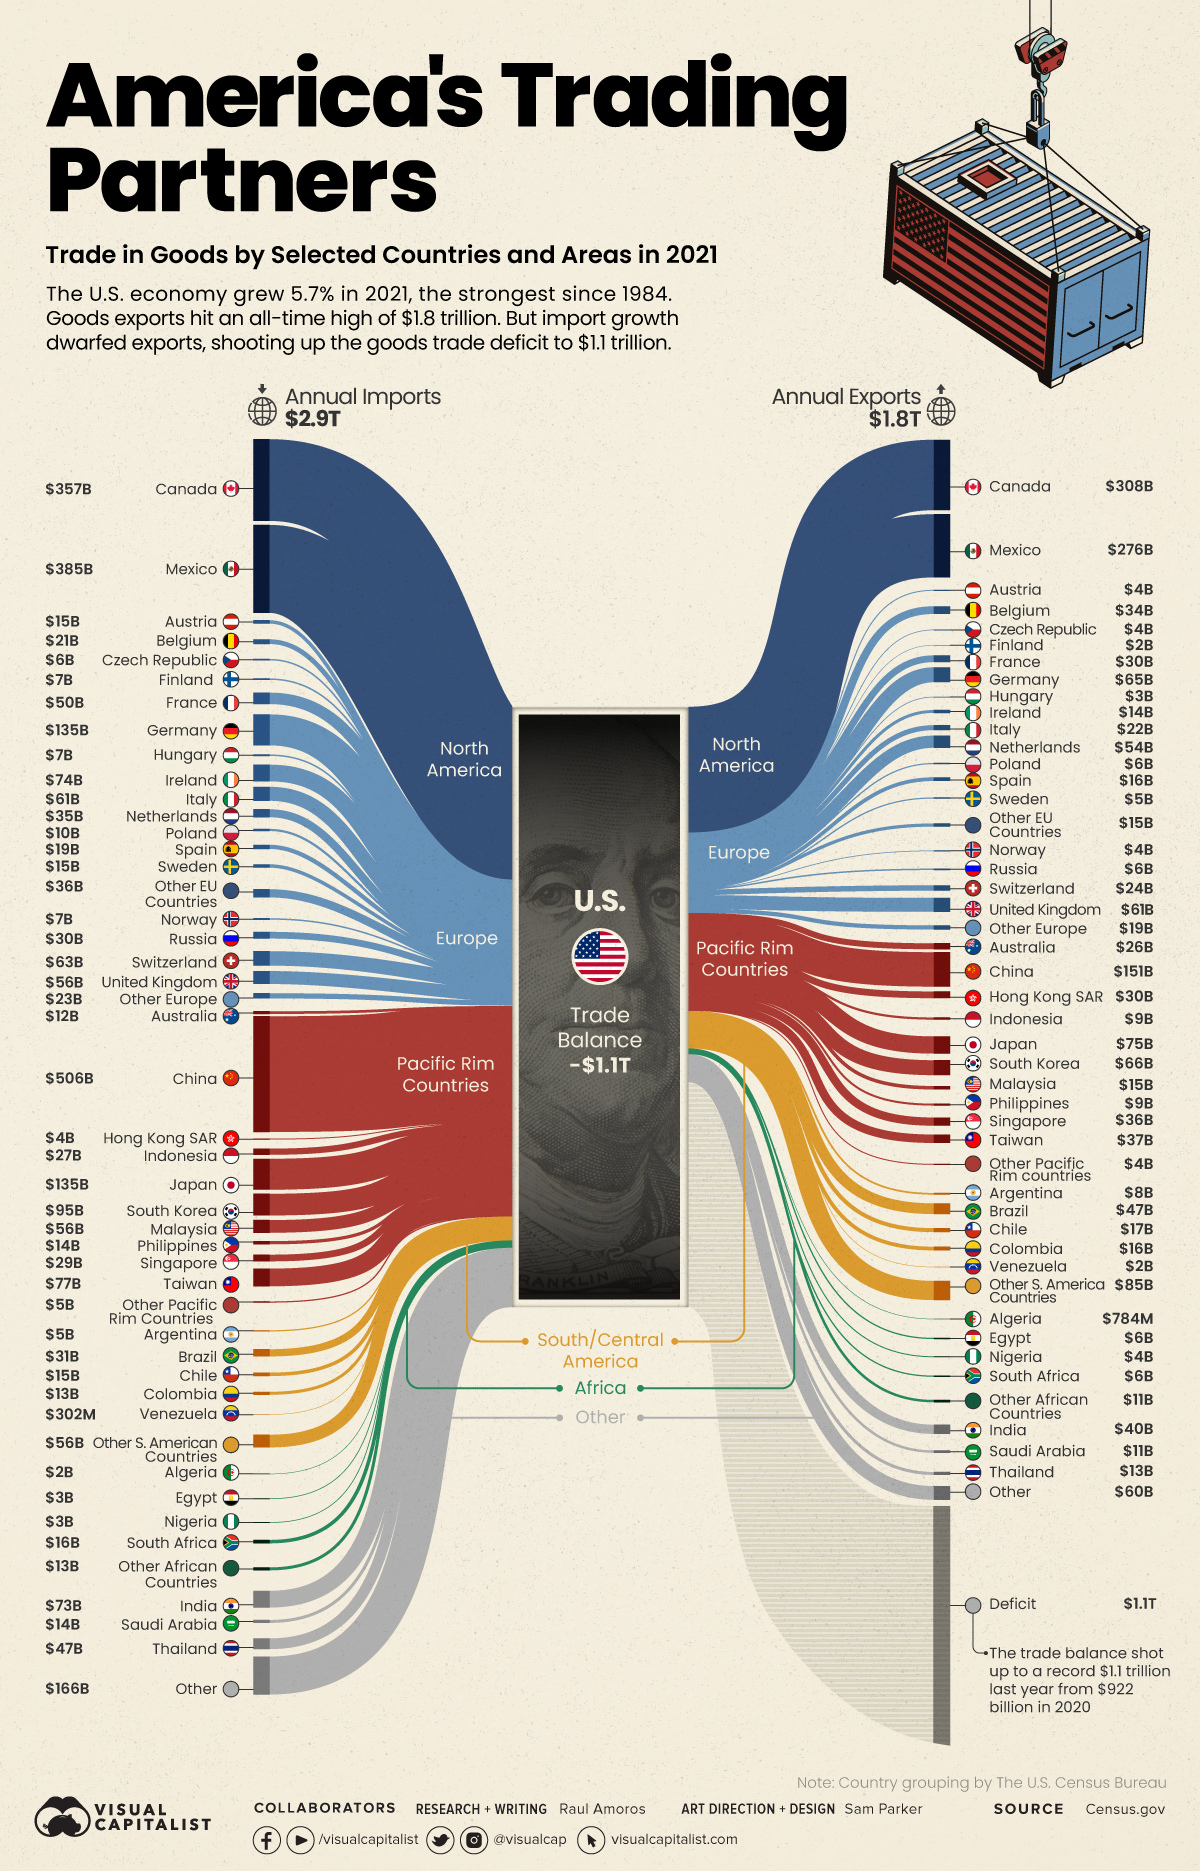
The U.S. economy grew 5.7% in 2021, the fastest pace since 1984, bouncing back from the economic downturn created by the pandemic. But as supply chain issues reared their head and international restrictions came in and out of play, how did the country’s trade situation shape up?
America’s trade deficit of goods shot up to a whopping record $1.1 trillion in 2021 from $922 billion in 2020, leading to its largest ever deficit. Imports dwarfed exports, reaching new highs of $2.9 trillion in 2021, while U.S. exports to other countries added up to $1.8 trillion.
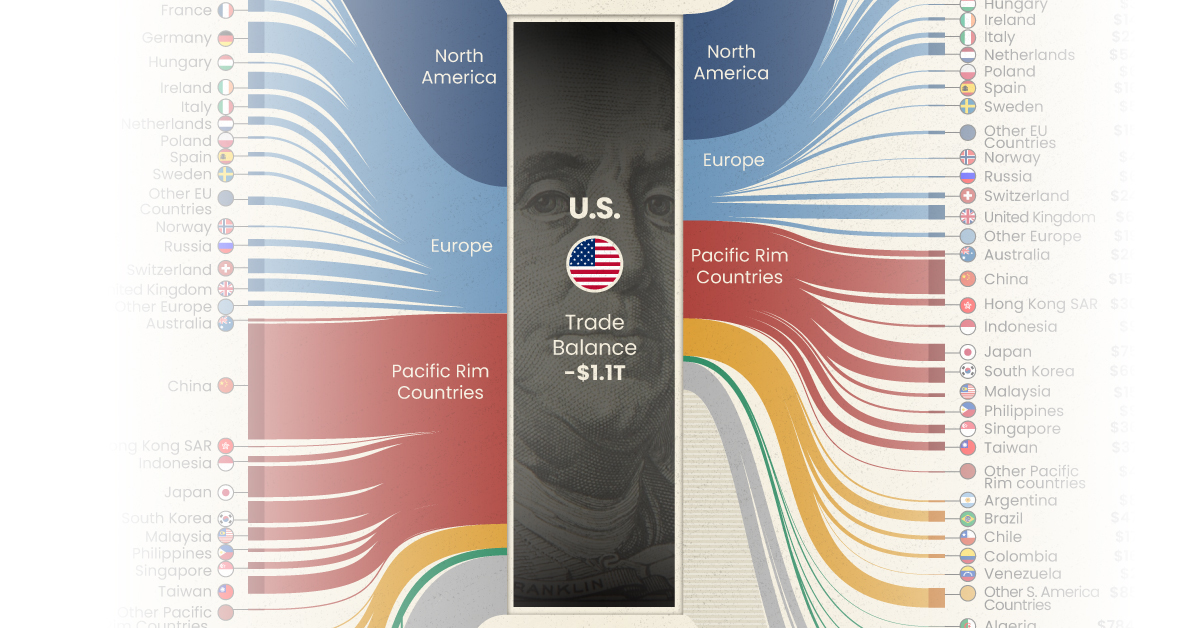
Using the latest data on international trade from the U.S. Census Bureau, we’ve visualized the flow of America’s annual imports and exports for selected countries. The difference between the two measures is the country’s trade deficit for goods.
Who Does the U.S. Trade Most With?
In 2021, U.S trade of goods amounted to nearly $4.6 trillion and Canada, Mexico, and China were America’s largest trading partners. Those three countries alone combined for a total trade of $1.9 trillion, equal to about 41% of all trade of goods.
Let’s take a look at the 10 countries that trade the most with the United States:
| Rank | U.S. Trade Partners | Goods Imports (in billion U.S. dollars) | Goods Exports (in billion U.S. dollars) | Total Trade (in billion U.S. dollars) |
|---|---|---|---|---|
| #1 | 🇨🇦 Canada | $357.2 | $307.6 | $664.8 |
| #2 | 🇲🇽 Mexico | $384.7 | $276.5 | $661.2 |
| #3 | 🇨🇳 China | $506.4 | $151.1 | $657.5 |
| #4 | 🇯🇵 Japan | $135.1 | $75.0 | $210.1 |
| #5 | 🇩🇪 Germany | $135.2 | $65.2 | $200.4 |
| #6 | 🇰🇷 South Korea | $95 | $65.8 | $160.8 |
| #7 | 🇬🇧 United Kingdom | $56.4 | $61.5 | $117.9 |
| #8 | 🇹🇼 Taiwan | $77.1 | $36.9 | $114 |
| #9 | 🇮🇳 India | $73.3 | $40.1 | $113.4 |
| #10 | 🇻🇳 Vietnam | $101.9 | $10.9 | $112.8 |
| Total | $2.85 Trillion | $1.76 Trillion | $4.61 Trillion |
From a geographic perspective, the two largest trading partners are based in North America (Canada and Mexico). Meanwhile, six of the top 10 are based in Asia.
Which Countries Does the U.S. Have the Largest Trade Deficit With?
The largest trade deficit is undoubtedly with China, which accounts for more than 32% of the U.S. trade deficit in goods.
The $355 billion deficit with China comes from importing $506 billion in goods such as machinery, furniture, and bedding. Interestingly, many of those imports are made by American companies who outsource their production to China. These outsourcing activities are counted as imports even though they create profit for these U.S. companies.
Below we order U.S. trade partners by trade deficit of goods:
| Rank | U.S. Trade Partners | Goods Trade Deficit (in billion U.S. dollars) |
|---|---|---|
| #1 | 🇨🇳 China | $355.3 |
| #2 | 🇲🇽 Mexico | $108.2 |
| #3 | 🇻🇳 Vietnam | $91.0 |
| #4 | 🇩🇪 Germany | $70.1 |
| #5 | 🇯🇵 Japan | $60.2 |
| #6 | 🇮🇪 Ireland | $60.2 |
| #7 | 🇨🇦 Canada | $49.5 |
| #8 | 🇲🇾 Malaysia | $41.0 |
| #9 | 🇹🇼 Taiwan | $40.2 |
| #10 | 🇮🇹 Italy | $39.3 |
| Total Deficit | $1.09 Trillion |
The second largest U.S. trade deficit is with Mexico with $108 billion. The main imports from Mexico are cars, trucks, and auto parts. On the other side, the main exports are auto parts and petroleum products.
How Does a Trade Deficit Affect the U.S. Economy?
The U.S. has been running trade deficits since the late 1970s, so these latest numbers are a continuation of a long-term trend. Are these trade deficits a bad thing? The simple, unsatisfying answer is, it depends.
When any country spends more money on imports than it makes on exports, it must somehow make up the shortfall. Typically, this means takes the form of borrowing from foreign lenders or allowing foreign investment in domestic assets. In the U.S., the trade imbalance with China is a sore point, as millions of jobs in manufacturing have been lost due to offshoring in recent decades.
That said, running a trade surplus is no guarantee of strong economic performance. Germany is a prime example of a country with a massive trade surplus, but achieving only modest economic growth in recent years.


Markets
U.S. Debt Interest Payments Reach $1 Trillion
U.S. debt interest payments have surged past the $1 trillion dollar mark, amid high interest rates and an ever-expanding debt burden.


U.S. Debt Interest Payments Reach $1 Trillion
This was originally posted on our Voronoi app. Download the app for free on iOS or Android and discover incredible data-driven charts from a variety of trusted sources.
The cost of paying for America’s national debt crossed the $1 trillion dollar mark in 2023, driven by high interest rates and a record $34 trillion mountain of debt.
Over the last decade, U.S. debt interest payments have more than doubled amid vast government spending during the pandemic crisis. As debt payments continue to soar, the Congressional Budget Office (CBO) reported that debt servicing costs surpassed defense spending for the first time ever this year.
This graphic shows the sharp rise in U.S. debt payments, based on data from the Federal Reserve.
A $1 Trillion Interest Bill, and Growing
Below, we show how U.S. debt interest payments have risen at a faster pace than at another time in modern history:
| Date | Interest Payments | U.S. National Debt |
|---|---|---|
| 2023 | $1.0T | $34.0T |
| 2022 | $830B | $31.4T |
| 2021 | $612B | $29.6T |
| 2020 | $518B | $27.7T |
| 2019 | $564B | $23.2T |
| 2018 | $571B | $22.0T |
| 2017 | $493B | $20.5T |
| 2016 | $460B | $20.0T |
| 2015 | $435B | $18.9T |
| 2014 | $442B | $18.1T |
| 2013 | $425B | $17.2T |
| 2012 | $417B | $16.4T |
| 2011 | $433B | $15.2T |
| 2010 | $400B | $14.0T |
| 2009 | $354B | $12.3T |
| 2008 | $380B | $10.7T |
| 2007 | $414B | $9.2T |
| 2006 | $387B | $8.7T |
| 2005 | $355B | $8.2T |
| 2004 | $318B | $7.6T |
| 2003 | $294B | $7.0T |
| 2002 | $298B | $6.4T |
| 2001 | $318B | $5.9T |
| 2000 | $353B | $5.7T |
| 1999 | $353B | $5.8T |
| 1998 | $360B | $5.6T |
| 1997 | $368B | $5.5T |
| 1996 | $362B | $5.3T |
| 1995 | $357B | $5.0T |
| 1994 | $334B | $4.8T |
| 1993 | $311B | $4.5T |
| 1992 | $306B | $4.2T |
| 1991 | $308B | $3.8T |
| 1990 | $298B | $3.4T |
| 1989 | $275B | $3.0T |
| 1988 | $254B | $2.7T |
| 1987 | $240B | $2.4T |
| 1986 | $225B | $2.2T |
| 1985 | $219B | $1.9T |
| 1984 | $205B | $1.7T |
| 1983 | $176B | $1.4T |
| 1982 | $157B | $1.2T |
| 1981 | $142B | $1.0T |
| 1980 | $113B | $930.2B |
| 1979 | $96B | $845.1B |
| 1978 | $84B | $789.2B |
| 1977 | $69B | $718.9B |
| 1976 | $61B | $653.5B |
| 1975 | $55B | $576.6B |
| 1974 | $50B | $492.7B |
| 1973 | $45B | $469.1B |
| 1972 | $39B | $448.5B |
| 1971 | $36B | $424.1B |
| 1970 | $35B | $389.2B |
| 1969 | $30B | $368.2B |
| 1968 | $25B | $358.0B |
| 1967 | $23B | $344.7B |
| 1966 | $21B | $329.3B |
Interest payments represent seasonally adjusted annual rate at the end of Q4.
At current rates, the U.S. national debt is growing by a remarkable $1 trillion about every 100 days, equal to roughly $3.6 trillion per year.
As the national debt has ballooned, debt payments even exceeded Medicaid outlays in 2023—one of the government’s largest expenditures. On average, the U.S. spent more than $2 billion per day on interest costs last year. Going further, the U.S. government is projected to spend a historic $12.4 trillion on interest payments over the next decade, averaging about $37,100 per American.
Exacerbating matters is that the U.S. is running a steep deficit, which stood at $1.1 trillion for the first six months of fiscal 2024. This has accelerated due to the 43% increase in debt servicing costs along with a $31 billion dollar increase in defense spending from a year earlier. Additionally, a $30 billion increase in funding for the Federal Deposit Insurance Corporation in light of the regional banking crisis last year was a major contributor to the deficit increase.
Overall, the CBO forecasts that roughly 75% of the federal deficit’s increase will be due to interest costs by 2034.

-

 Mining2 weeks ago
Charted: The Value Gap Between the Gold Price and Gold Miners
-

 Real Estate1 week ago
Ranked: The Most Valuable Housing Markets in America
-

 Business1 week ago
Charted: Big Four Market Share by S&P 500 Audits
-

 AI1 week ago
The Stock Performance of U.S. Chipmakers So Far in 2024
-

 Misc1 week ago
Almost Every EV Stock is Down After Q1 2024
-

 Money2 weeks ago
Where Does One U.S. Tax Dollar Go?
-

 Green2 weeks ago
Ranked: Top Countries by Total Forest Loss Since 2001
-

 Real Estate2 weeks ago
Visualizing America’s Shortage of Affordable Homes