Markets
Ranked: Visualizing the Largest Trading Partners of the U.S.


Ranked: The Largest Trading Partners of the U.S.
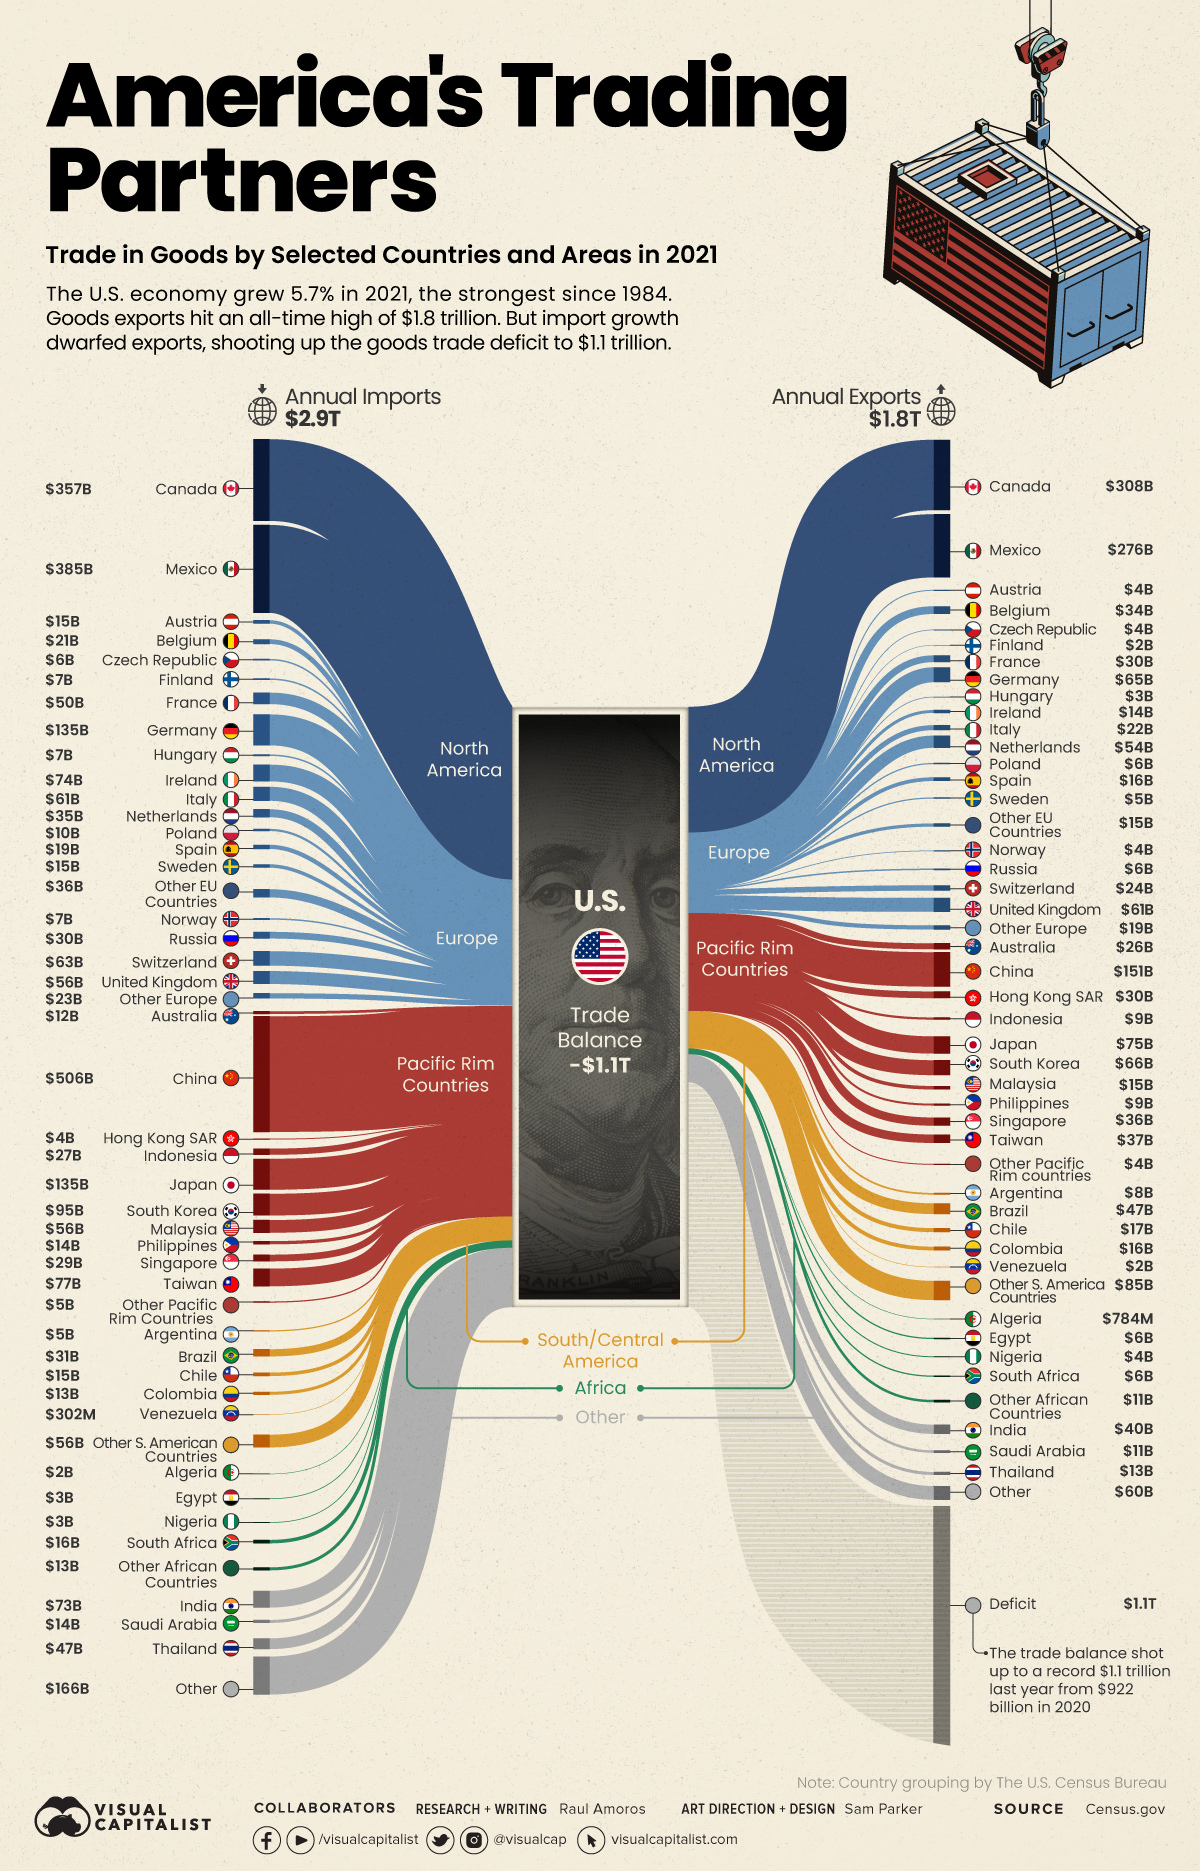
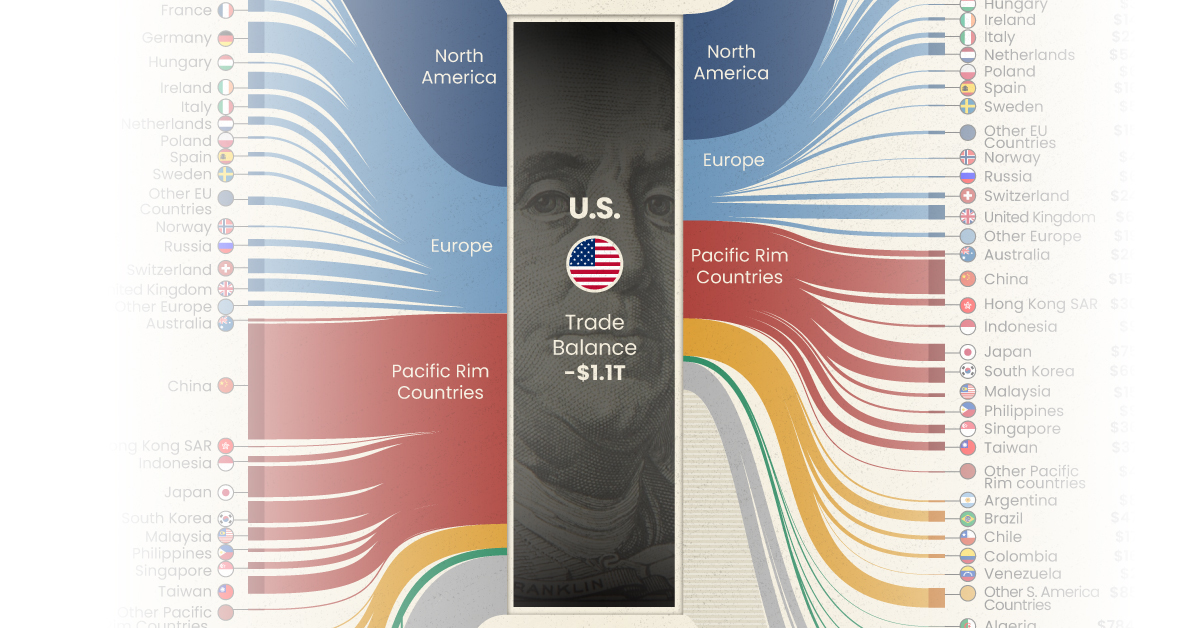
The U.S. economy grew 5.7% in 2021, the fastest pace since 1984, bouncing back from the economic downturn created by the pandemic. But as supply chain issues reared their head and international restrictions came in and out of play, how did the country’s trade situation shape up?
America’s trade deficit of goods shot up to a whopping record $1.1 trillion in 2021 from $922 billion in 2020, leading to its largest ever deficit. Imports dwarfed exports, reaching new highs of $2.9 trillion in 2021, while U.S. exports to other countries added up to $1.8 trillion.
Using the latest data on international trade from the U.S. Census Bureau, we’ve visualized the flow of America’s annual imports and exports for selected countries. The difference between the two measures is the country’s trade deficit for goods.
Who Does the U.S. Trade Most With?
In 2021, U.S trade of goods amounted to nearly $4.6 trillion and Canada, Mexico, and China were America’s largest trading partners. Those three countries alone combined for a total trade of $1.9 trillion, equal to about 41% of all trade of goods.
Let’s take a look at the 10 countries that trade the most with the United States:
| Rank | U.S. Trade Partners | Goods Imports (in billion U.S. dollars) | Goods Exports (in billion U.S. dollars) | Total Trade (in billion U.S. dollars) |
|---|---|---|---|---|
| #1 | 🇨🇦 Canada | $357.2 | $307.6 | $664.8 |
| #2 | 🇲🇽 Mexico | $384.7 | $276.5 | $661.2 |
| #3 | 🇨🇳 China | $506.4 | $151.1 | $657.5 |
| #4 | 🇯🇵 Japan | $135.1 | $75.0 | $210.1 |
| #5 | 🇩🇪 Germany | $135.2 | $65.2 | $200.4 |
| #6 | 🇰🇷 South Korea | $95 | $65.8 | $160.8 |
| #7 | 🇬🇧 United Kingdom | $56.4 | $61.5 | $117.9 |
| #8 | 🇹🇼 Taiwan | $77.1 | $36.9 | $114 |
| #9 | 🇮🇳 India | $73.3 | $40.1 | $113.4 |
| #10 | 🇻🇳 Vietnam | $101.9 | $10.9 | $112.8 |
| Total | $2.85 Trillion | $1.76 Trillion | $4.61 Trillion |
From a geographic perspective, the two largest trading partners are based in North America (Canada and Mexico). Meanwhile, six of the top 10 are based in Asia.
Which Countries Does the U.S. Have the Largest Trade Deficit With?
The largest trade deficit is undoubtedly with China, which accounts for more than 32% of the U.S. trade deficit in goods.
The $355 billion deficit with China comes from importing $506 billion in goods such as machinery, furniture, and bedding. Interestingly, many of those imports are made by American companies who outsource their production to China. These outsourcing activities are counted as imports even though they create profit for these U.S. companies.
Below we order U.S. trade partners by trade deficit of goods:
| Rank | U.S. Trade Partners | Goods Trade Deficit (in billion U.S. dollars) |
|---|---|---|
| #1 | 🇨🇳 China | $355.3 |
| #2 | 🇲🇽 Mexico | $108.2 |
| #3 | 🇻🇳 Vietnam | $91.0 |
| #4 | 🇩🇪 Germany | $70.1 |
| #5 | 🇯🇵 Japan | $60.2 |
| #6 | 🇮🇪 Ireland | $60.2 |
| #7 | 🇨🇦 Canada | $49.5 |
| #8 | 🇲🇾 Malaysia | $41.0 |
| #9 | 🇹🇼 Taiwan | $40.2 |
| #10 | 🇮🇹 Italy | $39.3 |
| Total Deficit | $1.09 Trillion |
The second largest U.S. trade deficit is with Mexico with $108 billion. The main imports from Mexico are cars, trucks, and auto parts. On the other side, the main exports are auto parts and petroleum products.
How Does a Trade Deficit Affect the U.S. Economy?
The U.S. has been running trade deficits since the late 1970s, so these latest numbers are a continuation of a long-term trend. Are these trade deficits a bad thing? The simple, unsatisfying answer is, it depends.
When any country spends more money on imports than it makes on exports, it must somehow make up the shortfall. Typically, this means takes the form of borrowing from foreign lenders or allowing foreign investment in domestic assets. In the U.S., the trade imbalance with China is a sore point, as millions of jobs in manufacturing have been lost due to offshoring in recent decades.
That said, running a trade surplus is no guarantee of strong economic performance. Germany is a prime example of a country with a massive trade surplus, but achieving only modest economic growth in recent years.


Economy
Economic Growth Forecasts for G7 and BRICS Countries in 2024
The IMF has released its economic growth forecasts for 2024. How do the G7 and BRICS countries compare?


G7 & BRICS Real GDP Growth Forecasts for 2024
The International Monetary Fund’s (IMF) has released its real gross domestic product (GDP) growth forecasts for 2024, and while global growth is projected to stay steady at 3.2%, various major nations are seeing declining forecasts.
This chart visualizes the 2024 real GDP growth forecasts using data from the IMF’s 2024 World Economic Outlook for G7 and BRICS member nations along with Saudi Arabia, which is still considering an invitation to join the bloc.
Get the Key Insights of the IMF’s World Economic Outlook
Want a visual breakdown of the insights from the IMF’s 2024 World Economic Outlook report?
This visual is part of a special dispatch of the key takeaways exclusively for VC+ members.
Get the full dispatch of charts by signing up to VC+.
Mixed Economic Growth Prospects for Major Nations in 2024
Economic growth projections by the IMF for major nations are mixed, with the majority of G7 and BRICS countries forecasted to have slower growth in 2024 compared to 2023.
Only three BRICS-invited or member countries, Saudi Arabia, the UAE, and South Africa, have higher projected real GDP growth rates in 2024 than last year.
| Group | Country | Real GDP Growth (2023) | Real GDP Growth (2024P) |
|---|---|---|---|
| G7 | 🇺🇸 U.S. | 2.5% | 2.7% |
| G7 | 🇨🇦 Canada | 1.1% | 1.2% |
| G7 | 🇯🇵 Japan | 1.9% | 0.9% |
| G7 | 🇫🇷 France | 0.9% | 0.7% |
| G7 | 🇮🇹 Italy | 0.9% | 0.7% |
| G7 | 🇬🇧 UK | 0.1% | 0.5% |
| G7 | 🇩🇪 Germany | -0.3% | 0.2% |
| BRICS | 🇮🇳 India | 7.8% | 6.8% |
| BRICS | 🇨🇳 China | 5.2% | 4.6% |
| BRICS | 🇦🇪 UAE | 3.4% | 3.5% |
| BRICS | 🇮🇷 Iran | 4.7% | 3.3% |
| BRICS | 🇷🇺 Russia | 3.6% | 3.2% |
| BRICS | 🇪🇬 Egypt | 3.8% | 3.0% |
| BRICS-invited | 🇸🇦 Saudi Arabia | -0.8% | 2.6% |
| BRICS | 🇧🇷 Brazil | 2.9% | 2.2% |
| BRICS | 🇿🇦 South Africa | 0.6% | 0.9% |
| BRICS | 🇪🇹 Ethiopia | 7.2% | 6.2% |
| 🌍 World | 3.2% | 3.2% |
China and India are forecasted to maintain relatively high growth rates in 2024 at 4.6% and 6.8% respectively, but compared to the previous year, China is growing 0.6 percentage points slower while India is an entire percentage point slower.
On the other hand, four G7 nations are set to grow faster than last year, which includes Germany making its comeback from its negative real GDP growth of -0.3% in 2023.
Faster Growth for BRICS than G7 Nations
Despite mostly lower growth forecasts in 2024 compared to 2023, BRICS nations still have a significantly higher average growth forecast at 3.6% compared to the G7 average of 1%.
While the G7 countries’ combined GDP is around $15 trillion greater than the BRICS nations, with continued higher growth rates and the potential to add more members, BRICS looks likely to overtake the G7 in economic size within two decades.
BRICS Expansion Stutters Before October 2024 Summit
BRICS’ recent expansion has stuttered slightly, as Argentina’s newly-elected president Javier Milei declined its invitation and Saudi Arabia clarified that the country is still considering its invitation and has not joined BRICS yet.
Even with these initial growing pains, South Africa’s Foreign Minister Naledi Pandor told reporters in February that 34 different countries have submitted applications to join the growing BRICS bloc.
Any changes to the group are likely to be announced leading up to or at the 2024 BRICS summit which takes place October 22-24 in Kazan, Russia.
Get the Full Analysis of the IMF’s Outlook on VC+
This visual is part of an exclusive special dispatch for VC+ members which breaks down the key takeaways from the IMF’s 2024 World Economic Outlook.
For the full set of charts and analysis, sign up for VC+.

-

 Markets1 week ago
U.S. Debt Interest Payments Reach $1 Trillion
-

 Markets2 weeks ago
Ranked: The Most Valuable Housing Markets in America
-

 Money2 weeks ago
Which States Have the Highest Minimum Wage in America?
-

 AI2 weeks ago
Ranked: Semiconductor Companies by Industry Revenue Share
-

 Markets2 weeks ago
Ranked: The World’s Top Flight Routes, by Revenue
-

 Countries2 weeks ago
Population Projections: The World’s 6 Largest Countries in 2075
-

 Markets2 weeks ago
The Top 10 States by Real GDP Growth in 2023
-

 Money2 weeks ago
The Smallest Gender Wage Gaps in OECD Countries