Markets
Mapped: The Largest 15 U.S. Cities by GDP


Mapped: The Largest 15 U.S. Cities by GDP
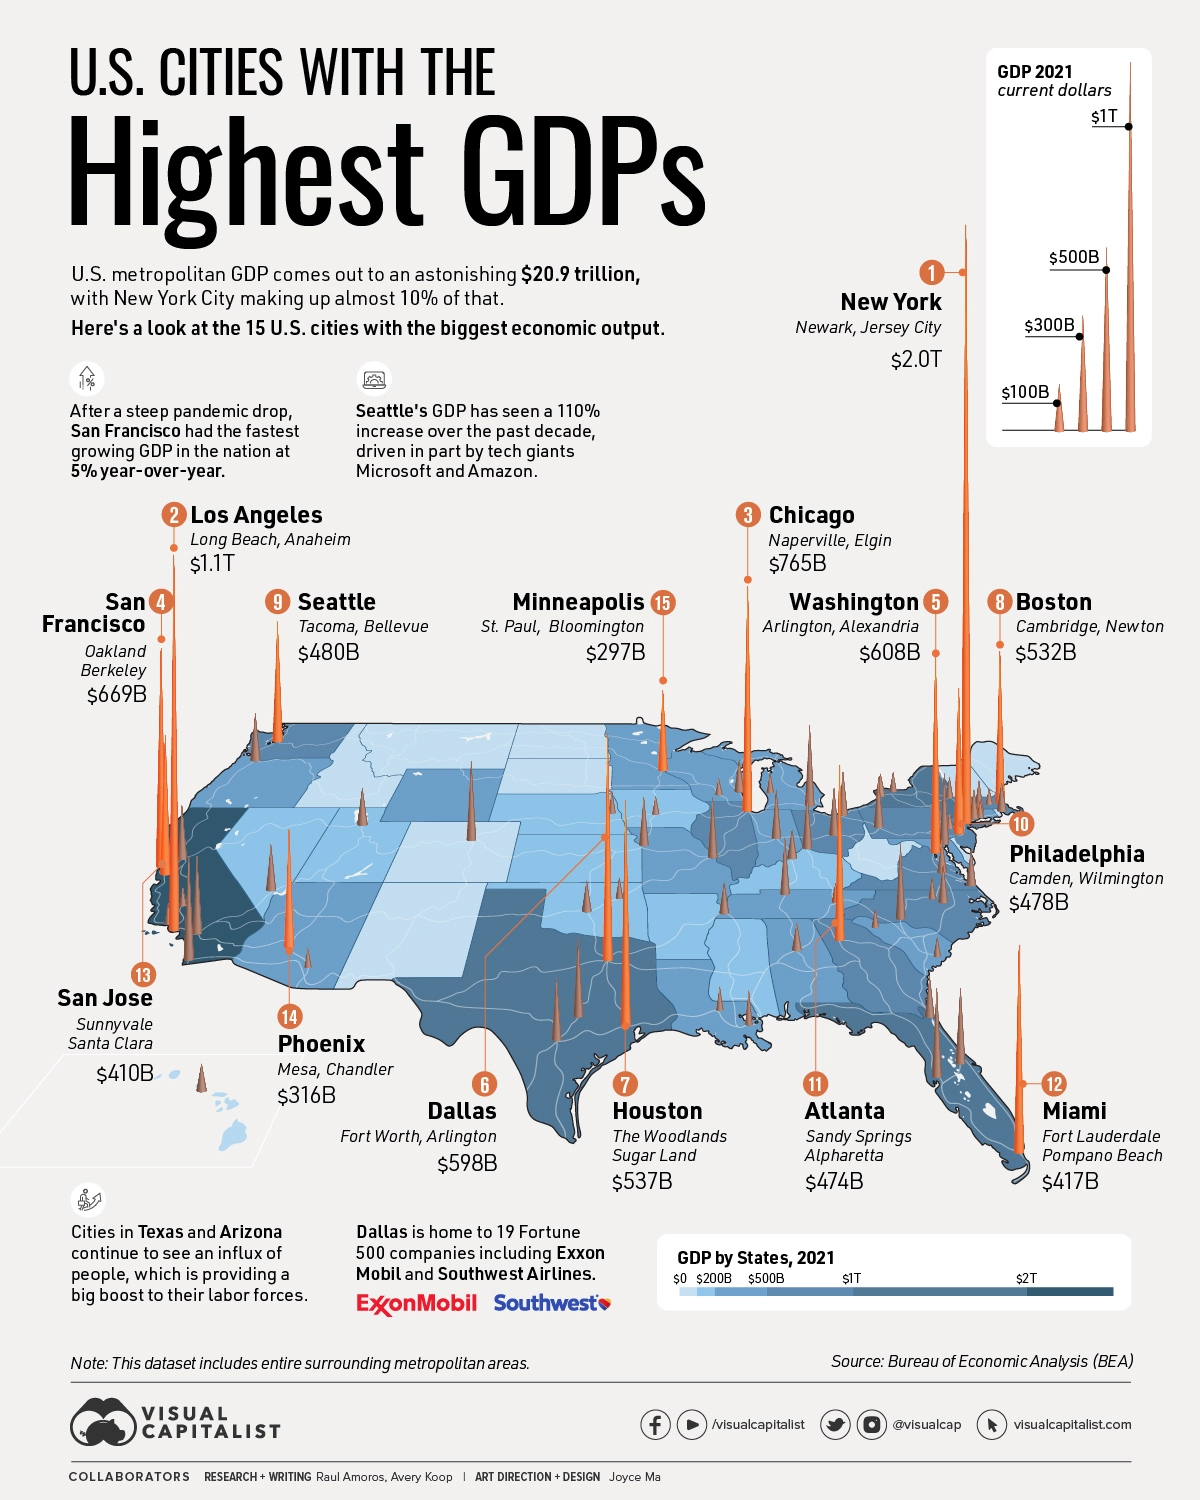
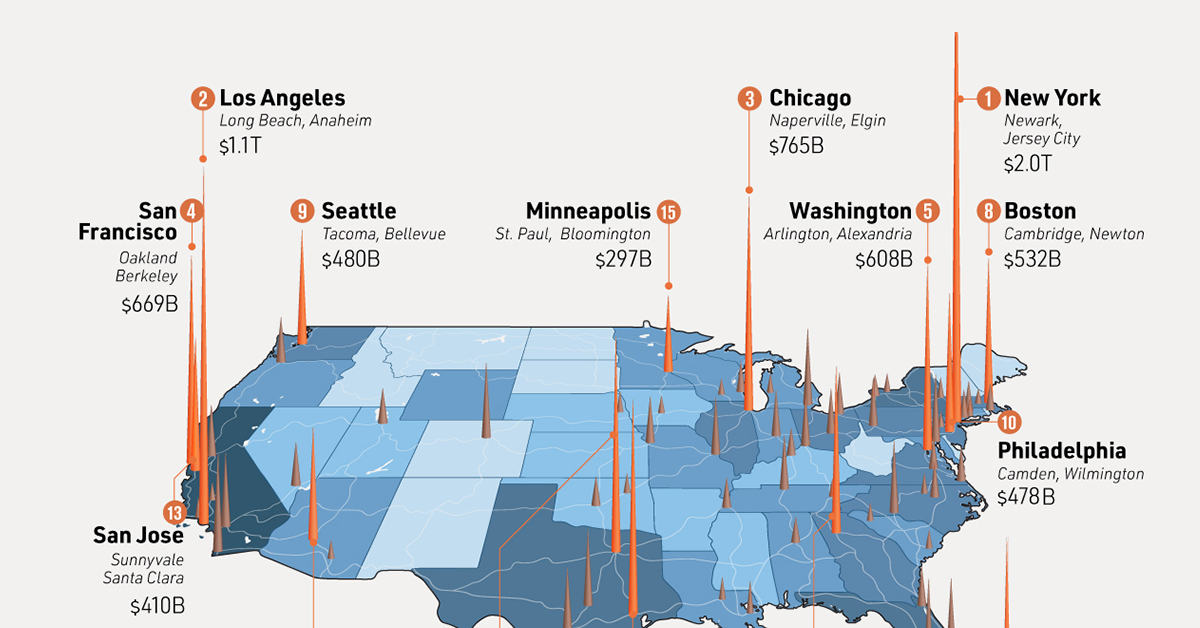
The United States has the largest GDP in the world in nominal terms, and urban areas are a major contributor to the country’s economic might. In fact, metropolitan areas account for roughly 90% of U.S. economic output.
In this visual we’ve ranked the economic output of the top 15 U.S. cities from New York City to Minneapolis, using data from the U.S. Bureau of Economic Analysis. The data covers 2021, which is the most recent release from BEA.
It’s important to note that the data considers entire surrounding metropolitan areas, so as an example, New York City includes neighboring population centers such as Newark, NJ, as well as Jersey City—reaching a GDP of nearly $2 trillion.
Measuring a city’s economy at the metro level can provide a more accurate representation of its economic activity. This is because the metropolitan areas include not only the central city but also the surrounding suburban and rural areas that are economically connected to it.
America’s Economic Hubs
There are some obvious winners when it comes to the largest U.S. cities by GDP, including NYC, Los Angeles, Dallas, and San Francisco.
In the table below, we’ve listed each of the 384 metropolitan areas out of the dataset all the way down to last place, Sebring-Avon Park, Florida, alongside respective ranks and GDP:
| Rank | City | GDP (in thousands) |
|---|---|---|
| #1 | New York-Newark-Jersey City, NY-NJ-PA | $1,992,779,274 |
| #2 | Los Angeles-Long Beach-Anaheim, CA | $1,124,682,354 |
| #3 | Chicago-Naperville-Elgin, IL-IN-WI | $764,583,227 |
| #4 | San Francisco-Oakland-Berkeley, CA | $668,677,573 |
| #5 | Washington-Arlington-Alexandria, DC-VA-MD-WV | $607,628,505 |
| #6 | Dallas-Fort Worth-Arlington, TX | $598,333,263 |
| #7 | Houston-The Woodlands-Sugar Land, TX | $537,066,232 |
| #8 | Boston-Cambridge-Newton, MA-NH | $531,671,846 |
| #9 | Seattle-Tacoma-Bellevue, WA | $479,966,484 |
| #10 | Philadelphia-Camden-Wilmington, PA-NJ-DE-MD | $477,580,629 |
| #11 | Atlanta-Sandy Springs-Alpharetta, GA | $473,823,474 |
| #12 | Miami-Fort Lauderdale-Pompano Beach, FL | $417,147,866 |
| #13 | San Jose-Sunnyvale-Santa Clara, CA | $410,418,579 |
| #14 | Phoenix-Mesa-Chandler, AZ | $316,090,586 |
| #15 | Minneapolis-St. Paul-Bloomington, MN-WI | $296,969,112 |
| #16 | Detroit-Warren-Dearborn, MI | $283,660,258 |
| #17 | San Diego-Chula Vista-Carlsbad, CA | $267,973,544 |
| #18 | Denver-Aurora-Lakewood, CO | $253,399,051 |
| #19 | Baltimore-Columbia-Towson, MD | $222,967,241 |
| #20 | Riverside-San Bernardino-Ontario, CA | $213,183,465 |
| #21 | Charlotte-Concord-Gastonia, NC-SC | $207,866,150 |
| #22 | Austin-Round Rock-Georgetown, TX | $193,773,558 |
| #23 | Tampa-St. Petersburg-Clearwater, FL | $190,708,533 |
| #24 | St. Louis, MO-IL | $187,569,544 |
| #25 | Portland-Vancouver-Hillsboro, OR-WA | $186,570,323 |
| #26 | Cincinnati, OH-KY-IN | $171,737,526 |
| #27 | Pittsburgh, PA | $168,021,049 |
| #28 | Orlando-Kissimmee-Sanford, FL | $167,279,974 |
| #29 | Nashville-Davidson--Murfreesboro--Franklin, TN | $163,031,737 |
| #30 | Indianapolis-Carmel-Anderson, IN | $162,062,985 |
| #31 | Sacramento-Roseville-Folsom, CA | $160,542,566 |
| #32 | Columbus, OH | $154,509,800 |
| #33 | Kansas City, MO-KS | $154,328,892 |
| #34 | Cleveland-Elyria, OH | $147,637,827 |
| #35 | San Antonio-New Braunfels, TX | $144,384,474 |
| #36 | Las Vegas-Henderson-Paradise, NV | $136,198,676 |
| #37 | Salt Lake City, UT | $118,494,536 |
| #38 | Milwaukee-Waukesha, WI | $111,479,649 |
| #39 | Raleigh-Cary, NC | $108,288,115 |
| #40 | Virginia Beach-Norfolk-Newport News, VA-NC | $107,067,798 |
| #41 | Hartford-East Hartford-Middletown, CT | $106,507,622 |
| #42 | Jacksonville, FL | $101,367,263 |
| #43 | Richmond, VA | $99,388,754 |
| #44 | Bridgeport-Stamford-Norwalk, CT | $98,751,750 |
| #45 | Providence-Warwick, RI-MA | $96,913,356 |
| #46 | Oklahoma City, OK | $86,662,243 |
| #47 | Memphis, TN-MS-AR | $86,493,147 |
| #48 | Louisville/Jefferson County, KY-IN | $82,866,115 |
| #49 | New Orleans-Metairie, LA | $81,829,573 |
| #50 | Buffalo-Cheektowaga, NY | $76,991,435 |
| #51 | Albany-Schenectady-Troy, NY | $73,995,509 |
| #52 | Omaha-Council Bluffs, NE-IA | $73,876,512 |
| #53 | Birmingham-Hoover, AL | $70,874,148 |
| #54 | Rochester, NY | $69,341,714 |
| #55 | Grand Rapids-Kentwood, MI | $68,401,313 |
| #56 | Urban Honolulu, HI | $67,383,319 |
| #57 | Des Moines-West Des Moines, IA | $61,171,285 |
| #58 | Durham-Chapel Hill, NC | $60,814,699 |
| #59 | Tulsa, OK | $60,392,165 |
| #60 | Oxnard-Thousand Oaks-Ventura, CA | $58,332,732 |
| #61 | New Haven-Milford, CT | $57,541,201 |
| #62 | Madison, WI | $56,636,713 |
| #63 | Baton Rouge, LA | $56,199,218 |
| #64 | Worcester, MA-CT | $54,941,620 |
| #65 | Knoxville, TN | $52,343,257 |
| #66 | Greenville-Anderson, SC | $52,328,843 |
| #67 | Bakersfield, CA | $52,239,044 |
| #68 | Allentown-Bethlehem-Easton, PA-NJ | $50,960,155 |
| #69 | Charleston-North Charleston, SC | $50,704,392 |
| #70 | Tucson, AZ | $50,231,611 |
| #71 | Fresno, CA | $49,987,063 |
| #72 | Dayton-Kettering, OH | $49,548,210 |
| #73 | Albuquerque, NM | $49,480,431 |
| #74 | Columbia, SC | $48,214,448 |
| #75 | Syracuse, NY | $46,414,861 |
| #76 | Greensboro-High Point, NC | $45,574,221 |
| #77 | North Port-Sarasota-Bradenton, FL | $44,746,013 |
| #78 | Harrisburg-Carlisle, PA | $43,867,213 |
| #79 | Trenton-Princeton, NJ | $43,633,044 |
| #80 | Boise City, ID | $43,601,402 |
| #81 | Colorado Springs, CO | $43,522,096 |
| #82 | Little Rock-North Little Rock-Conway, AR | $42,669,983 |
| #83 | Midland, TX | $42,035,915 |
| #84 | Akron, OH | $41,058,875 |
| #85 | Wichita, KS | $40,586,374 |
| #86 | Toledo, OH | $40,546,884 |
| #87 | Cape Coral-Fort Myers, FL | $39,813,620 |
| #88 | Poughkeepsie-Newburgh-Middletown, NY | $39,375,465 |
| #89 | Portland-South Portland, ME | $39,089,209 |
| #90 | Winston-Salem, NC | $38,504,784 |
| #91 | El Paso, TX | $37,507,586 |
| #92 | Springfield, MA | $37,189,530 |
| #93 | Provo-Orem, UT | $36,866,060 |
| #94 | Stockton, CA | $36,790,065 |
| #95 | Reno, NV | $35,471,910 |
| #96 | Ogden-Clearfield, UT | $35,071,325 |
| #97 | Santa Rosa-Petaluma, CA | $34,450,601 |
| #98 | Chattanooga, TN-GA | $34,425,793 |
| #99 | Huntsville, AL | $34,086,472 |
| #100 | Santa Maria-Santa Barbara, CA | $33,306,884 |
| #101 | Boulder, CO | $33,182,418 |
| #102 | Lakeland-Winter Haven, FL | $33,144,404 |
| #103 | Fayetteville-Springdale-Rogers, AR | $33,102,945 |
| #104 | Vallejo, CA | $33,100,194 |
| #105 | Lancaster, PA | $33,048,548 |
| #106 | Lexington-Fayette, KY | $32,851,535 |
| #107 | Manchester-Nashua, NH | $32,729,580 |
| #108 | Spokane-Spokane Valley, WA | $32,178,609 |
| #109 | Augusta-Richmond County, GA-SC | $31,718,339 |
| #110 | Jackson, MS | $30,785,111 |
| #111 | Salinas, CA | $30,712,263 |
| #112 | Palm Bay-Melbourne-Titusville, FL | $30,589,541 |
| #113 | Scranton--Wilkes-Barre, PA | $30,040,721 |
| #114 | Lansing-East Lansing, MI | $29,363,629 |
| #115 | Ann Arbor, MI | $28,604,834 |
| #116 | Anchorage, AK | $28,210,676 |
| #117 | Modesto, CA | $26,519,792 |
| #118 | Sioux Falls, SD | $26,063,548 |
| #119 | Savannah, GA | $25,681,434 |
| #120 | Deltona-Daytona Beach-Ormond Beach, FL | $25,516,019 |
| #121 | McAllen-Edinburg-Mission, TX | $25,508,724 |
| #122 | Salisbury, MD-DE | $25,194,103 |
| #123 | Fort Wayne, IN | $25,156,180 |
| #124 | Corpus Christi, TX | $24,937,471 |
| #125 | Davenport-Moline-Rock Island, IA-IL | $24,603,801 |
| #126 | Beaumont-Port Arthur, TX | $24,407,762 |
| #127 | Fort Collins, CO | $24,381,467 |
| #128 | Asheville, NC | $24,350,043 |
| #129 | Pensacola-Ferry Pass-Brent, FL | $24,309,017 |
| #130 | Fayetteville, NC | $24,254,218 |
| #131 | Shreveport-Bossier City, LA | $24,153,731 |
| #132 | Naples-Marco Island, FL | $24,020,049 |
| #133 | Springfield, MO | $23,930,761 |
| #134 | Mobile, AL | $23,876,616 |
| #135 | Peoria, IL | $23,599,643 |
| #136 | York-Hanover, PA | $23,406,852 |
| #137 | Youngstown-Warren-Boardman, OH-PA | $23,284,271 |
| #138 | Lafayette, LA | $22,650,406 |
| #139 | Lincoln, NE | $22,492,557 |
| #140 | Greeley, CO | $22,082,249 |
| #141 | Reading, PA | $22,055,785 |
| #142 | Green Bay, WI | $21,991,068 |
| #143 | Killeen-Temple, TX | $21,967,641 |
| #144 | Myrtle Beach-Conway-North Myrtle Beach, SC-NC | $21,787,862 |
| #145 | Salem, OR | $21,487,178 |
| #146 | Evansville, IN-KY | $21,248,968 |
| #147 | Gulfport-Biloxi, MS | $21,177,139 |
| #148 | Port St. Lucie, FL | $20,762,211 |
| #149 | Norwich-New London, CT | $20,743,047 |
| #150 | Visalia, CA | $20,580,771 |
| #151 | Montgomery, AL | $20,250,047 |
| #152 | Canton-Massillon, OH | $20,167,014 |
| #153 | Tallahassee, FL | $20,148,962 |
| #154 | Cedar Rapids, IA | $19,793,178 |
| #155 | San Luis Obispo-Paso Robles, CA | $19,639,637 |
| #156 | Elkhart-Goshen, IN | $19,271,838 |
| #157 | Crestview-Fort Walton Beach-Destin, FL | $18,899,397 |
| #158 | Eugene-Springfield, OR | $18,848,436 |
| #159 | Gainesville, FL | $18,353,884 |
| #160 | Roanoke, VA | $18,297,657 |
| #161 | Wilmington, NC | $18,203,444 |
| #162 | Santa Cruz-Watsonville, CA | $18,076,112 |
| #163 | Spartanburg, SC | $17,914,096 |
| #164 | Kennewick-Richland, WA | $17,836,850 |
| #165 | Fargo, ND-MN | $17,706,417 |
| #166 | Flint, MI | $17,234,628 |
| #167 | Longview, TX | $17,134,932 |
| #168 | South Bend-Mishawaka, IN-MI | $17,031,977 |
| #169 | Rockford, IL | $17,005,386 |
| #170 | Hickory-Lenoir-Morganton, NC | $16,787,117 |
| #171 | Huntington-Ashland, WV-KY-OH | $16,470,842 |
| #172 | Columbus, GA-AL | $16,456,091 |
| #173 | Lubbock, TX | $16,402,001 |
| #174 | Amarillo, TX | $16,313,319 |
| #175 | Olympia-Lacey-Tumwater, WA | $16,245,024 |
| #176 | Appleton, WI | $16,202,188 |
| #177 | Bellingham, WA | $16,036,428 |
| #178 | Kalamazoo-Portage, MI | $15,946,455 |
| #179 | Duluth, MN-WI | $15,905,385 |
| #180 | College Station-Bryan, TX | $15,896,707 |
| #181 | Lake Charles, LA | $15,791,901 |
| #182 | Charlottesville, VA | $15,762,678 |
| #183 | Burlington-South Burlington, VT | $15,669,774 |
| #184 | Rochester, MN | $15,644,852 |
| #185 | Atlantic City-Hammonton, NJ | $15,313,041 |
| #186 | Barnstable Town, MA | $15,150,695 |
| #187 | Bloomington, IL | $15,140,725 |
| #188 | Waco, TX | $15,125,143 |
| #189 | Kingsport-Bristol, TN-VA | $15,104,427 |
| #190 | Utica-Rome, NY | $14,678,570 |
| #191 | Clarksville, TN-KY | $14,546,292 |
| #192 | Bremerton-Silverdale-Port Orchard, WA | $14,373,182 |
| #193 | Laredo, TX | $13,581,543 |
| #194 | Gainesville, GA | $13,561,088 |
| #195 | Charleston, WV | $13,553,478 |
| #196 | Brownsville-Harlingen, TX | $13,225,538 |
| #197 | Champaign-Urbana, IL | $13,219,093 |
| #198 | Topeka, KS | $13,204,822 |
| #199 | Springfield, IL | $13,019,072 |
| #200 | Tyler, TX | $13,002,122 |
| #201 | Tuscaloosa, AL | $12,913,789 |
| #202 | Ocala, FL | $12,907,979 |
| #203 | Hagerstown-Martinsburg, MD-WV | $12,755,632 |
| #204 | Bend, OR | $12,618,710 |
| #205 | Lafayette-West Lafayette, IN | $12,537,390 |
| #206 | Erie, PA | $12,509,399 |
| #207 | Napa, CA | $12,387,136 |
| #208 | Binghamton, NY | $12,314,327 |
| #209 | St. Cloud, MN | $12,202,920 |
| #210 | Columbia, MO | $12,077,178 |
| #211 | Iowa City, IA | $11,989,228 |
| #212 | Yakima, WA | $11,864,827 |
| #213 | Macon-Bibb County, GA | $11,818,017 |
| #214 | Oshkosh-Neenah, WI | $11,586,606 |
| #215 | Billings, MT | $11,570,641 |
| #216 | Athens-Clarke County, GA | $11,562,554 |
| #217 | Hilton Head Island-Bluffton, SC | $11,497,194 |
| #218 | Lynchburg, VA | $11,430,306 |
| #219 | Odessa, TX | $11,399,343 |
| #220 | Wausau-Weston, WI | $11,250,695 |
| #221 | Wheeling, WV-OH | $11,239,365 |
| #222 | Waterloo-Cedar Falls, IA | $11,197,979 |
| #223 | Florence, SC | $11,018,873 |
| #224 | Medford, OR | $10,949,122 |
| #225 | Fort Smith, AR-OK | $10,920,156 |
| #226 | Greenville, NC | $10,841,765 |
| #227 | Merced, CA | $10,465,518 |
| #228 | Kahului-Wailuku-Lahaina, HI | $10,356,019 |
| #229 | Eau Claire, WI | $10,308,773 |
| #230 | Panama City, FL | $10,269,545 |
| #231 | Sioux City, IA-NE-SD | $10,111,866 |
| #232 | Chico, CA | $10,006,052 |
| #233 | Dover, DE | $9,984,324 |
| #234 | Idaho Falls, ID | $9,915,330 |
| #235 | El Centro, CA | $9,912,905 |
| #236 | Jacksonville, NC | $9,900,984 |
| #237 | Daphne-Fairhope-Foley, AL | $9,891,548 |
| #238 | Jackson, TN | $9,779,929 |
| #239 | State College, PA | $9,750,456 |
| #240 | Harrisonburg, VA | $9,499,442 |
| #241 | Redding, CA | $9,419,468 |
| #242 | Saginaw, MI | $9,363,549 |
| #243 | Houma-Thibodaux, LA | $9,350,744 |
| #244 | La Crosse-Onalaska, WI-MN | $9,294,924 |
| #245 | Johnson City, TN | $9,219,695 |
| #246 | Racine, WI | $9,100,374 |
| #247 | Warner Robins, GA | $8,993,124 |
| #248 | Yuma, AZ | $8,977,170 |
| #249 | Lima, OH | $8,962,374 |
| #250 | Jefferson City, MO | $8,956,976 |
| #251 | Abilene, TX | $8,848,793 |
| #252 | Prescott Valley-Prescott, AZ | $8,796,885 |
| #253 | Monroe, LA | $8,699,152 |
| #254 | Kingston, NY | $8,622,165 |
| #255 | Morgantown, WV | $8,597,534 |
| #256 | California-Lexington Park, MD | $8,554,244 |
| #257 | Janesville-Beloit, WI | $8,530,214 |
| #258 | Terre Haute, IN | $8,502,107 |
| #259 | East Stroudsburg, PA | $8,493,417 |
| #260 | Niles, MI | $8,455,695 |
| #261 | Flagstaff, AZ | $8,444,850 |
| #262 | Winchester, VA-WV | $8,419,006 |
| #263 | Bowling Green, KY | $8,368,247 |
| #264 | Las Cruces, NM | $8,339,710 |
| #265 | St. George, UT | $8,338,042 |
| #266 | Joplin, MO | $8,319,062 |
| #267 | San Angelo, TX | $8,284,455 |
| #268 | Bloomington, IN | $8,272,024 |
| #269 | Blacksburg-Christiansburg, VA | $8,271,597 |
| #270 | Bismarck, ND | $8,243,740 |
| #271 | Coeur d'Alene, ID | $8,112,478 |
| #272 | Yuba City, CA | $8,104,050 |
| #273 | Sebastian-Vero Beach, FL | $8,063,835 |
| #274 | Dalton, GA | $7,950,074 |
| #275 | Decatur, IL | $7,856,804 |
| #276 | Dubuque, IA | $7,840,579 |
| #277 | Manhattan, KS | $7,818,079 |
| #278 | Bangor, ME | $7,813,558 |
| #279 | Rocky Mount, NC | $7,799,020 |
| #280 | Sheboygan, WI | $7,747,640 |
| #281 | Pittsfield, MA | $7,682,977 |
| #282 | Mount Vernon-Anacortes, WA | $7,659,302 |
| #283 | Jackson, MI | $7,651,976 |
| #284 | Santa Fe, NM | $7,636,186 |
| #285 | Dothan, AL | $7,636,116 |
| #286 | Ames, IA | $7,583,257 |
| #287 | Rapid City, SD | $7,565,027 |
| #288 | Battle Creek, MI | $7,528,043 |
| #289 | Glens Falls, NY | $7,446,782 |
| #290 | Grand Junction, CO | $7,444,077 |
| #291 | Burlington, NC | $7,440,110 |
| #292 | Pueblo, CO | $7,436,671 |
| #293 | Logan, UT-ID | $7,425,275 |
| #294 | Wenatchee, WA | $7,403,597 |
| #295 | Vineland-Bridgeton, NJ | $7,376,321 |
| #296 | Auburn-Opelika, AL | $7,335,523 |
| #297 | Decatur, AL | $7,282,688 |
| #298 | Kankakee, IL | $7,282,382 |
| #299 | Hanford-Corcoran, CA | $7,258,824 |
| #300 | Columbus, IN | $7,205,692 |
| #301 | Hattiesburg, MS | $7,181,156 |
| #302 | Wichita Falls, TX | $7,096,972 |
| #303 | Ithaca, NY | $7,044,555 |
| #304 | Lake Havasu City-Kingman, AZ | $7,037,905 |
| #305 | Alexandria, LA | $7,037,021 |
| #306 | Watertown-Fort Drum, NY | $6,972,539 |
| #307 | Weirton-Steubenville, WV-OH | $6,966,489 |
| #308 | Lebanon, PA | $6,911,784 |
| #309 | Punta Gorda, FL | $6,911,071 |
| #310 | Madera, CA | $6,907,890 |
| #311 | Chambersburg-Waynesboro, PA | $6,846,649 |
| #312 | Elizabethtown-Fort Knox, KY | $6,819,777 |
| #313 | Muskegon, MI | $6,795,782 |
| #314 | Missoula, MT | $6,780,085 |
| #315 | Altoona, PA | $6,736,868 |
| #316 | Monroe, MI | $6,716,820 |
| #317 | St. Joseph, MO-KS | $6,700,369 |
| #318 | Cheyenne, WY | $6,608,922 |
| #319 | Williamsport, PA | $6,562,069 |
| #320 | Valdosta, GA | $6,529,753 |
| #321 | Jonesboro, AR | $6,494,679 |
| #322 | Fairbanks, AK | $6,477,984 |
| #323 | Albany, GA | $6,462,473 |
| #324 | New Bern, NC | $6,436,366 |
| #325 | Owensboro, KY | $6,434,476 |
| #326 | Ocean City, NJ | $6,279,126 |
| #327 | Grand Forks, ND-MN | $6,226,443 |
| #328 | Morristown, TN | $6,218,224 |
| #329 | Carbondale-Marion, IL | $6,206,570 |
| #330 | Mankato, MN | $6,157,026 |
| #331 | Texarkana, TX-AR | $6,086,205 |
| #332 | Longview, WA | $6,047,768 |
| #333 | Florence-Muscle Shoals, AL | $5,989,958 |
| #334 | Casper, WY | $5,887,565 |
| #335 | Twin Falls, ID | $5,878,885 |
| #336 | Staunton, VA | $5,865,980 |
| #337 | Sherman-Denison, TX | $5,852,474 |
| #338 | Midland, MI | $5,836,461 |
| #339 | Fond du Lac, WI | $5,817,790 |
| #340 | Goldsboro, NC | $5,761,092 |
| #341 | Farmington, NM | $5,698,394 |
| #342 | Lawton, OK | $5,636,670 |
| #343 | Lewiston-Auburn, ME | $5,614,156 |
| #344 | Albany-Lebanon, OR | $5,608,491 |
| #345 | Lawrence, KS | $5,586,561 |
| #346 | Sumter, SC | $5,539,578 |
| #347 | The Villages, FL | $5,507,387 |
| #348 | Cleveland, TN | $5,423,969 |
| #349 | Sierra Vista-Douglas, AZ | $5,399,087 |
| #350 | Mansfield, OH | $5,251,489 |
| #351 | Homosassa Springs, FL | $5,247,686 |
| #352 | Corvallis, OR | $5,242,566 |
| #353 | Johnstown, PA | $5,197,201 |
| #354 | Springfield, OH | $5,162,330 |
| #355 | Brunswick, GA | $5,136,201 |
| #356 | Anniston-Oxford, AL | $5,108,424 |
| #357 | Victoria, TX | $5,082,222 |
| #358 | Bloomsburg-Berwick, PA | $4,916,778 |
| #359 | Hammond, LA | $4,897,538 |
| #360 | Grand Island, NE | $4,871,762 |
| #361 | Cape Girardeau, MO-IL | $4,838,122 |
| #362 | Beckley, WV | $4,563,061 |
| #363 | Rome, GA | $4,539,453 |
| #364 | Michigan City-La Porte, IN | $4,521,182 |
| #365 | Kokomo, IN | $4,488,369 |
| #366 | Muncie, IN | $4,486,204 |
| #367 | Hinesville, GA | $4,427,847 |
| #368 | Gettysburg, PA | $4,310,644 |
| #369 | Elmira, NY | $4,230,830 |
| #370 | Carson City, NV | $4,225,603 |
| #371 | Bay City, MI | $4,158,772 |
| #372 | Great Falls, MT | $4,150,622 |
| #373 | Cumberland, MD-WV | $4,025,355 |
| #374 | Parkersburg-Vienna, WV | $4,000,337 |
| #375 | Pine Bluff, AR | $3,996,508 |
| #376 | Hot Springs, AR | $3,907,112 |
| #377 | Pocatello, ID | $3,732,010 |
| #378 | Grants Pass, OR | $3,666,285 |
| #379 | Danville, IL | $3,645,245 |
| #380 | Walla Walla, WA | $3,642,288 |
| #381 | Lewiston, ID-WA | $3,274,461 |
| #382 | Gadsden, AL | $3,175,372 |
| #383 | Enid, OK | $2,926,730 |
| #384 | Sebring-Avon Park, FL | $2,894,022 |
| All U.S. Metro Areas | $20,943,239,585 |
As the graphic above makes obvious, NYC’s GDP towers over the rest. The Big Apple is the nerve center for a number of high-impact industries, including finance and media.
Moving down the ranking, LA has a $1.1 trillion economy, followed by Chicago, with a GDP of just over $760 billion.
The Fastest Growing Cities
Although many of the top ranking cities are not surprising, there are a number of up-and-coming cities in the list. A report from the Kenan Institute, at the University of North Carolina’s Business School, reveals the fastest growing cities in the U.S. in terms of GDP growth year-over-year. Here’s a look at the top 10:
| Rank | City | State | GDP Growth (2022) |
|---|---|---|---|
| #1 | San Francisco/Bay Area | California | 4.8% |
| #2 | Austin | Texas | 4.3% |
| #3 | Seattle | Washington | 3.5% |
| #4 | Raleigh/Durham | North Carolina | 3.4% |
| #5 | Dallas | Texas | 3.1% |
| #6 | Denver | Colorado | 3.0% |
| #7 | Salt Lake City | Utah | 2.8% |
| #8 | Charlotte | North Carolina | 2.5% |
| #9 | New Orleans | Louisiana | 2.4% |
| #10 | Orlando | Florida | 2.4% |
San Francisco, Seattle, and Dallas appear on both the overall GDP size and growth lists. Dallas’ economy is driven in large part by a growing healthcare industry. The city also continues to attract talent being home to large companies AT&T, CBRE Group, and Texas Instruments.
North Carolina is home to two of the fastest growing metropolitan areas, Raleigh-Durham and Charlotte. These cities may be ones to watch as they are becoming hubs of tech, research, and manufacturing. In fact, North Carolina was recently ranked as the most attractive U.S. state to do business in and both cities are among the fastest growing in terms of population.
The economic center of gravity within the U.S. could be shifting away from the traditional centers of power towards booming cities in the South and West of the United States. The Kenan Institute found that the recovery of hospitality and leisure sectors has helped destinations in these regions like New Orleans and Orlando. Additionally, the shift towards high-tech industry jobs, remote work, and cheaper housing have made these cities very attractive.
Of course, the sunny climate in these cities is an attractive selling point as well.


Markets
U.S. Debt Interest Payments Reach $1 Trillion
U.S. debt interest payments have surged past the $1 trillion dollar mark, amid high interest rates and an ever-expanding debt burden.


U.S. Debt Interest Payments Reach $1 Trillion
This was originally posted on our Voronoi app. Download the app for free on iOS or Android and discover incredible data-driven charts from a variety of trusted sources.
The cost of paying for America’s national debt crossed the $1 trillion dollar mark in 2023, driven by high interest rates and a record $34 trillion mountain of debt.
Over the last decade, U.S. debt interest payments have more than doubled amid vast government spending during the pandemic crisis. As debt payments continue to soar, the Congressional Budget Office (CBO) reported that debt servicing costs surpassed defense spending for the first time ever this year.
This graphic shows the sharp rise in U.S. debt payments, based on data from the Federal Reserve.
A $1 Trillion Interest Bill, and Growing
Below, we show how U.S. debt interest payments have risen at a faster pace than at another time in modern history:
| Date | Interest Payments | U.S. National Debt |
|---|---|---|
| 2023 | $1.0T | $34.0T |
| 2022 | $830B | $31.4T |
| 2021 | $612B | $29.6T |
| 2020 | $518B | $27.7T |
| 2019 | $564B | $23.2T |
| 2018 | $571B | $22.0T |
| 2017 | $493B | $20.5T |
| 2016 | $460B | $20.0T |
| 2015 | $435B | $18.9T |
| 2014 | $442B | $18.1T |
| 2013 | $425B | $17.2T |
| 2012 | $417B | $16.4T |
| 2011 | $433B | $15.2T |
| 2010 | $400B | $14.0T |
| 2009 | $354B | $12.3T |
| 2008 | $380B | $10.7T |
| 2007 | $414B | $9.2T |
| 2006 | $387B | $8.7T |
| 2005 | $355B | $8.2T |
| 2004 | $318B | $7.6T |
| 2003 | $294B | $7.0T |
| 2002 | $298B | $6.4T |
| 2001 | $318B | $5.9T |
| 2000 | $353B | $5.7T |
| 1999 | $353B | $5.8T |
| 1998 | $360B | $5.6T |
| 1997 | $368B | $5.5T |
| 1996 | $362B | $5.3T |
| 1995 | $357B | $5.0T |
| 1994 | $334B | $4.8T |
| 1993 | $311B | $4.5T |
| 1992 | $306B | $4.2T |
| 1991 | $308B | $3.8T |
| 1990 | $298B | $3.4T |
| 1989 | $275B | $3.0T |
| 1988 | $254B | $2.7T |
| 1987 | $240B | $2.4T |
| 1986 | $225B | $2.2T |
| 1985 | $219B | $1.9T |
| 1984 | $205B | $1.7T |
| 1983 | $176B | $1.4T |
| 1982 | $157B | $1.2T |
| 1981 | $142B | $1.0T |
| 1980 | $113B | $930.2B |
| 1979 | $96B | $845.1B |
| 1978 | $84B | $789.2B |
| 1977 | $69B | $718.9B |
| 1976 | $61B | $653.5B |
| 1975 | $55B | $576.6B |
| 1974 | $50B | $492.7B |
| 1973 | $45B | $469.1B |
| 1972 | $39B | $448.5B |
| 1971 | $36B | $424.1B |
| 1970 | $35B | $389.2B |
| 1969 | $30B | $368.2B |
| 1968 | $25B | $358.0B |
| 1967 | $23B | $344.7B |
| 1966 | $21B | $329.3B |
Interest payments represent seasonally adjusted annual rate at the end of Q4.
At current rates, the U.S. national debt is growing by a remarkable $1 trillion about every 100 days, equal to roughly $3.6 trillion per year.
As the national debt has ballooned, debt payments even exceeded Medicaid outlays in 2023—one of the government’s largest expenditures. On average, the U.S. spent more than $2 billion per day on interest costs last year. Going further, the U.S. government is projected to spend a historic $12.4 trillion on interest payments over the next decade, averaging about $37,100 per American.
Exacerbating matters is that the U.S. is running a steep deficit, which stood at $1.1 trillion for the first six months of fiscal 2024. This has accelerated due to the 43% increase in debt servicing costs along with a $31 billion dollar increase in defense spending from a year earlier. Additionally, a $30 billion increase in funding for the Federal Deposit Insurance Corporation in light of the regional banking crisis last year was a major contributor to the deficit increase.
Overall, the CBO forecasts that roughly 75% of the federal deficit’s increase will be due to interest costs by 2034.

-

 Real Estate2 weeks ago
Visualizing America’s Shortage of Affordable Homes
-

 Technology1 week ago
Ranked: Semiconductor Companies by Industry Revenue Share
-

 Money1 week ago
Which States Have the Highest Minimum Wage in America?
-

 Real Estate1 week ago
Ranked: The Most Valuable Housing Markets in America
-

 Business2 weeks ago
Charted: Big Four Market Share by S&P 500 Audits
-

 AI2 weeks ago
The Stock Performance of U.S. Chipmakers So Far in 2024
-

 Misc2 weeks ago
Almost Every EV Stock is Down After Q1 2024
-

 Money2 weeks ago
Where Does One U.S. Tax Dollar Go?