Agriculture
How Big is the U.S. Cheese Stockpile?


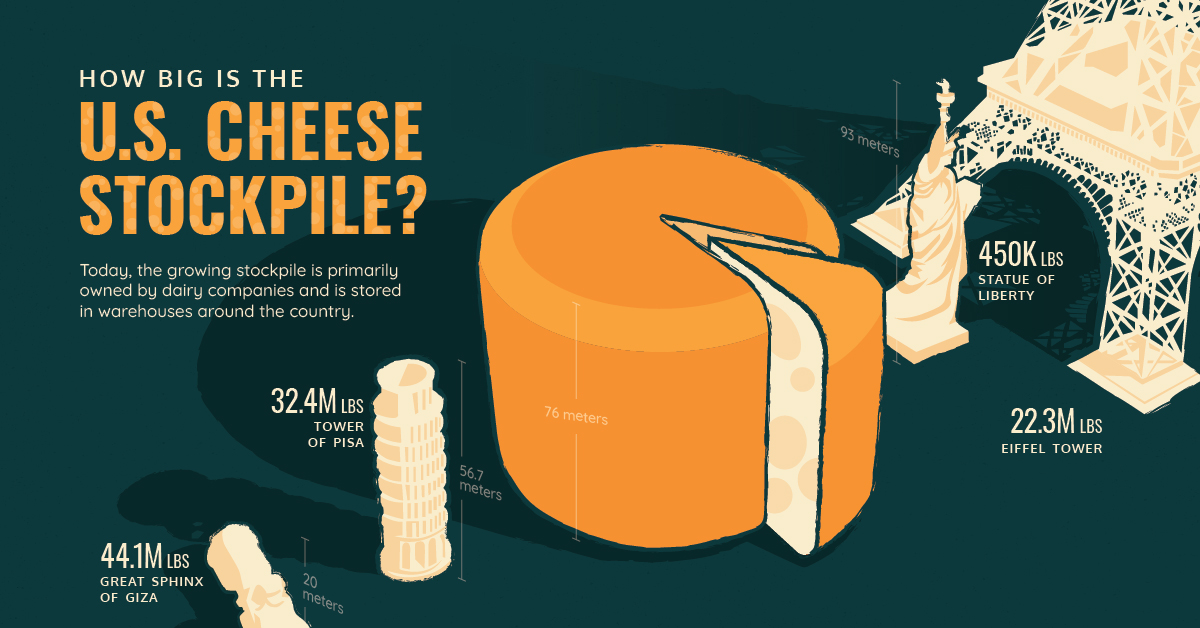
How Big is the U.S. Cheese Stockpile?
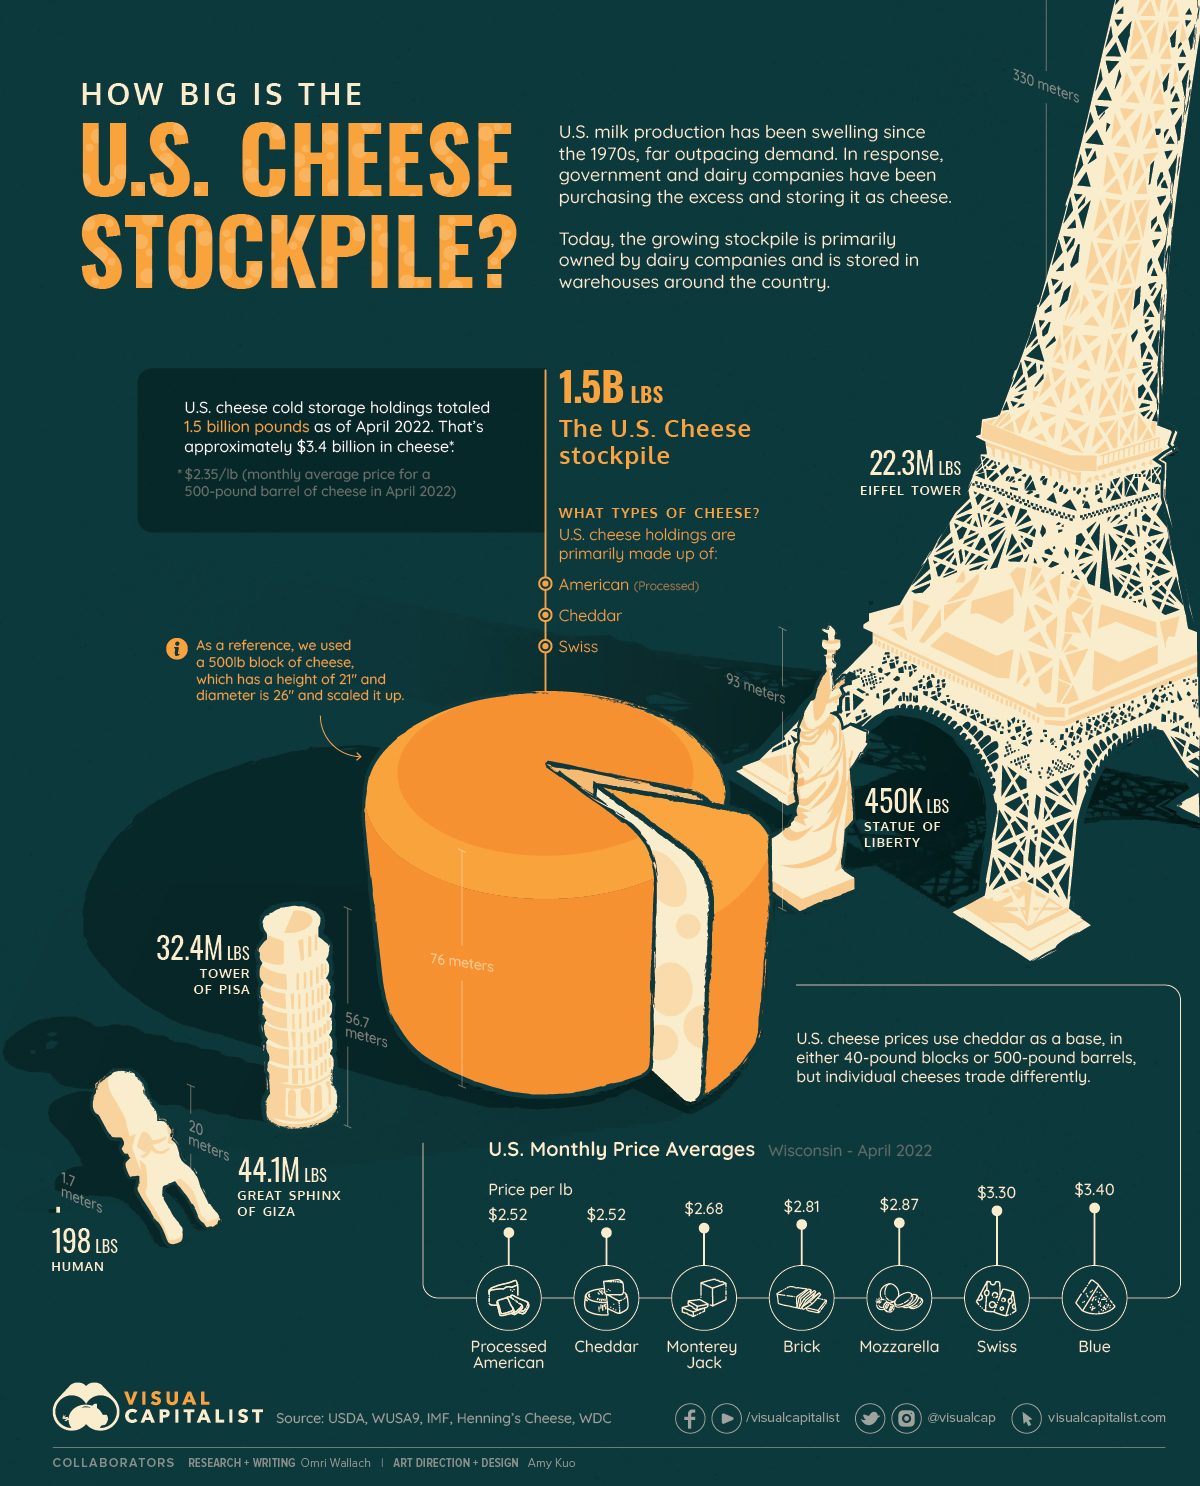
As of August 2022, the U.S. had 1.5 billion pounds of cheese in cold storage across the country. That’s around $3.4 billion worth of cheese.
Using data from USDA, this graphic looks at just how big the U.S. cheese stockpile has gotten over the last few years, and compares it to notable landmarks to help put things into perspective.
But before diving into the data, we’ll take a step back to quickly explain why America’s cheese stockpile has gotten so big in the first place.
Why So Much Cheese?
Over the last 30 years, milk production in the U.S. has increased by 50%.
Yet, while milk production has climbed, milk consumption has declined. In 2004, Americans consumed the equivalent of about 0.57 cups of milk per day. By 2018, average milk consumption had dropped to 0.33 cup-equivalents.
In response to this predicament, the U.S. government and dairy companies have been purchasing the extra milk and storing it as cheese for years.
So, where does one store such a large amount of cheese? A sizable portion of the stockpile is stored in a massive underground warehouse (a former limestone quarry) outside of Springfield, Missouri.
The Stockpile Keeps Growing
Apart from a small dip in 2021 during the global pandemic, America’s stockpile of cheese has increased steadily over the last five years:
| Date | Total cheese in cold storage (billion pounds) | Y-o-y change (%) |
|---|---|---|
| April 2018 | 1.35 | 3.8% |
| April 2019 | 1.40 | 3.7% |
| April 2020 | 1.48 | 5.7% |
| April 2021 | 1.45 | -2.0% |
| April 2022 | 1.48 | 2.1% |
Between April 2018 and April 2022, U.S. cheese holdings increased by 130 million pounds to reach 1.48 billion pounds. After climbing up to 1.52 billion pounds in July, the stockpile settled once again at 1.48 billion pounds at the end of August 2022.
Now, the U.S. cheese stockpile weighs more than the Eiffel Tower, Statue of Liberty, Tower of Pisa, and the Great Sphinx of Giza—combined.
Is the Cheese Stockpile Here to Stay?
Attempts have been made to get rid of the cheese stockpile. Over the years, the government has established federal food welfare programs and encouraged milk consumption in schools throughout the country.
Yet, despite their best efforts to decrease the surplus, America’s cheese stockpile continues to grow.
As domestic consumers continue to decrease their milk consumption, and switch out their dairy milk for milk alternatives like almond or oat milk, how much bigger will this cheese stockpile get before the government comes up with an alternative solution to deal with its surplus of dairy?


Markets
The World’s Top Cocoa Producing Countries
Here are the largest cocoa producing countries globally—from Côte d’Ivoire to Brazil—as cocoa prices hit record highs.
The World’s Top Cocoa Producing Countries
This was originally posted on our Voronoi app. Download the app for free on iOS or Android and discover incredible data-driven charts from a variety of trusted sources.
West Africa is home to the largest cocoa producing countries worldwide, with 3.9 million tonnes of production in 2022.
In fact, there are about one million farmers in Côte d’Ivoire supplying cocoa to key customers such as Nestlé, Mars, and Hershey. But the massive influence of this industry has led to significant forest loss to plant cocoa trees.
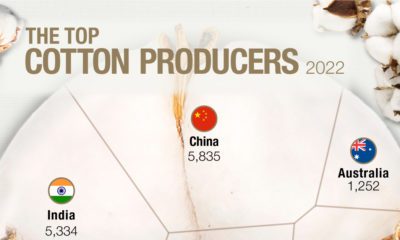
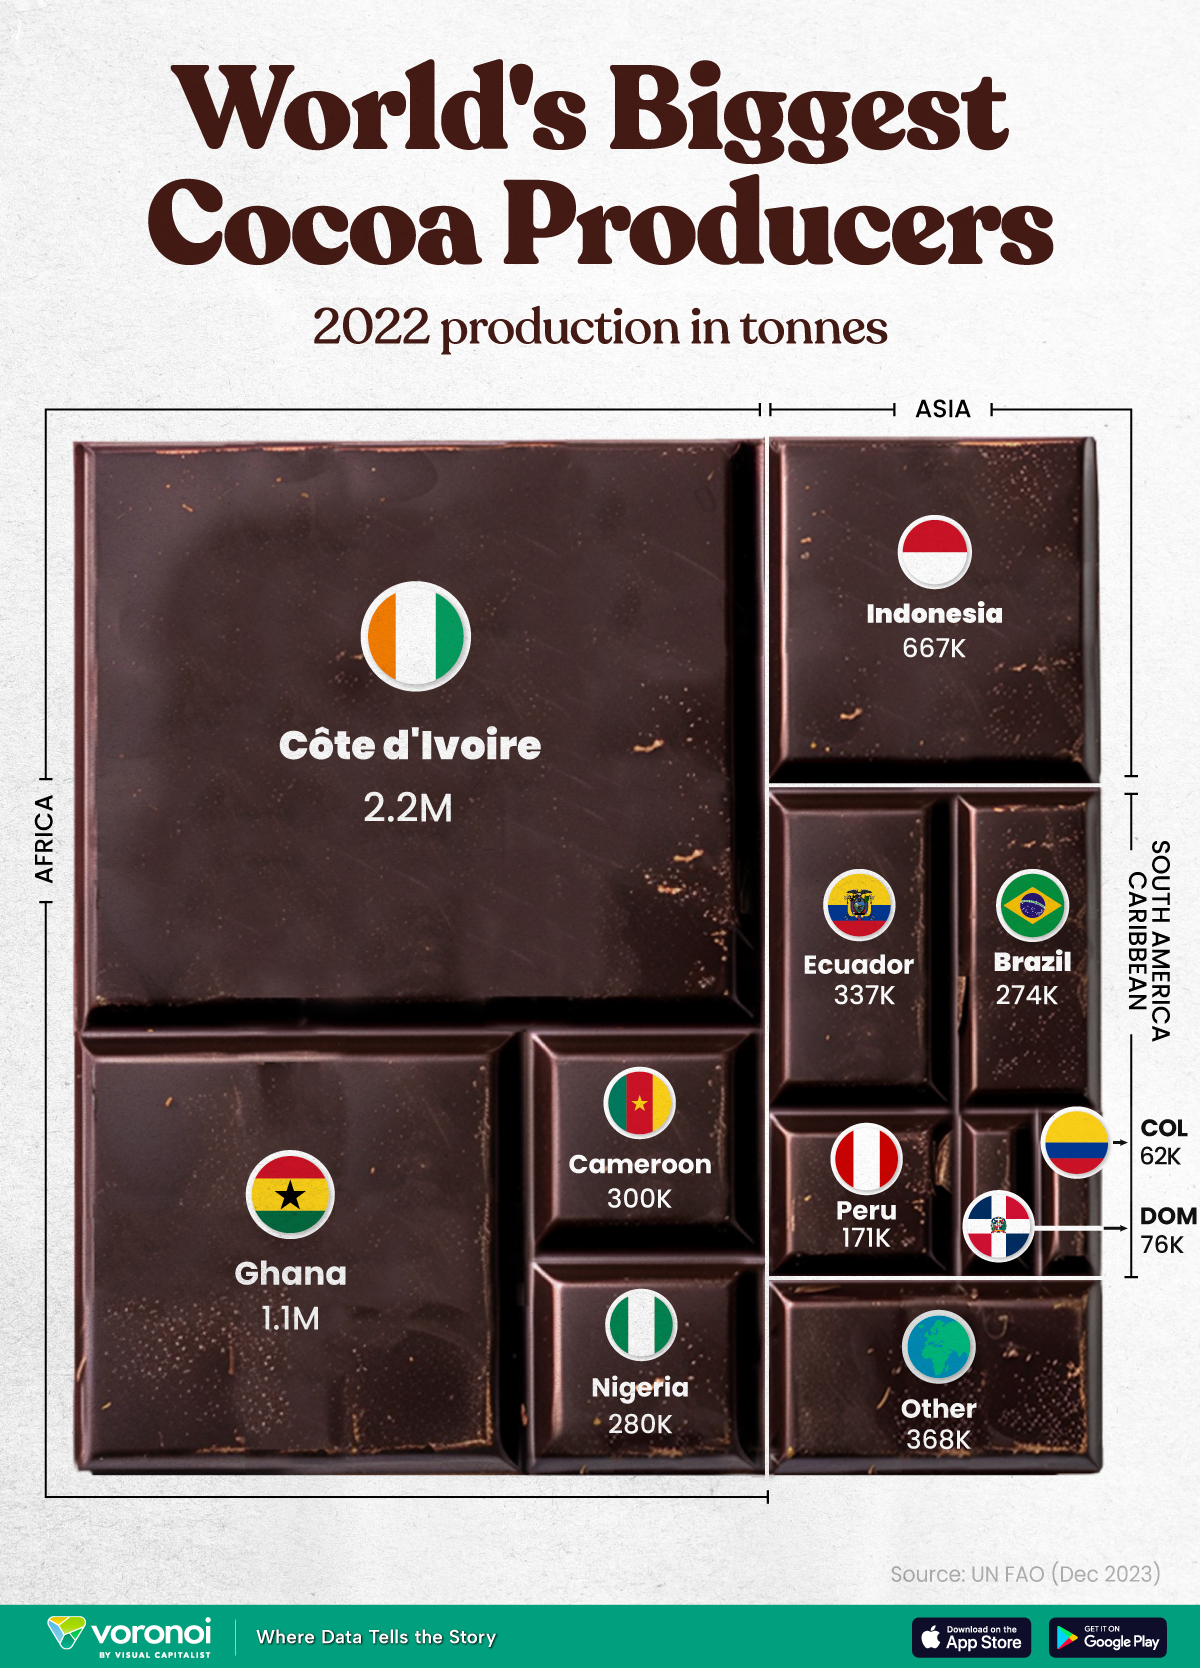
This graphic shows the leading producers of cocoa, based on data from the UN FAO.
Global Hotspots for Cocoa Production
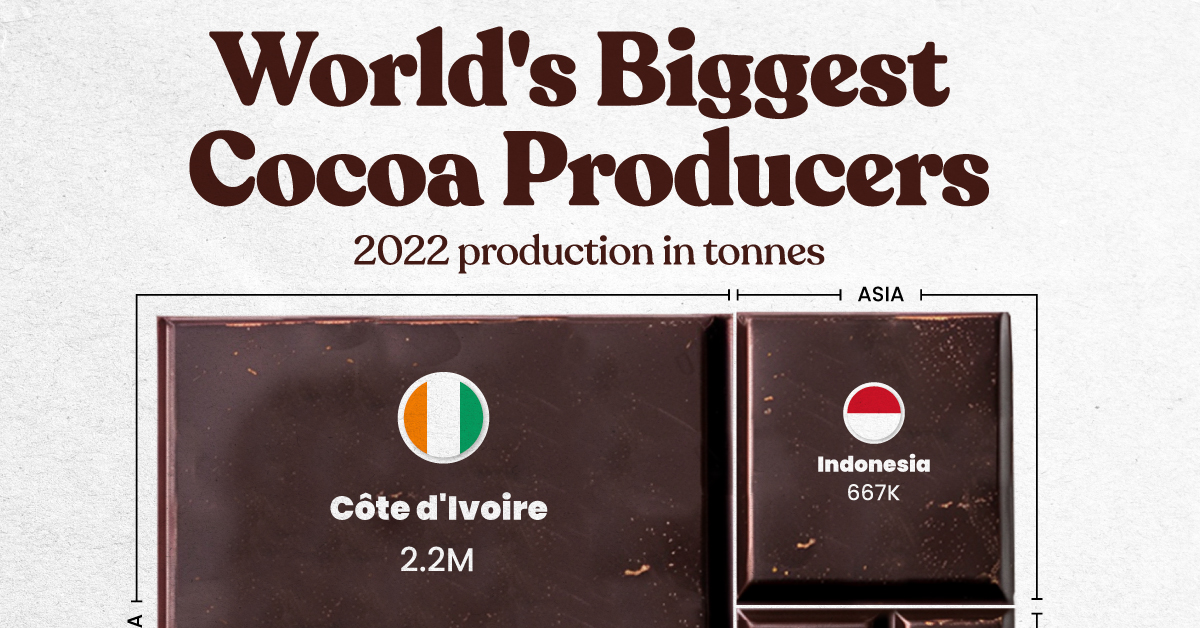
Below, we break down the top cocoa producing countries as of 2022:
| Country | 2022 Production, Tonnes |
|---|---|
| 🇨🇮 Côte d'Ivoire | 2.2M |
| 🇬🇭 Ghana | 1.1M |
| 🇮🇩 Indonesia | 667K |
| 🇪🇨 Ecuador | 337K |
| 🇨🇲 Cameroon | 300K |
| 🇳🇬 Nigeria | 280K |
| 🇧🇷 Brazil | 274K |
| 🇵🇪 Peru | 171K |
| 🇩🇴 Dominican Republic | 76K |
| 🌍 Other | 386K |
With 2.2 million tonnes of cocoa in 2022, Côte d’Ivoire is the world’s largest producer, accounting for a third of the global total.
For many reasons, the cocoa trade in Côte d’Ivoire and Western Africa has been controversial. Often, farmers make about 5% of the retail price of a chocolate bar, and earn $1.20 each day. Adding to this, roughly a third of cocoa farms operate on forests that are meant to be protected.
As the third largest producer, Indonesia produced 667,000 tonnes of cocoa with the U.S., Malaysia, and Singapore as major importers. Overall, small-scale farmers produce 95% of cocoa in the country, but face several challenges such as low pay and unwanted impacts from climate change. Alongside aging trees in the country, these setbacks have led productivity to decline.
In South America, major producers include Ecuador and Brazil. In the early 1900s, Ecuador was the world’s largest cocoa producing country, however shifts in the global marketplace and crop disease led its position to fall. Today, the country is most known for its high-grade single-origin chocolate, with farms seen across the Amazon rainforest.
Altogether, global cocoa production reached 6.5 million tonnes, supported by strong demand. On average, the market has grown 3% annually over the last several decades.

-

 Green1 week ago
Ranked: The Countries With the Most Air Pollution in 2023
-

 Automotive2 weeks ago
Almost Every EV Stock is Down After Q1 2024
-

 AI2 weeks ago
The Stock Performance of U.S. Chipmakers So Far in 2024
-

 Markets2 weeks ago
Charted: Big Four Market Share by S&P 500 Audits
-

 Real Estate2 weeks ago
Ranked: The Most Valuable Housing Markets in America
-

 Money2 weeks ago
Which States Have the Highest Minimum Wage in America?
-

 AI2 weeks ago
Ranked: Semiconductor Companies by Industry Revenue Share
-

 Travel2 weeks ago
Ranked: The World’s Top Flight Routes, by Revenue