Markets
How Total Spend by U.S. Advertisers Has Changed, Over 20 Years
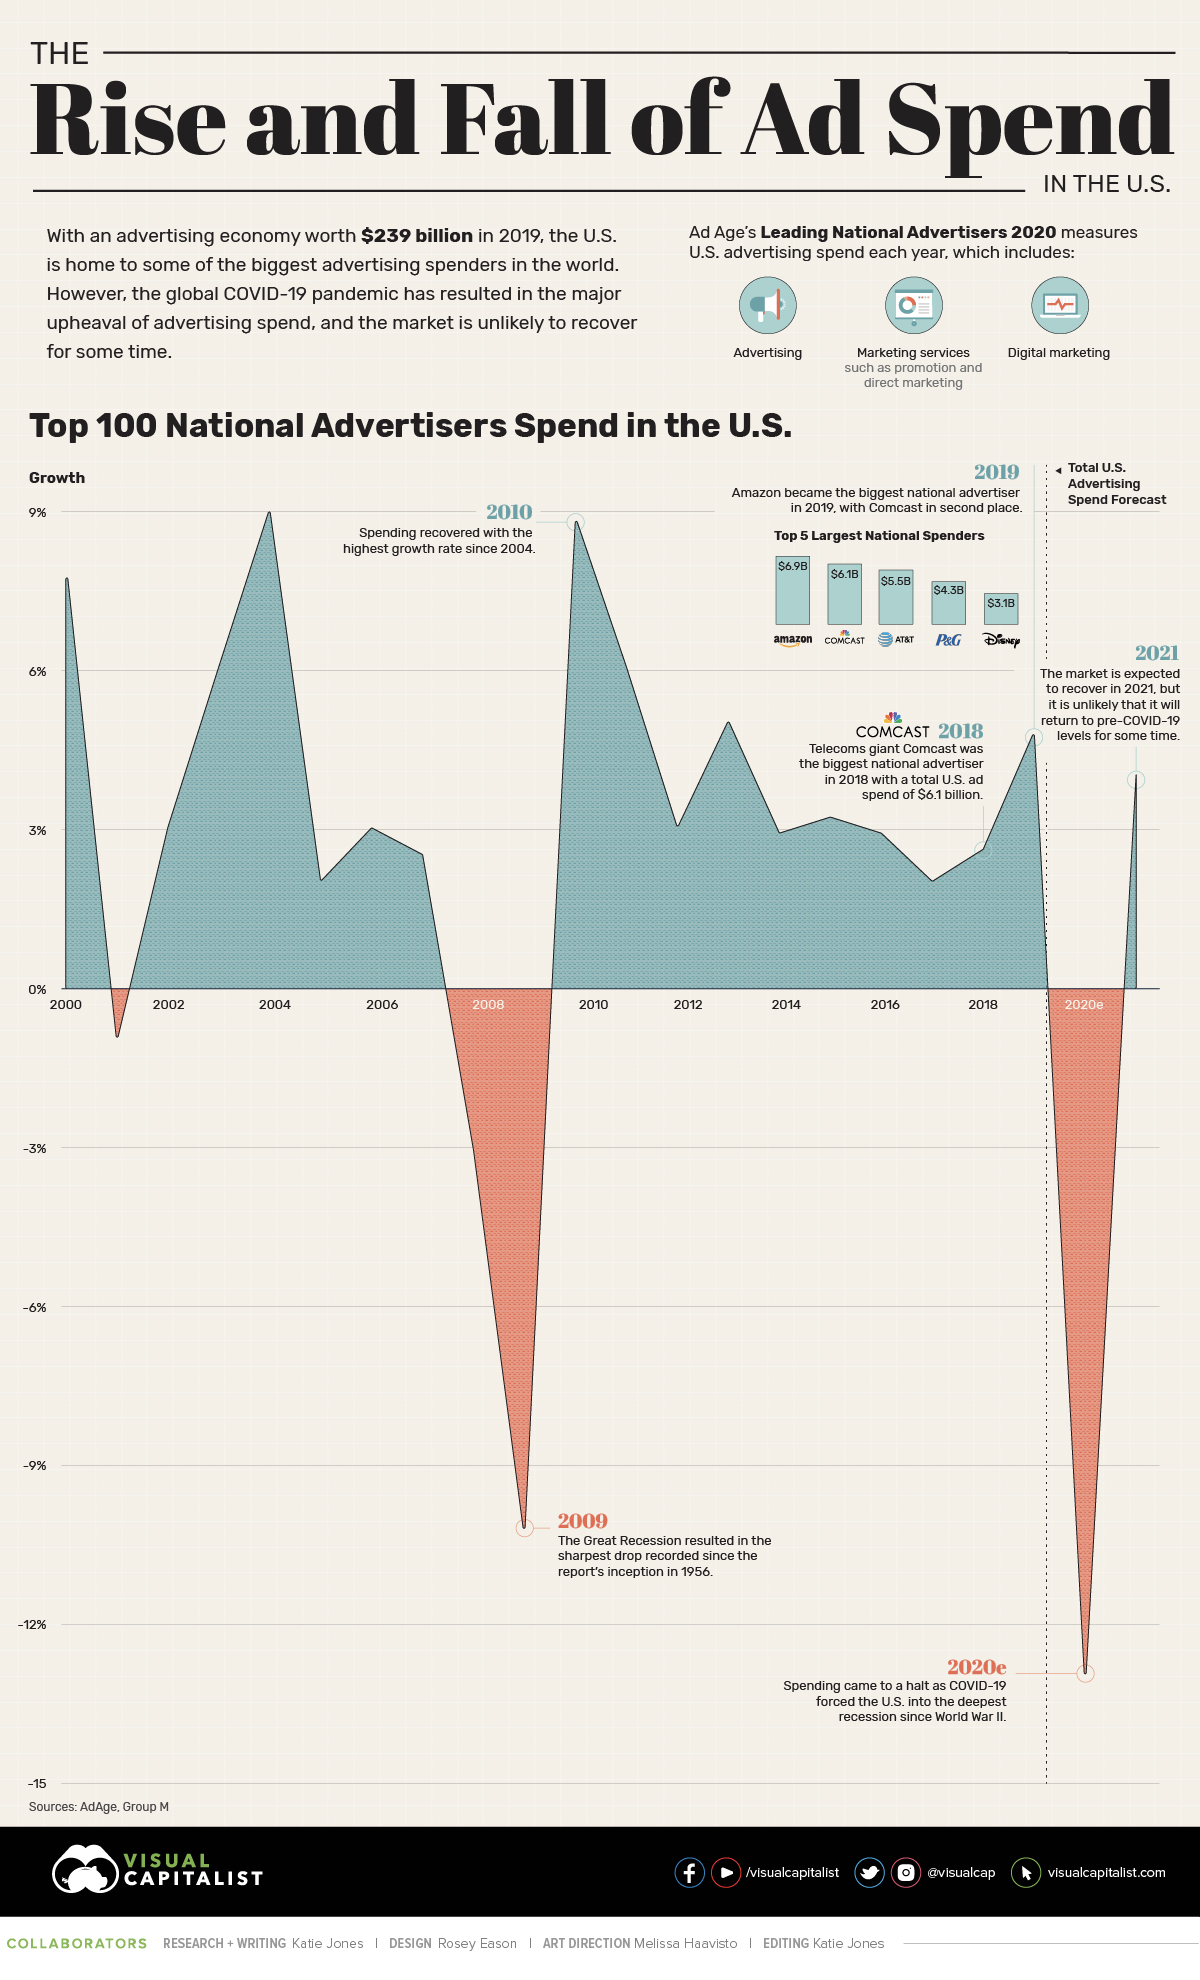
Total Spend by U.S. Advertisers, Over 20 Years
With an advertising economy worth $239 billion in 2019, it’s safe to say that the U.S. is home to some of the biggest advertising spenders on the planet.
However, the COVID-19 pandemic has resulted in the major upheaval of advertising spend, and it is unlikely to recover for some time.
The graphic above uses data from Ad Age’s Leading National Advertisers 2020 which measures U.S. advertising spend each year, and ranks 100 national advertisers by their total spend in 2019.
Let’s take a look at the brands with the biggest budgets.
2019’s Biggest Advertising Spenders
Much of the top 10 biggest advertising spenders are in the telecommunications industry, but it is retail giant Amazon that tops the list with an advertising spend of almost $7 billion.
In fact, Amazon spent an eye-watering $21,000 per minute on advertising and promotion in 2019, making them undeniably the largest advertising spender in America.
Explore the 100 biggest advertisers in 2019 below:
| Rank | Company | Total U.S. Ad Spend 2019 | Industry |
|---|---|---|---|
| #1 | Amazon | $6.9B | Retail |
| #2 | Comcast Corp. | $6.1B | Entertainment |
| #3 | AT&T | $5.5B | Telecommunications |
| #4 | Procter & Gamble | $4.3B | Consumer Goods |
| #5 | Walt Disney | $3.1B | Entertainment |
| #6 | Alphabet | $3.1B | Technology |
| #7 | Verizon Communications | $3.1B | Telecommunications |
| #8 | Charter Communications | $3.0B | Telecommunications |
| #9 | American Express | $3.0B | Financial Services |
| #10 | General Motors | $3.0B | Automotive |
| #11 | JPMorgan Chase | $2.8B | Financial Services |
| #12 | Walmart | $2.7B | Retail |
| #13 | L’Oréal | $2.3B | Beauty |
| #14 | T-Mobile U.S. | $2.3B | Telecommunications |
| #15 | Berkshire Hathaway | $2.3B | Various |
| #16 | Nestlé | $2.3B | Food & Beverages |
| #17 | Ford | $2.3B | Automotive |
| #18 | Expedia Group | $2.2B | Travel & Hospitality |
| #19 | Capital One Financial | $2.2B | Financial Services |
| #20 | Fiat Chrysler Automobiles | $2.0B | Automotive |
| #21 | Samsung | $2.0B | Electronics |
| #22 | Pfizer | $1.9B | Pharmaceuticals |
| #23 | Progressive | $1.8B | Insurance |
| #24 | PepsiCo | $1.7B | Food & Beverages |
| #25 | Bank of America | $1.7B | Financial Services |
| #26 | LVMH | $1.6B | Retail |
| #27 | Target | $1.6B | Retail |
| #28 | McDonald’s | $1.6B | Food & Beverages |
| #29 | Booking Holdings | $1.6B | Travel & Hospitality |
| #30 | GlaxoSmithKline | $1.5B | Pharmaceuticals |
| #31 | Johnson & Johnson | $1.5B | Pharmaceuticals |
| #32 | Anheuser-Busch InBev | $1.5B | Food & Beverages |
| #33 | Toyota | $1.5B | Automotive |
| #34 | Merck & Co. | $1.5B | Logistics |
| #35 | Nike | $1.5B | Retail |
| #36 | AbbVie | $1.4B | Pharmaceuticals |
| #37 | Honda | $1.4B | Automotive |
| #38 | Unilever | $1.4B | Consumer Goods |
| #39 | ViacomCBS | $1.4B | Entertainment |
| #40 | Macy’s | $1.3B | Retail |
| #41 | State Farm | $1.2B | Insurance |
| #42 | Kohl’s | $1.2B | Retail |
| #43 | Home Depot | $1.1B | Retail |
| #44 | Wells Fargo | $1.1B | Financial Services |
| #45 | Yum Brands | $1.1B | Food & Beverages |
| #46 | Netflix | $1.1B | Entertainment |
| #47 | U.S. Government | $1.0B | Government |
| #48 | Estée Lauder | $994M | Beauty |
| #49 | Nissan | $990M | Automotive |
| #50 | Wayfair | $932M | Retail |
| #51 | Diageo | $918M | Food & Beverages |
| #52 | Sanofi | $889M | Pharmaceuticals |
| #53 | Discover Financial Services | $883M | Financial Services |
| #54 | Mars | $880M | Food & Beverages |
| #55 | Eli Lilly | $864M | Pharmaceuticals |
| #56 | Kroger | $854M | Retail |
| #57 | Allstate | $854M | Insurance |
| #58 | Molson Coors | $822M | Food & Beverages |
| #59 | Apple | $818M | Technology |
| #60 | Microsoft | $816M | Technology |
| #61 | Coca-Cola | $816M | Food & Beverages |
| #62 | DISH Network | $815M | Entertainment |
| #63 | Lowe’s | $811M | Retail |
| #64 | Kraft Heinz | $782M | Food & Beverages |
| #65 | Volkswagen | $780M | Automotive |
| #66 | IAC | $775M | Entertainment |
| #67 | Best Buy | $772M | Retail |
| #68 | Intuit | $760M | Technology |
| #69 | Uber | $756M | Technology |
| #70 | Constellation Brands | $749M | Food & Beverages |
| #71 | Sony | $746M | Technology |
| #72 | Cox Enterprises | $715M | Entertainment |
| #73 | Citigroup | $691M | Financial Services |
| #74 | Adidas | $688M | Consumer Goods |
| #75 | LendingTree | $688M | Financial Services |
| #76 | Amgen | $685M | Technology |
| #77 | Gilead Services | $683M | Pharmaceuticals |
| #78 | $671M | Technology | |
| #79 | Lions Gate | $668M | Entertainment |
| #80 | Marriott International | $667M | Travel & Hospitality |
| #81 | EssilorLuxottica | $665M | Consumer Goods |
| #82 | J.C. Penney | $644M | Retail |
| #83 | Liberty Mutual | $640M | Insurance |
| #84 | Daimler | $640M | Automotive |
| #85 | Hyundai | $627M | Automotive |
| #86 | Walgreens | $621M | Retail |
| #87 | Dell | $618M | Technology |
| #88 | IBM | $606M | Technology |
| #89 | Reckitt Benckiser | $593M | Consumer Goods |
| #90 | Keurig Dr Pepper | $593M | Food & Beverages |
| #91 | Restaurant Brands International | $589M | Food & Beverages |
| #92 | Inspire Brands | $589M | Food & Beverages |
| #93 | Clorox | $581M | Consumer Goods |
| #94 | Novartis | $579M | Pharmaceuticals |
| #95 | eBay | $562M | Retail |
| #96 | Gap | $562M | Retail |
| #97 | Takeda | $541M | Pharmaceuticals |
| #98 | Kia Motors | $534M | Automotive |
| #99 | Coty | $531M | Beauty |
| #100 | Subarau | $532M | Automotive |
The report offers several ways of looking at this data—for example, when looking at highest spend by medium, Procter & Gamble comes out on top for traditional media spend like broadcast and cable TV.
On the digital front, Expedia Group is the biggest spender on desktop search, while Amazon tops the list for internet display ads.
The Rise and Fall of Advertising Spend
Interestingly, changes in advertising spend tend to fall closely in step with broader economic growth. In fact, for every 1% increase in U.S. GDP, there is a 4.4% rise of advertising that occurs in tandem.
The same phenomenon can be seen among the biggest advertising spenders in the country. Since 2000, spend has seen both promising growth, and drastic declines. Unsurprisingly, the Great Recession resulted in the largest drop in spend ever recorded, and now it looks as though history may be repeating itself.
Total advertising spend in the U.S. is estimated this year to see a brutal decline of almost 13% and is unlikely to return to previous levels for a number of years.
The COVID-19 Gut Punch
To say that the global COVID-19 pandemic has impacted consumer behavior would be an understatement, and perhaps the most notable change is how they now consume content.
With more people staying safe indoors, there is less need for traditional media formats such as out-of-home advertising. As a result, online media is taking its place, as an increase in spend for this format shows.
But despite marketers trying to optimize their media strategy or stripping back their budget entirely, many governments across the world are ramping up their spend on advertising to promote public health messages—or in the case of the U.S., to canvass.
The Saving Grace?
Even though advertising spend is expected to nosedive by almost 13% in 2020, this figure excludes political advertising. When taking that into account, the decline becomes a slightly more manageable 7.6%
Moreover, according to industry research firm Kantar, advertising spend for the 2020 U.S. election is estimated to reach $7 billion—the same as Amazon’s 2019 spend—making it the most expensive election of all time.
Can political advertising be the key to the advertising industry bouncing back again?


Markets
U.S. Debt Interest Payments Reach $1 Trillion
U.S. debt interest payments have surged past the $1 trillion dollar mark, amid high interest rates and an ever-expanding debt burden.


U.S. Debt Interest Payments Reach $1 Trillion
This was originally posted on our Voronoi app. Download the app for free on iOS or Android and discover incredible data-driven charts from a variety of trusted sources.
The cost of paying for America’s national debt crossed the $1 trillion dollar mark in 2023, driven by high interest rates and a record $34 trillion mountain of debt.
Over the last decade, U.S. debt interest payments have more than doubled amid vast government spending during the pandemic crisis. As debt payments continue to soar, the Congressional Budget Office (CBO) reported that debt servicing costs surpassed defense spending for the first time ever this year.
This graphic shows the sharp rise in U.S. debt payments, based on data from the Federal Reserve.
A $1 Trillion Interest Bill, and Growing
Below, we show how U.S. debt interest payments have risen at a faster pace than at another time in modern history:
| Date | Interest Payments | U.S. National Debt |
|---|---|---|
| 2023 | $1.0T | $34.0T |
| 2022 | $830B | $31.4T |
| 2021 | $612B | $29.6T |
| 2020 | $518B | $27.7T |
| 2019 | $564B | $23.2T |
| 2018 | $571B | $22.0T |
| 2017 | $493B | $20.5T |
| 2016 | $460B | $20.0T |
| 2015 | $435B | $18.9T |
| 2014 | $442B | $18.1T |
| 2013 | $425B | $17.2T |
| 2012 | $417B | $16.4T |
| 2011 | $433B | $15.2T |
| 2010 | $400B | $14.0T |
| 2009 | $354B | $12.3T |
| 2008 | $380B | $10.7T |
| 2007 | $414B | $9.2T |
| 2006 | $387B | $8.7T |
| 2005 | $355B | $8.2T |
| 2004 | $318B | $7.6T |
| 2003 | $294B | $7.0T |
| 2002 | $298B | $6.4T |
| 2001 | $318B | $5.9T |
| 2000 | $353B | $5.7T |
| 1999 | $353B | $5.8T |
| 1998 | $360B | $5.6T |
| 1997 | $368B | $5.5T |
| 1996 | $362B | $5.3T |
| 1995 | $357B | $5.0T |
| 1994 | $334B | $4.8T |
| 1993 | $311B | $4.5T |
| 1992 | $306B | $4.2T |
| 1991 | $308B | $3.8T |
| 1990 | $298B | $3.4T |
| 1989 | $275B | $3.0T |
| 1988 | $254B | $2.7T |
| 1987 | $240B | $2.4T |
| 1986 | $225B | $2.2T |
| 1985 | $219B | $1.9T |
| 1984 | $205B | $1.7T |
| 1983 | $176B | $1.4T |
| 1982 | $157B | $1.2T |
| 1981 | $142B | $1.0T |
| 1980 | $113B | $930.2B |
| 1979 | $96B | $845.1B |
| 1978 | $84B | $789.2B |
| 1977 | $69B | $718.9B |
| 1976 | $61B | $653.5B |
| 1975 | $55B | $576.6B |
| 1974 | $50B | $492.7B |
| 1973 | $45B | $469.1B |
| 1972 | $39B | $448.5B |
| 1971 | $36B | $424.1B |
| 1970 | $35B | $389.2B |
| 1969 | $30B | $368.2B |
| 1968 | $25B | $358.0B |
| 1967 | $23B | $344.7B |
| 1966 | $21B | $329.3B |
Interest payments represent seasonally adjusted annual rate at the end of Q4.
At current rates, the U.S. national debt is growing by a remarkable $1 trillion about every 100 days, equal to roughly $3.6 trillion per year.
As the national debt has ballooned, debt payments even exceeded Medicaid outlays in 2023—one of the government’s largest expenditures. On average, the U.S. spent more than $2 billion per day on interest costs last year. Going further, the U.S. government is projected to spend a historic $12.4 trillion on interest payments over the next decade, averaging about $37,100 per American.
Exacerbating matters is that the U.S. is running a steep deficit, which stood at $1.1 trillion for the first six months of fiscal 2024. This has accelerated due to the 43% increase in debt servicing costs along with a $31 billion dollar increase in defense spending from a year earlier. Additionally, a $30 billion increase in funding for the Federal Deposit Insurance Corporation in light of the regional banking crisis last year was a major contributor to the deficit increase.
Overall, the CBO forecasts that roughly 75% of the federal deficit’s increase will be due to interest costs by 2034.

-

 Real Estate2 weeks ago
Visualizing America’s Shortage of Affordable Homes
-

 Technology1 week ago
Ranked: Semiconductor Companies by Industry Revenue Share
-

 Money1 week ago
Which States Have the Highest Minimum Wage in America?
-

 Real Estate1 week ago
Ranked: The Most Valuable Housing Markets in America
-

 Business1 week ago
Charted: Big Four Market Share by S&P 500 Audits
-

 AI2 weeks ago
The Stock Performance of U.S. Chipmakers So Far in 2024
-

 Misc2 weeks ago
Almost Every EV Stock is Down After Q1 2024
-

 Money2 weeks ago
Where Does One U.S. Tax Dollar Go?