Markets
United Airlines: Visualizing the Numbers Behind the Crisis
The people in Pepsi’s marketing and PR departments must be relieved, because the internet’s viral outrage is finally being channeled in a different direction.
This time the fury is targeted towards United Airlines – a brand that is in full-blown crisis mode after a bloodied passenger was forcibly dragged off a plane, and millions of people witnessed videos of the incident being spread over social media.
Two days into the crisis, here are some charts that will help give context around what happened, as well as the potential effect on the United brand itself.
Damage Done?
First, let’s take a look at what’s happened to United’s stock price since the incident:
![]()
While some public relations crises have minimal effects on the long-term financial performance of companies, this market reaction is an interesting gauge to consider.
The stock’s lowest point today was -4.3% below the open, which is equal to a nearly $1 billion loss in market capitalization. At that point, it was speculated that Warren Buffett’s Berkshire Hathaway, which owns 9% of all outstanding shares of United Continental Holdings Inc., could lose up to $87 million.
The market clearly saw the crisis as creating risk around United’s fundamental business, but the stock has mostly recovered since those intraday lows. That said, if there are reports of top line revenue being affected because of boycotts or other issues, then the incident’s impact on the stock price could easily re-surface.
Social Media Blowback
With today’s interconnected world, a public relations crisis can start with one tweet. Here’s the snowball effect in brand mentions of United that occurred on April 10th:
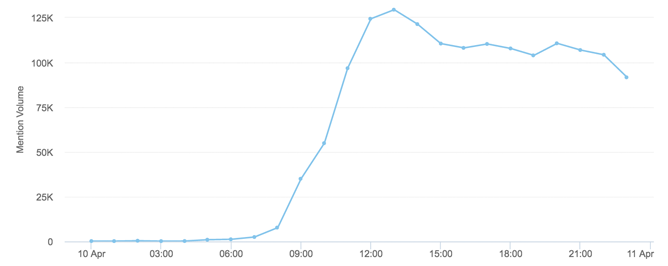
Courtesy of: Brandwatch
Here’s another look. This time, it’s a comparison of mentions over the last 21 days.
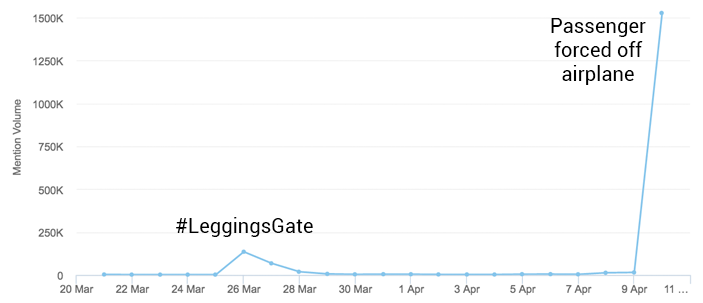
Courtesy of: Brandwatch
Yes, it’s only been about two weeks since United’s last PR crisis, called #LeggingsGate. As you can see, however, the most recent disaster is many times worse in terms of mentions.
With millions of references to the United Airlines brand occurring on social media, here is the split between positive and negative sentiment as of April 10th::
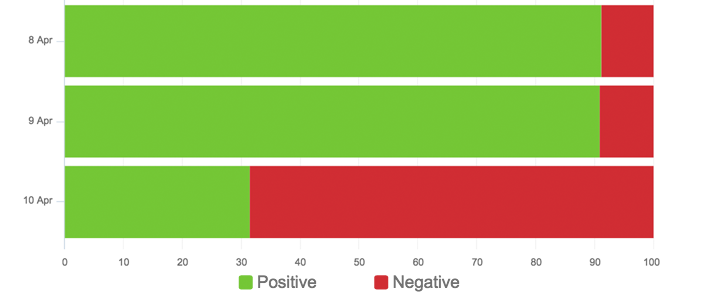
Courtesy of: Brandwatch
Denied Boarding Rates
But how big of a problem is making passengers deboard a plane, in the first place?
The next chart shows denied boarding rates, inclusive of voluntary and involuntary activity, from January to September 2016:
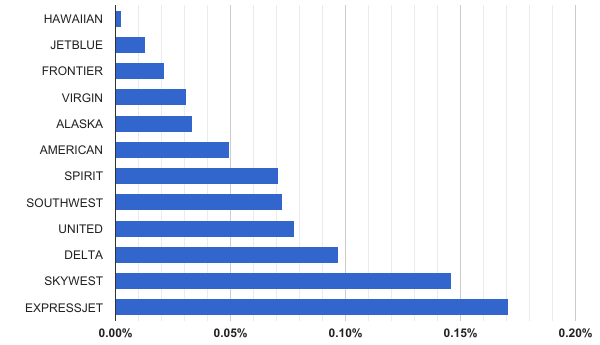
Data: U.S. Dept of Transportation
United and Delta are the two worst offenders here, with denied boarding rates that are worse than American, Virgin, Alaska, JetBlue, or Southwest.
Lastly, here’s the same figures, except contrasting voluntary vs. involuntary denied boarding rates from January to September 2016:
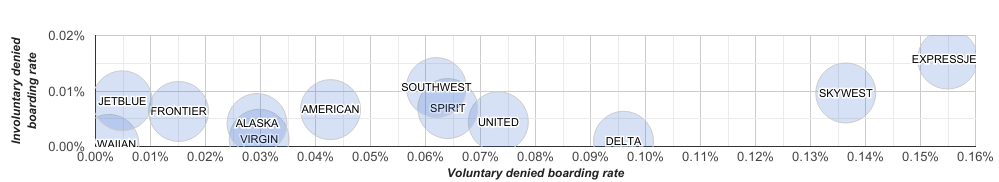
Data: U.S. Dept of Transportation
Southwest and ExpressJet lead the way with the most involuntary denied boardings, and United Airlines is in the middle of the pack. However, in terms of voluntary denied boardings, United and Delta have much higher rates than other major airlines such as American or Virgin.


Markets
U.S. Debt Interest Payments Reach $1 Trillion
U.S. debt interest payments have surged past the $1 trillion dollar mark, amid high interest rates and an ever-expanding debt burden.


U.S. Debt Interest Payments Reach $1 Trillion
This was originally posted on our Voronoi app. Download the app for free on iOS or Android and discover incredible data-driven charts from a variety of trusted sources.
The cost of paying for America’s national debt crossed the $1 trillion dollar mark in 2023, driven by high interest rates and a record $34 trillion mountain of debt.
Over the last decade, U.S. debt interest payments have more than doubled amid vast government spending during the pandemic crisis. As debt payments continue to soar, the Congressional Budget Office (CBO) reported that debt servicing costs surpassed defense spending for the first time ever this year.
This graphic shows the sharp rise in U.S. debt payments, based on data from the Federal Reserve.
A $1 Trillion Interest Bill, and Growing
Below, we show how U.S. debt interest payments have risen at a faster pace than at another time in modern history:
| Date | Interest Payments | U.S. National Debt |
|---|---|---|
| 2023 | $1.0T | $34.0T |
| 2022 | $830B | $31.4T |
| 2021 | $612B | $29.6T |
| 2020 | $518B | $27.7T |
| 2019 | $564B | $23.2T |
| 2018 | $571B | $22.0T |
| 2017 | $493B | $20.5T |
| 2016 | $460B | $20.0T |
| 2015 | $435B | $18.9T |
| 2014 | $442B | $18.1T |
| 2013 | $425B | $17.2T |
| 2012 | $417B | $16.4T |
| 2011 | $433B | $15.2T |
| 2010 | $400B | $14.0T |
| 2009 | $354B | $12.3T |
| 2008 | $380B | $10.7T |
| 2007 | $414B | $9.2T |
| 2006 | $387B | $8.7T |
| 2005 | $355B | $8.2T |
| 2004 | $318B | $7.6T |
| 2003 | $294B | $7.0T |
| 2002 | $298B | $6.4T |
| 2001 | $318B | $5.9T |
| 2000 | $353B | $5.7T |
| 1999 | $353B | $5.8T |
| 1998 | $360B | $5.6T |
| 1997 | $368B | $5.5T |
| 1996 | $362B | $5.3T |
| 1995 | $357B | $5.0T |
| 1994 | $334B | $4.8T |
| 1993 | $311B | $4.5T |
| 1992 | $306B | $4.2T |
| 1991 | $308B | $3.8T |
| 1990 | $298B | $3.4T |
| 1989 | $275B | $3.0T |
| 1988 | $254B | $2.7T |
| 1987 | $240B | $2.4T |
| 1986 | $225B | $2.2T |
| 1985 | $219B | $1.9T |
| 1984 | $205B | $1.7T |
| 1983 | $176B | $1.4T |
| 1982 | $157B | $1.2T |
| 1981 | $142B | $1.0T |
| 1980 | $113B | $930.2B |
| 1979 | $96B | $845.1B |
| 1978 | $84B | $789.2B |
| 1977 | $69B | $718.9B |
| 1976 | $61B | $653.5B |
| 1975 | $55B | $576.6B |
| 1974 | $50B | $492.7B |
| 1973 | $45B | $469.1B |
| 1972 | $39B | $448.5B |
| 1971 | $36B | $424.1B |
| 1970 | $35B | $389.2B |
| 1969 | $30B | $368.2B |
| 1968 | $25B | $358.0B |
| 1967 | $23B | $344.7B |
| 1966 | $21B | $329.3B |
Interest payments represent seasonally adjusted annual rate at the end of Q4.
At current rates, the U.S. national debt is growing by a remarkable $1 trillion about every 100 days, equal to roughly $3.6 trillion per year.
As the national debt has ballooned, debt payments even exceeded Medicaid outlays in 2023—one of the government’s largest expenditures. On average, the U.S. spent more than $2 billion per day on interest costs last year. Going further, the U.S. government is projected to spend a historic $12.4 trillion on interest payments over the next decade, averaging about $37,100 per American.
Exacerbating matters is that the U.S. is running a steep deficit, which stood at $1.1 trillion for the first six months of fiscal 2024. This has accelerated due to the 43% increase in debt servicing costs along with a $31 billion dollar increase in defense spending from a year earlier. Additionally, a $30 billion increase in funding for the Federal Deposit Insurance Corporation in light of the regional banking crisis last year was a major contributor to the deficit increase.
Overall, the CBO forecasts that roughly 75% of the federal deficit’s increase will be due to interest costs by 2034.

-

 Money2 weeks ago
Which States Have the Highest Minimum Wage in America?
-

 Misc1 week ago
Airline Incidents: How Do Boeing and Airbus Compare?
-

 Environment1 week ago
Top Countries By Forest Growth Since 2001
-

 United States2 weeks ago
Where U.S. Inflation Hit the Hardest in March 2024
-

 Demographics2 weeks ago
The Smallest Gender Wage Gaps in OECD Countries
-

 Markets2 weeks ago
The Top 10 States by Real GDP Growth in 2023
-

 Countries2 weeks ago
Population Projections: The World’s 6 Largest Countries in 2075
-

 Travel2 weeks ago
Ranked: The World’s Top Flight Routes, by Revenue