Markets
The U.S. Stock Market in 2021: Best and Worst Performing Sectors


The Stock Market in 2021: Best and Worst Performing Sectors
It was another eventful year—and while it may not quite compare to the pandemonium experienced in 2020, it was still jam-packed with market moving events, such as:
- The highly-anticipated rollout of COVID-19 vaccines
- Supply chain disruptions and an ongoing semiconductor shortage
- Record-setting stimulus spending and debt accumulation by governments around the world
- The emergence of new variants of concern such as Delta and Omicron
- Big political upsets and the Capitol riots
- Rising evidence of (non-transitory) inflation
Let’s take a look at which sectors thrived during the twists and turns of 2021—and which couldn’t stomach the volatility.
Want extra insight into 2022?

Gain access to our 2022 Global Forecast series
Winners and Losers of 2021, by Sector
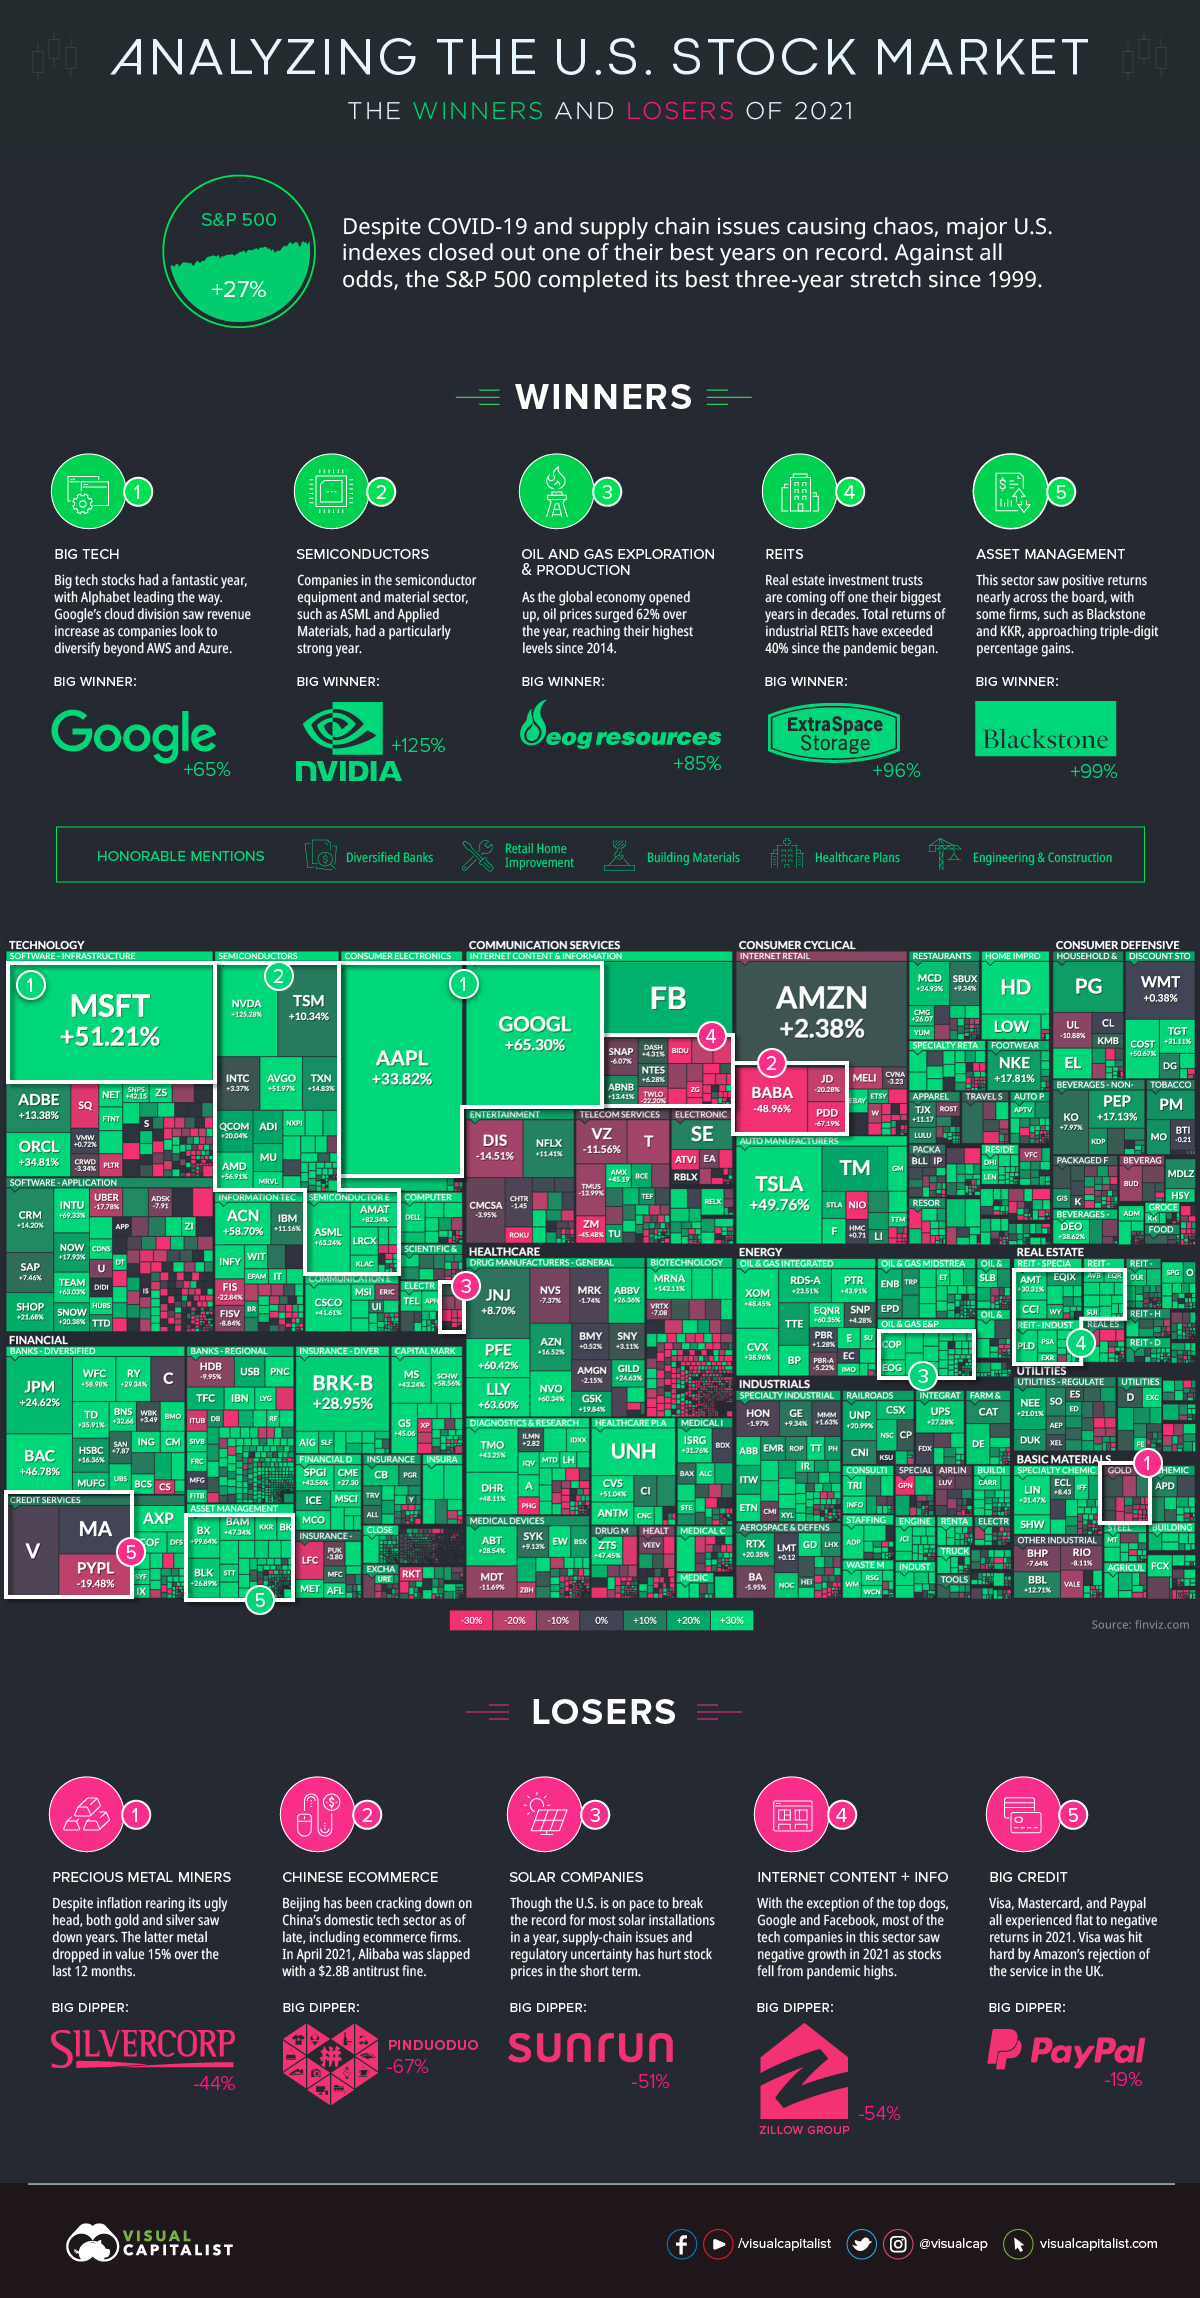
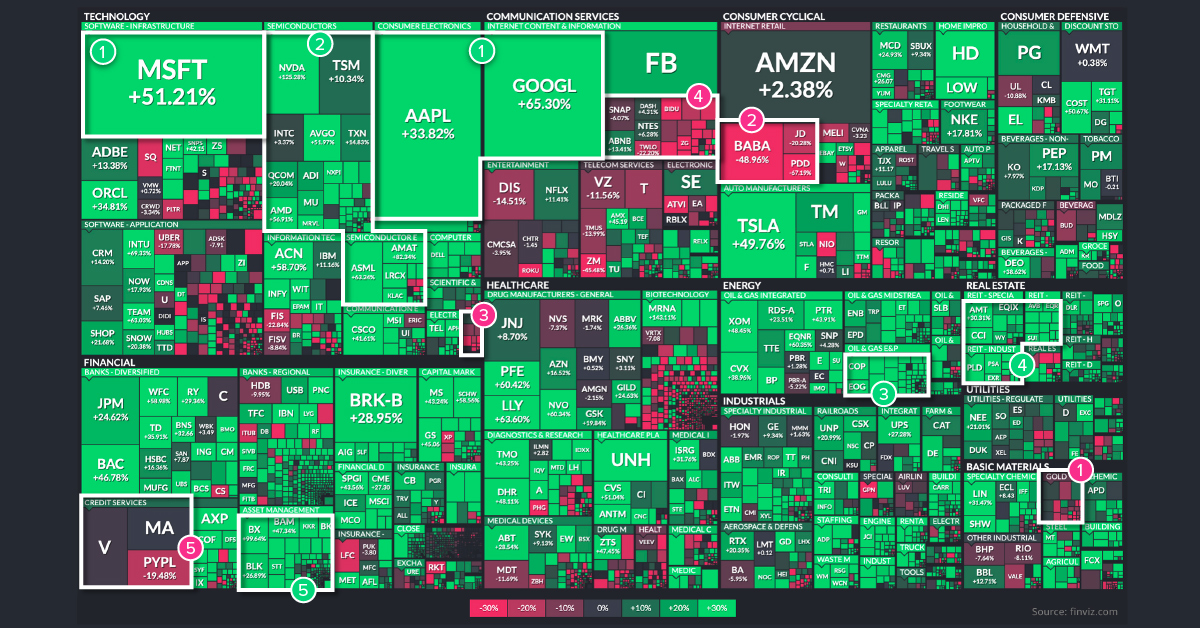
Our visualization today uses an augmented screenshot of the FinViz treemap, showing the final numbers posted for major U.S.-listed companies, sorted by sector and industry.
Here are the big beneficiaries of last year, along with those that got left behind.
The Winners
1. Big Tech
Over recent years, it’s been no surprise to see Big Tech near the top of any list. In 2021, Alphabet continued its tear, soaring 65% to hit a $2 trillion market cap.
Microsoft finished up the year 51%, Apple up 34%, and even Meta Platforms (née Facebook) posted double-digit gains. Only Amazon had single-digit gains, up 2.4% in 2021.
2. Semiconductors
Who benefitted most from the ongoing semiconductor shortage? Those that design or manufacture them, of course.
Nvidia, for example, more than doubled its share price over the course of the year, with 125% growth. Other companies in the semiconductor equipment and materials space, such as ASML and Applied Materials, saw gains above 60%.
3. Oil and Gas Exploration & Production
2020 was touch-and-go for oil prices, with futures even sliding negative at one point. However, the most recent year was much kinder to those in the energy industry.
The WTI price started the year below $50 per barrel, but finished the year at $75 per barrel—a swing that makes a big difference in the economics of each barrel.
4. Real Estate Investment Trusts (REITs)
It was one of the biggest years in decades for REITs, which saw the FTSE Nareit All Equity REITs index have its best performance since 1976.
Those that know REITs are aware that returns vary by property sector, and this remains the case here. Specifically, it was industrial REITs—and especially self-storage REITs—that outperformed. Extra Space Storage, a REIT that invests in self-storage units, finished up the year 96% and is the perfect example of this.
5. Asset Management
With record-low interest rates and continued upheaval from COVID-19, it sets a perfect stage for opportunistic private equity firms.
The asset management industry as a whole did well in 2021, but specifically it was PE firms like Blackstone and KKR that took advantage, posting gains of 99% and 84% respectfully.
Honorable Mentions:
Banks, Retail Home Improvement, Building Materials, Healthcare Plans, Engineering & Construction
The Losers
1. Precious Metal Miners
Inflation took off in 2021, and a usual beneficiary of this is the precious metals sector.
However, in the last 12 months, this has not been the case. Both gold and silver finished with negative returns on the year, which hurt precious metal miners.
2. Chinese Ecommerce
Beijing has been cracking down on China’s domestic tech sector as of late, and this has had a knock-on effect on companies like Pinduoduo, Alibaba, Baidu, and JD.com, which saw a collective collapse in their share prices.
All were down double digits, but Pinduoduo—the largest agriculture-focused technology platform in China—saw the highest amount of drag, falling over 67% on the year.
3. Solar Companies
Solar installations in the U.S. are chugging along at a record pace, as expected.
However, both regulatory uncertainty and supply chain problems have hampered stock prices in the short term. That’s why companies like Sunrun, a residential solar panel company, saw a 51% dip in stock performance in 2021.
4. Internet Content and Information
Big tech continued its surge, but other tech-enabled content and information companies saw tougher years. One example of this is Zillow, which shuttered the doors on its home flipping operation after realizing losses of $500 million.
Zillow stock was down 54% on the year, and has laid off a quarter of its staff.
5. Big Credit
It was a mediocre year for the big credit card companies like Visa and Mastercard, which were both flat in terms of stock market performance. Meanwhile, PayPal fell 19%.
According to billionaire investor Chamath Palihapitiya, 2022 may not be any better. Days ago, he predicted that both Visa and Mastercard will be the biggest business failures in the coming year.


Markets
U.S. Debt Interest Payments Reach $1 Trillion
U.S. debt interest payments have surged past the $1 trillion dollar mark, amid high interest rates and an ever-expanding debt burden.


U.S. Debt Interest Payments Reach $1 Trillion
This was originally posted on our Voronoi app. Download the app for free on iOS or Android and discover incredible data-driven charts from a variety of trusted sources.
The cost of paying for America’s national debt crossed the $1 trillion dollar mark in 2023, driven by high interest rates and a record $34 trillion mountain of debt.
Over the last decade, U.S. debt interest payments have more than doubled amid vast government spending during the pandemic crisis. As debt payments continue to soar, the Congressional Budget Office (CBO) reported that debt servicing costs surpassed defense spending for the first time ever this year.
This graphic shows the sharp rise in U.S. debt payments, based on data from the Federal Reserve.
A $1 Trillion Interest Bill, and Growing
Below, we show how U.S. debt interest payments have risen at a faster pace than at another time in modern history:
| Date | Interest Payments | U.S. National Debt |
|---|---|---|
| 2023 | $1.0T | $34.0T |
| 2022 | $830B | $31.4T |
| 2021 | $612B | $29.6T |
| 2020 | $518B | $27.7T |
| 2019 | $564B | $23.2T |
| 2018 | $571B | $22.0T |
| 2017 | $493B | $20.5T |
| 2016 | $460B | $20.0T |
| 2015 | $435B | $18.9T |
| 2014 | $442B | $18.1T |
| 2013 | $425B | $17.2T |
| 2012 | $417B | $16.4T |
| 2011 | $433B | $15.2T |
| 2010 | $400B | $14.0T |
| 2009 | $354B | $12.3T |
| 2008 | $380B | $10.7T |
| 2007 | $414B | $9.2T |
| 2006 | $387B | $8.7T |
| 2005 | $355B | $8.2T |
| 2004 | $318B | $7.6T |
| 2003 | $294B | $7.0T |
| 2002 | $298B | $6.4T |
| 2001 | $318B | $5.9T |
| 2000 | $353B | $5.7T |
| 1999 | $353B | $5.8T |
| 1998 | $360B | $5.6T |
| 1997 | $368B | $5.5T |
| 1996 | $362B | $5.3T |
| 1995 | $357B | $5.0T |
| 1994 | $334B | $4.8T |
| 1993 | $311B | $4.5T |
| 1992 | $306B | $4.2T |
| 1991 | $308B | $3.8T |
| 1990 | $298B | $3.4T |
| 1989 | $275B | $3.0T |
| 1988 | $254B | $2.7T |
| 1987 | $240B | $2.4T |
| 1986 | $225B | $2.2T |
| 1985 | $219B | $1.9T |
| 1984 | $205B | $1.7T |
| 1983 | $176B | $1.4T |
| 1982 | $157B | $1.2T |
| 1981 | $142B | $1.0T |
| 1980 | $113B | $930.2B |
| 1979 | $96B | $845.1B |
| 1978 | $84B | $789.2B |
| 1977 | $69B | $718.9B |
| 1976 | $61B | $653.5B |
| 1975 | $55B | $576.6B |
| 1974 | $50B | $492.7B |
| 1973 | $45B | $469.1B |
| 1972 | $39B | $448.5B |
| 1971 | $36B | $424.1B |
| 1970 | $35B | $389.2B |
| 1969 | $30B | $368.2B |
| 1968 | $25B | $358.0B |
| 1967 | $23B | $344.7B |
| 1966 | $21B | $329.3B |
Interest payments represent seasonally adjusted annual rate at the end of Q4.
At current rates, the U.S. national debt is growing by a remarkable $1 trillion about every 100 days, equal to roughly $3.6 trillion per year.
As the national debt has ballooned, debt payments even exceeded Medicaid outlays in 2023—one of the government’s largest expenditures. On average, the U.S. spent more than $2 billion per day on interest costs last year. Going further, the U.S. government is projected to spend a historic $12.4 trillion on interest payments over the next decade, averaging about $37,100 per American.
Exacerbating matters is that the U.S. is running a steep deficit, which stood at $1.1 trillion for the first six months of fiscal 2024. This has accelerated due to the 43% increase in debt servicing costs along with a $31 billion dollar increase in defense spending from a year earlier. Additionally, a $30 billion increase in funding for the Federal Deposit Insurance Corporation in light of the regional banking crisis last year was a major contributor to the deficit increase.
Overall, the CBO forecasts that roughly 75% of the federal deficit’s increase will be due to interest costs by 2034.

-

 Maps2 weeks ago
Mapped: Average Wages Across Europe
-

 Money1 week ago
Which States Have the Highest Minimum Wage in America?
-

 Real Estate1 week ago
Ranked: The Most Valuable Housing Markets in America
-

 Business1 week ago
Charted: Big Four Market Share by S&P 500 Audits
-

 AI1 week ago
The Stock Performance of U.S. Chipmakers So Far in 2024
-

 Automotive2 weeks ago
Almost Every EV Stock is Down After Q1 2024
-

 Money2 weeks ago
Where Does One U.S. Tax Dollar Go?
-

 Green2 weeks ago
Ranked: Top Countries by Total Forest Loss Since 2001