Personal Finance
Which U.S. States Have the Lowest Income Taxes?
Another U.S. tax deadline has passed, and you may be wondering how green the grass is on the other side of the state border. Today’s maps and charts, from cost information website HowMuch.net, show the difference in tax rates between states to help you discover which states pay the lowest income taxes.
Before we dive in to the data, it is worth noting that there are seven states that currently have zero interest tax, including Florida, Nevada, Texas, Alaska, South Dakota, Washington State and Wyoming. New Hampshire and Tennessee also have no income tax, but they do tax interest and dividends.
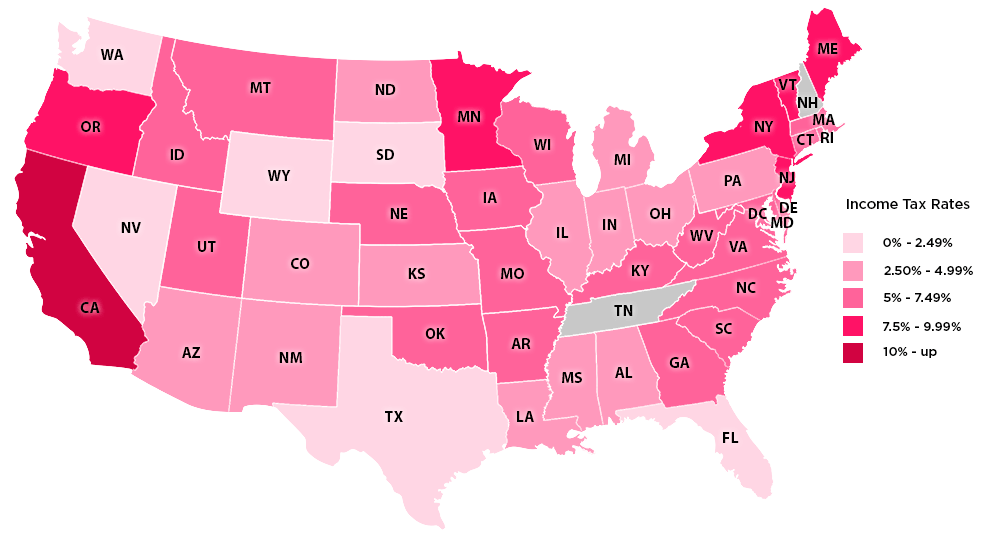
The other 41 states (and one district) all levy an income tax. Here’s the average amount paid in each state:
Average Income Tax
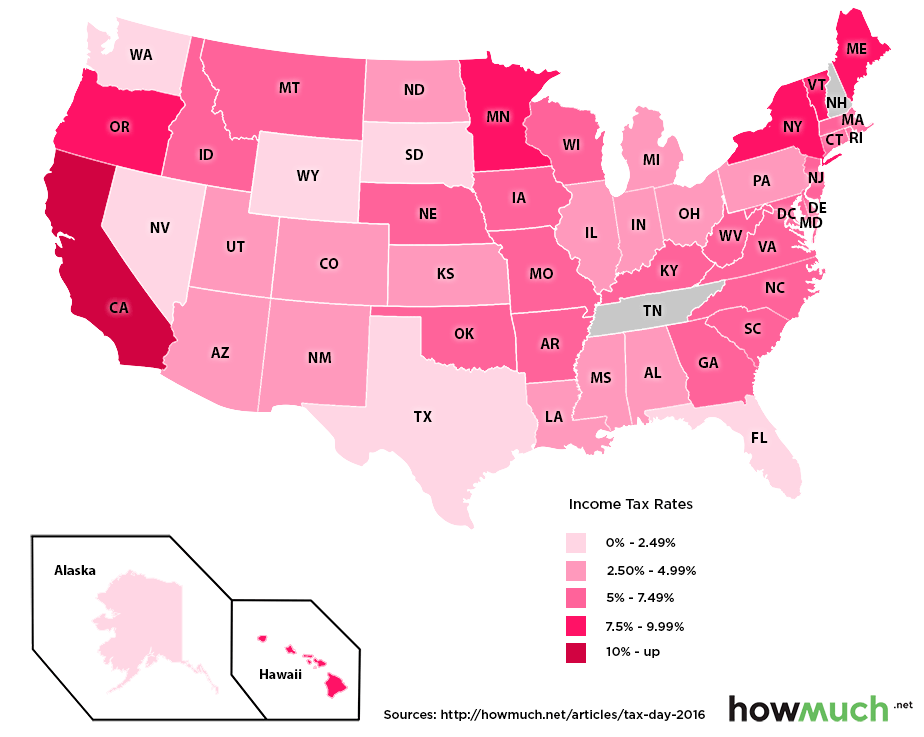
California has the highest average tax of any state at 10.4%. Oregon, Minnesota, Hawaii, DC, New York, Vermont, and Maine also have average state income taxes that are higher than 7.5%.
Aside from the states with zero income tax, there are also 14 that have average tax rates below 5%.
However, as HowMuch.net notes, the average isn’t necessarily the best indicator when it comes to this data. Since most tax schemes are progressive, the tax rates of most states vary heavily depending on the level of personal income each year.
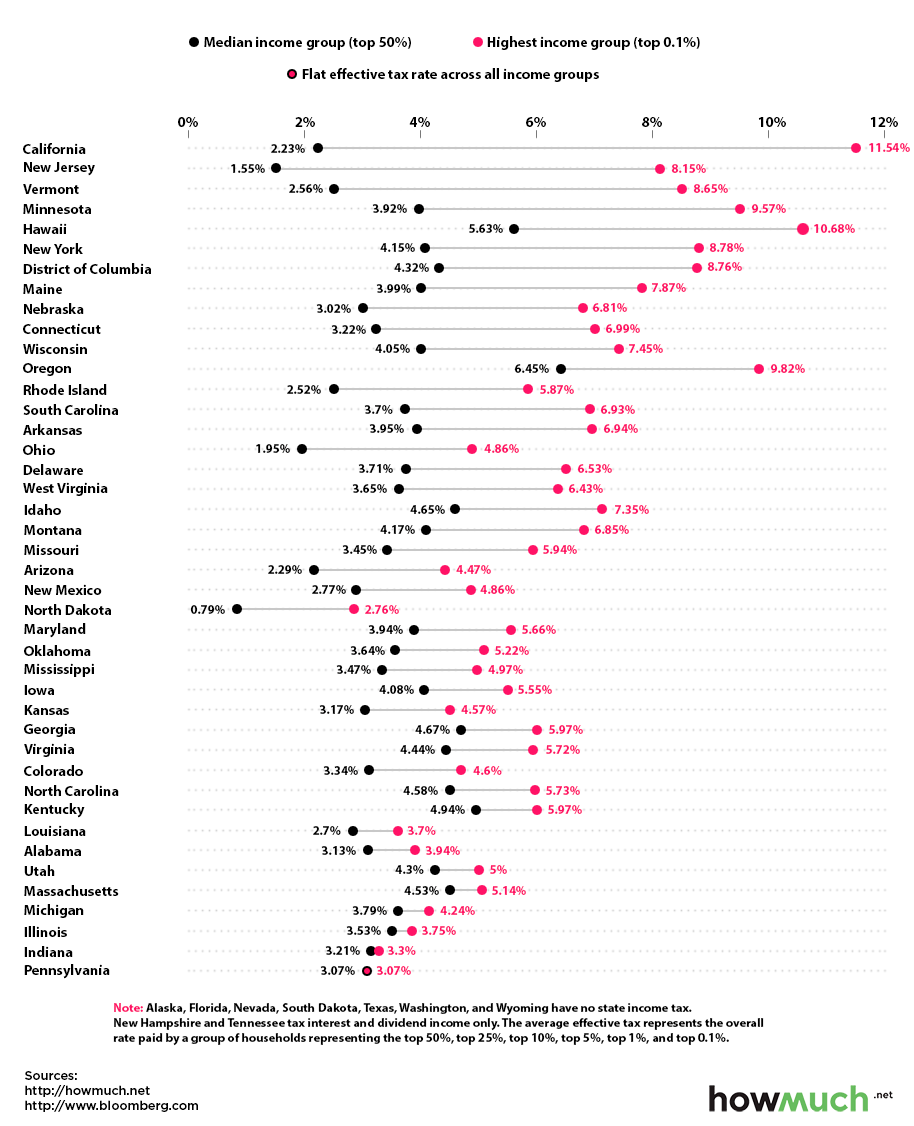
Here’s the difference between what the highest income group (top 0.1%) and the median income group (top 50%) are paying:
Income Tax Gap: Rate for Top 0.1% vs. Top 50%
Illustrated a different way, see how this changes based on moving up the tax bracket from the top 25% to the top 0.1%:
Income Tax Rate: Top 25%
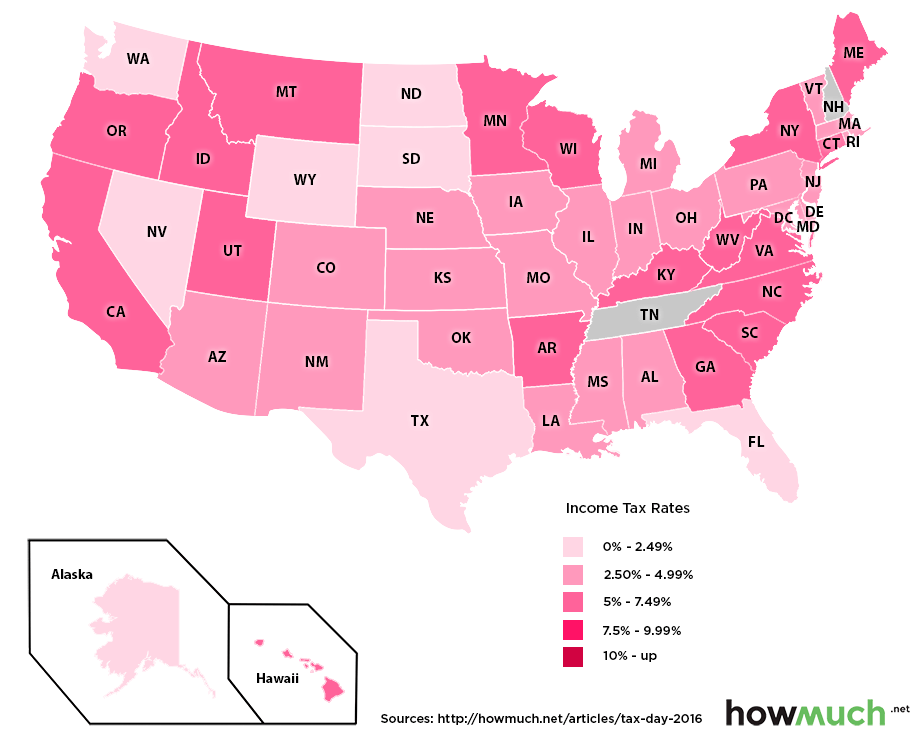
The top 25% of earners ($74,955 per year and up) pay the most in Oregon, which has a tax rate of 7.4%. Three other states charge 6% or more: Hawaii (6.89%), Idaho (6.05%) and Maine (6.00%).
Compare this to the top 0.1% bracket of earners ($1,860,848 per year and up):
Income Tax Rate: Top 0.1%
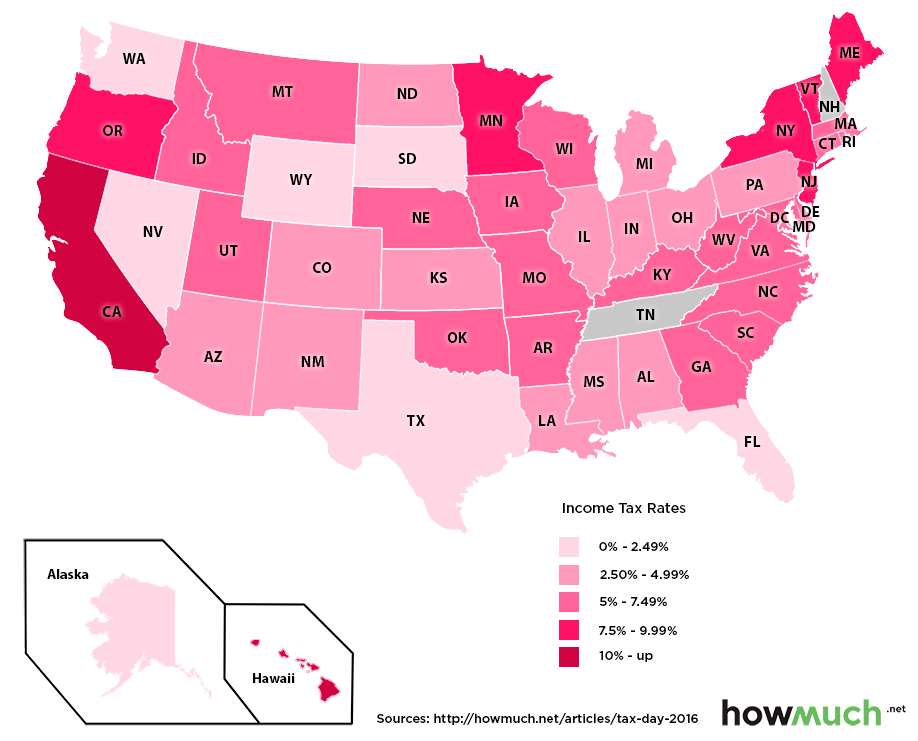
California now charges the most at 11.54%, while Oregon, Minnesota, and Hawaii all have rates hovering around 10%.


Personal Finance
Chart: The Declining Value of the U.S. Federal Minimum Wage
This graphic compares the nominal vs. inflation-adjusted value of the U.S. minimum wage, from 1940 to 2023.


The Declining Value of the U.S. Federal Minimum Wage
This was originally posted on our Voronoi app. Download the app for free on iOS or Android and discover incredible data-driven charts from a variety of trusted sources.
This graphic illustrates the history of the U.S. federal minimum wage using data compiled by Statista, in both nominal and real (inflation-adjusted) terms. The federal minimum wage was raised to $7.25 per hour in July 2009, where it has remained ever since.
Nominal vs. Real Value
The data we used to create this graphic can be found in the table below.
| Year | Nominal value ($/hour) | Real value ($/hour) |
|---|---|---|
| 1940 | 0.3 | 6.5 |
| 1945 | 0.4 | 6.82 |
| 1950 | 0.75 | 9.64 |
| 1955 | 0.75 | 8.52 |
| 1960 | 1 | 10.28 |
| 1965 | 1.25 | 12.08 |
| 1970 | 1.6 | 12.61 |
| 1975 | 2.1 | 12.04 |
| 1980 | 3.1 | 11.61 |
| 1985 | 3.35 | 9.51 |
| 1990 | 3.8 | 8.94 |
| 1995 | 4.25 | 8.49 |
| 2000 | 5.15 | 9.12 |
| 2005 | 5.15 | 8.03 |
| 2010 | 7.25 | 10.09 |
| 2015 | 7.25 | 9.3 |
| 2018 | 7.25 | 8.78 |
| 2019 | 7.25 | 8.61 |
| 2020 | 7.25 | 8.58 |
| 2021 | 7.25 | 8.24 |
| 2022 | 7.25 | 7.61 |
| 2023 | 7.25 | 7.25 |
What our graphic shows is how inflation has eroded the real value of the U.S. minimum wage over time, despite nominal increases.
For instance, consider the year 1960, when the federal minimum wage was $1 per hour. After accounting for inflation, this would be worth around $10.28 today!
The two lines converge at 2023 because the nominal and real value are identical in present day terms.
Many States Have Their Own Minimum Wage
According to the National Conference of State Legislatures (NCSL), 30 states and Washington, D.C. have implemented a minimum wage that is higher than $7.25.
The following states have adopted the federal minimum: Georgia, Idaho, Indiana, Iowa, Kansas, Kentucky, New Hampshire, North Carolina, North Dakota, Oklahoma, Pennsylvania, Texas, Utah, Wisconsin, and Wyoming.
Meanwhile, the states of Alabama, Louisiana, Mississippi, South Carolina, and Tennessee have no wage minimums, but have to follow the federal minimum.
How Does the U.S. Minimum Wage Rank Globally?
If you found this topic interesting, check out Mapped: Minimum Wage Around the World to see which countries have the highest minimum wage in monthly terms, as of January 2023.

-

 Green1 week ago
Ranked: The Countries With the Most Air Pollution in 2023
-

 Automotive2 weeks ago
Almost Every EV Stock is Down After Q1 2024
-

 AI2 weeks ago
The Stock Performance of U.S. Chipmakers So Far in 2024
-

 Markets2 weeks ago
Charted: Big Four Market Share by S&P 500 Audits
-

 Real Estate2 weeks ago
Ranked: The Most Valuable Housing Markets in America
-

 Money2 weeks ago
Which States Have the Highest Minimum Wage in America?
-

 AI2 weeks ago
Ranked: Semiconductor Companies by Industry Revenue Share
-

 Travel2 weeks ago
Ranked: The World’s Top Flight Routes, by Revenue