Mining
Visualizing U.S. Money Supply vs. Precious Metal Production in the COVID-19 Era
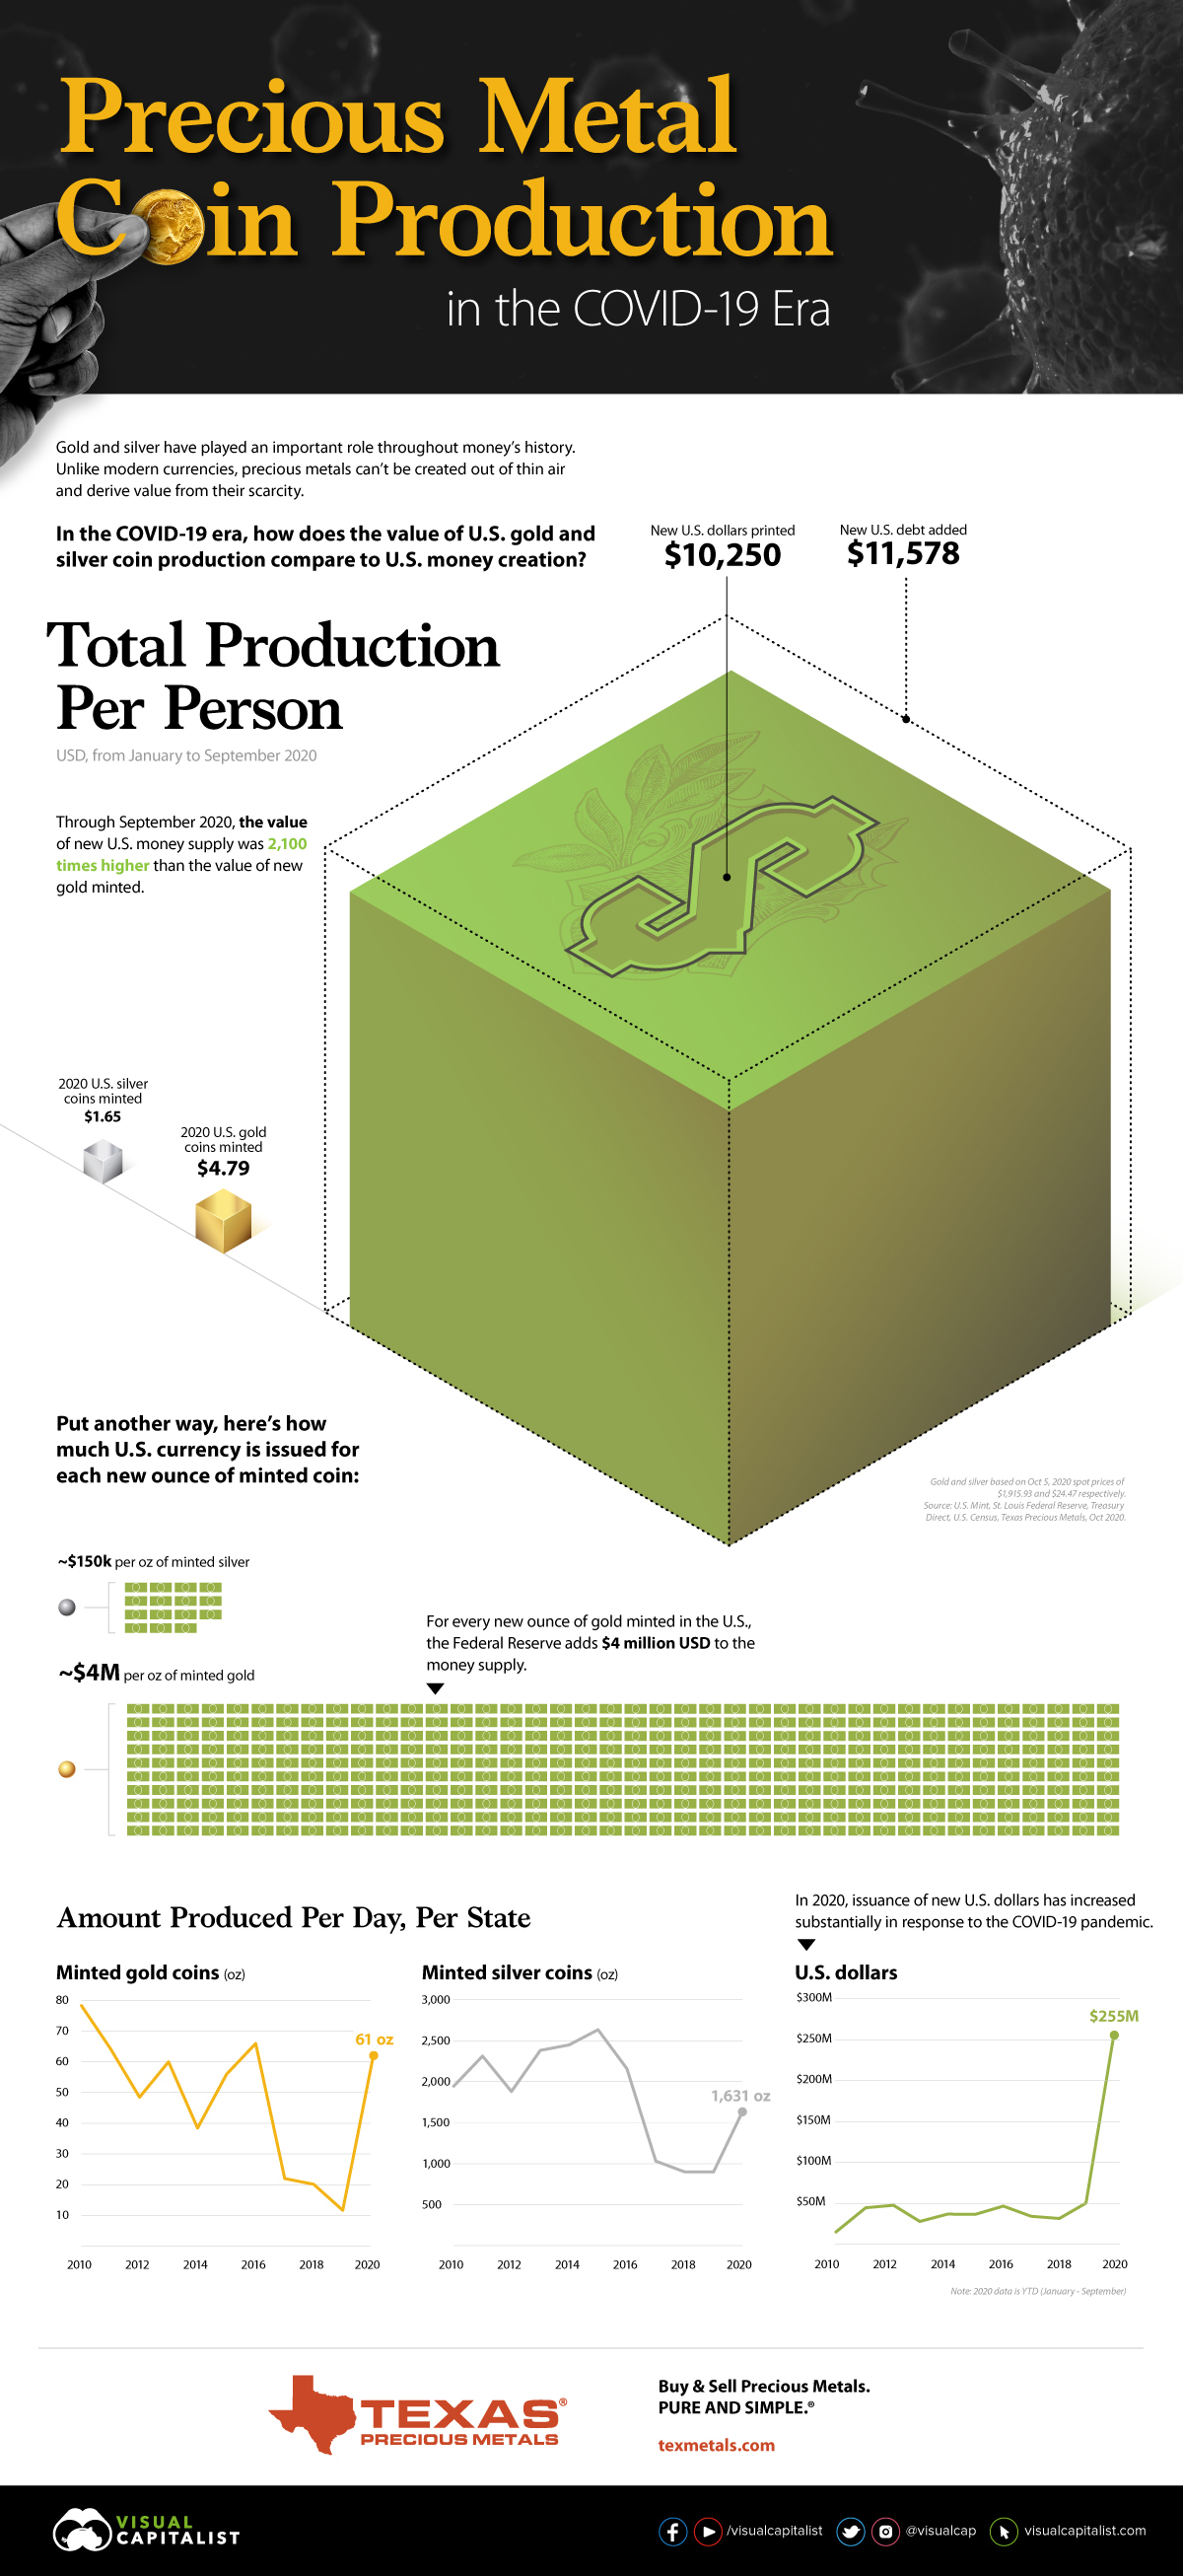
U.S. Precious Metal Coin Production in the COVID-19 Era
Gold and silver have played an important role in money throughout history. Unlike modern currencies, they can’t be created out of thin air and derive value from their scarcity.
In the COVID-19 era, this difference has become more prominent as countries print vast amounts of currency to support their suffering economies. This graphic from Texas Precious Metals highlights how the value of U.S. precious metal coin production compares to U.S. money creation.
Year to Date Production
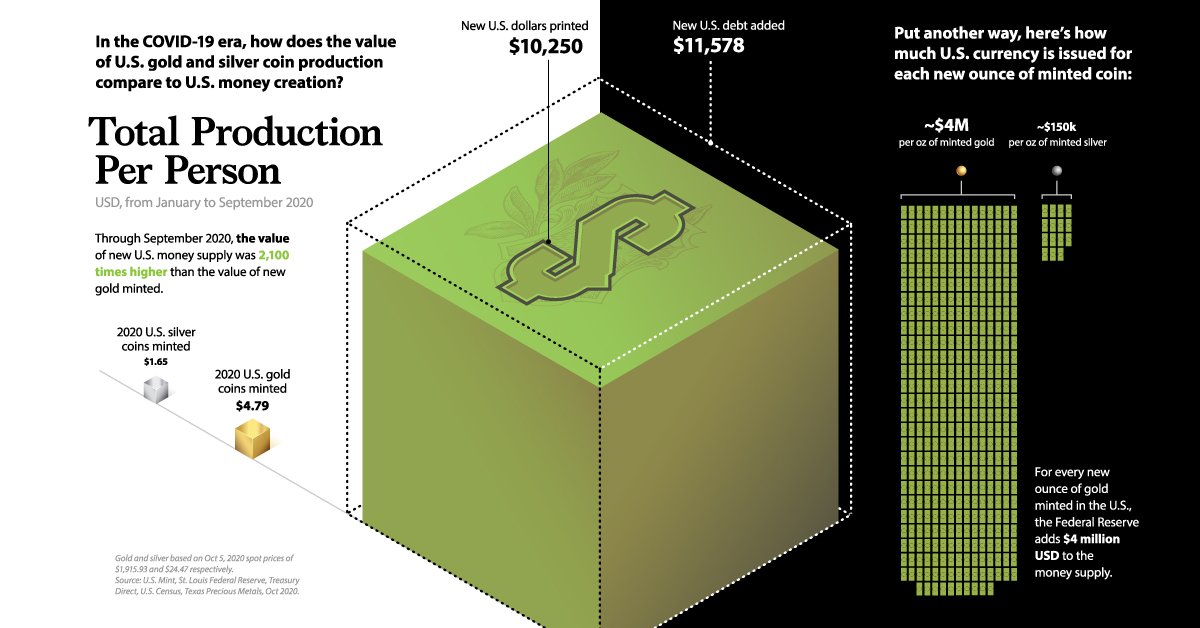
In this infographic, we have calculated the value of money supply added as well as bullion minted, and divided it by the U.S. population to get total production per person. Here’s how the January-September 2020 data breaks down:
| Total (Ounces) | Dollar Value | Dollar Value Per Person | |
|---|---|---|---|
| U.S. Gold Ounces | 826,000 | $1.6B | $4.79 |
| U.S. Silver Ounces | 22,261,500 | $544M | $1.65 |
| U.S. Money Supply | $3.4T | $10,250.16 | |
| U.S. Debt | $3.8T | $11,578.36 |
Gold and silver dollar values based on Oct 5, 2020 spot prices of $1,915.93 and $24.47 respectively.
The value of new U.S. money supply was more than 2,100 times higher than the value of new gold minted. Compared to minted silver, the value of new U.S. money supply was over 6,000 times higher.
Production Per Day, Per State Over Time
Here’s how production has changed on a per day, per state basis since 2010:
| 2010 | 2020 YTD (Jan-Sep) | Min-Max Production, 2010-2019 | |
|---|---|---|---|
| Minted Gold Coins | 78oz | 61oz | 12oz-78oz |
| Minted Silver Coins | 1,945oz | 1,631oz | 899oz-2,633oz |
| U.S. Dollars | $19M | $255M | $19M-$50M |
Year to date, U.S. precious metal coin production is within a normal historical range. If production were to continue at the current rate through December, gold would be above historical norms at 81 ounces and silver would be within the normal range at 2,175 ounces.
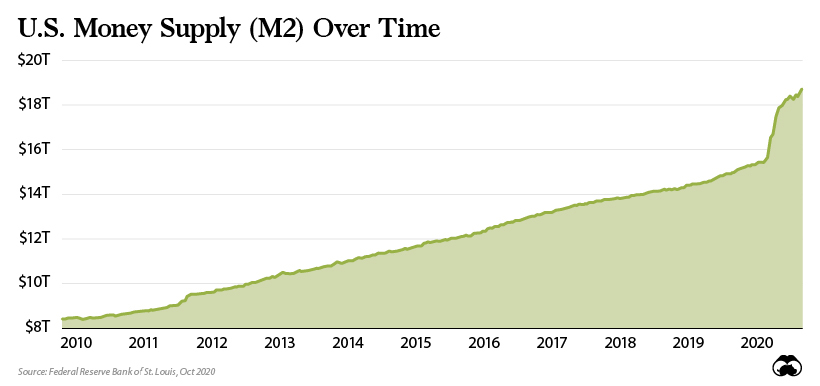
The issuance of U.S. dollars tells a different story. Over the last nine months, the U.S. has already added 400% more dollars to its money supply than it did in the entirety of 2019—and there’s still three months left to go in the year.
A Macroeconomic View
Of course, current economic conditions have been a catalyst for the ballooning money supply. In response to the COVID-19 pandemic, the U.S. government has issued over $3 trillion in fiscal stimulus. In turn, the U.S. Federal Reserve has increased the money supply by $3.4 trillion from January to September 2020.
Put another way, for every ounce of gold created in 2020 there has been $4 million U.S. dollars added to the money supply.
The question for those looking for safe haven investments is: which of these will ultimately hold their value better?


Lithium
Ranked: The Top 10 EV Battery Manufacturers in 2023
Asia dominates this ranking of the world’s largest EV battery manufacturers in 2023.


The Top 10 EV Battery Manufacturers in 2023
This was originally posted on our Voronoi app. Download the app for free on iOS or Android and discover incredible data-driven charts from a variety of trusted sources.
Despite efforts from the U.S. and EU to secure local domestic supply, all major EV battery manufacturers remain based in Asia.
In this graphic we rank the top 10 EV battery manufacturers by total battery deployment (measured in megawatt-hours) in 2023. The data is from EV Volumes.
Chinese Dominance
Contemporary Amperex Technology Co. Limited (CATL) has swiftly risen in less than a decade to claim the title of the largest global battery group.
The Chinese company now has a 34% share of the market and supplies batteries to a range of made-in-China vehicles, including the Tesla Model Y, SAIC’s MG4/Mulan, and various Li Auto models.
| Company | Country | 2023 Production (megawatt-hour) | Share of Total Production |
|---|---|---|---|
| CATL | 🇨🇳 China | 242,700 | 34% |
| BYD | 🇨🇳 China | 115,917 | 16% |
| LG Energy Solution | 🇰🇷 Korea | 108,487 | 15% |
| Panasonic | 🇯🇵 Japan | 56,560 | 8% |
| SK On | 🇰🇷 Korea | 40,711 | 6% |
| Samsung SDI | 🇰🇷 Korea | 35,703 | 5% |
| CALB | 🇨🇳 China | 23,493 | 3% |
| Farasis Energy | 🇨🇳 China | 16,527 | 2% |
| Envision AESC | 🇨🇳 China | 8,342 | 1% |
| Sunwoda | 🇨🇳 China | 6,979 | 1% |
| Other | - | 56,040 | 8% |
In 2023, BYD surpassed LG Energy Solution to claim second place. This was driven by demand from its own models and growth in third-party deals, including providing batteries for the made-in-Germany Tesla Model Y, Toyota bZ3, Changan UNI-V, Venucia V-Online, as well as several Haval and FAW models.
The top three battery makers (CATL, BYD, LG) collectively account for two-thirds (66%) of total battery deployment.
Once a leader in the EV battery business, Panasonic now holds the fourth position with an 8% market share, down from 9% last year. With its main client, Tesla, now sourcing batteries from multiple suppliers, the Japanese battery maker seems to be losing its competitive edge in the industry.
Overall, the global EV battery market size is projected to grow from $49 billion in 2022 to $98 billion by 2029, according to Fortune Business Insights.

-

 Markets1 week ago
U.S. Debt Interest Payments Reach $1 Trillion
-

 Markets2 weeks ago
Ranked: The Most Valuable Housing Markets in America
-

 Money2 weeks ago
Which States Have the Highest Minimum Wage in America?
-

 AI2 weeks ago
Ranked: Semiconductor Companies by Industry Revenue Share
-

 Markets2 weeks ago
Ranked: The World’s Top Flight Routes, by Revenue
-

 Countries2 weeks ago
Population Projections: The World’s 6 Largest Countries in 2075
-

 Markets2 weeks ago
The Top 10 States by Real GDP Growth in 2023
-

 Money2 weeks ago
The Smallest Gender Wage Gaps in OECD Countries