Datastream
A Decade of NBA Profit: How Did the League Fare in 2020?


The Briefing
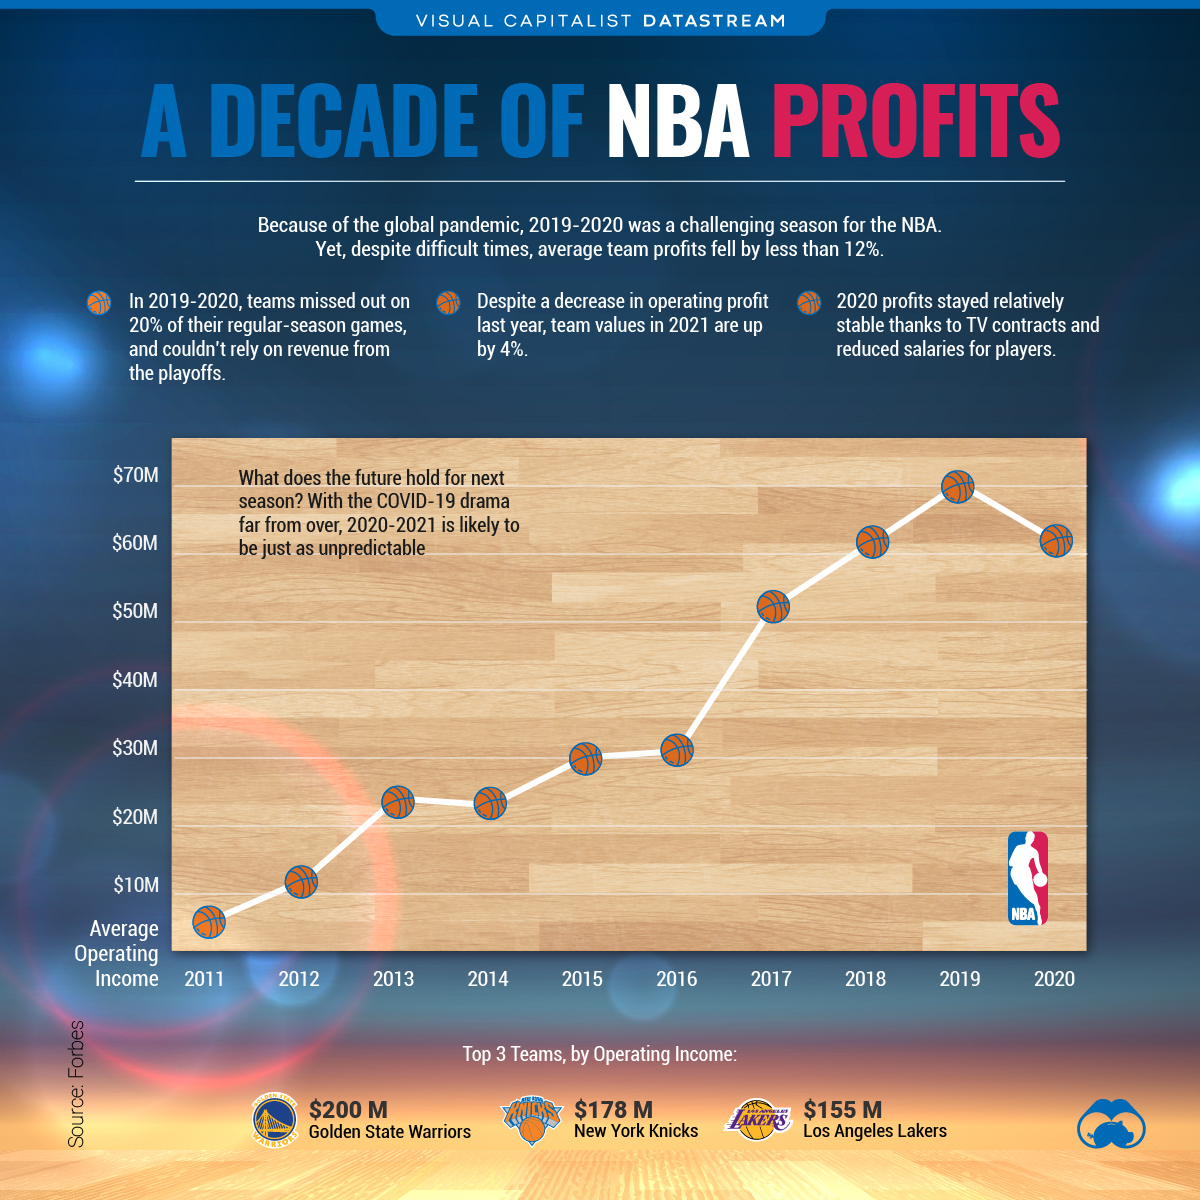
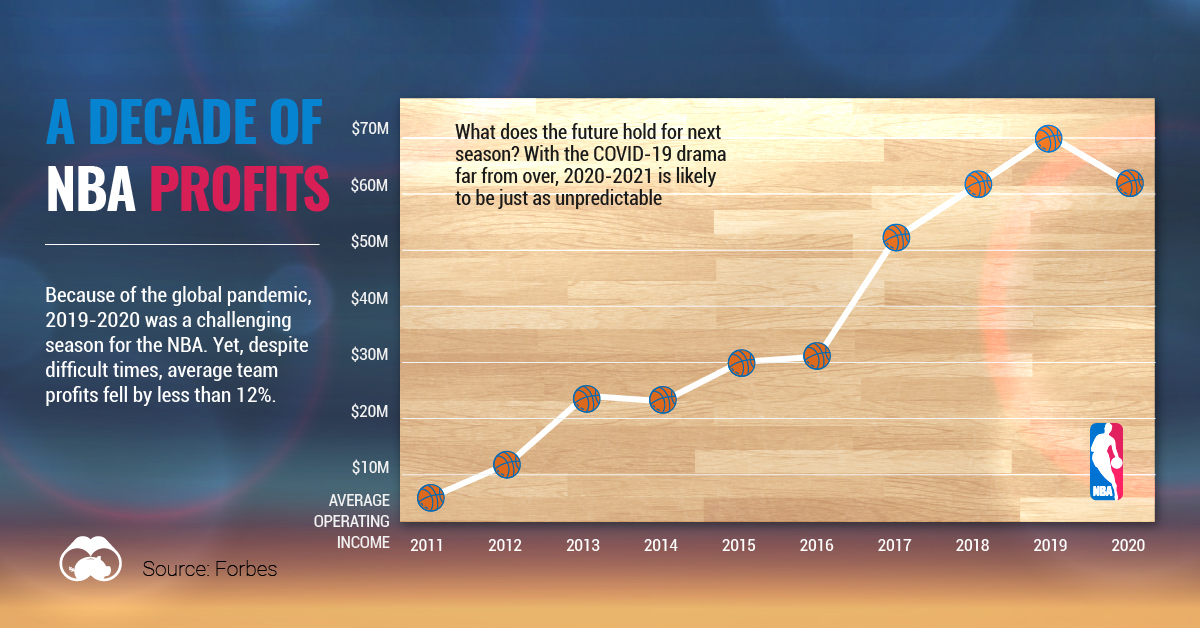
- Because of the global pandemic, NBA teams missed out on approximately 20% of their regular-season home games in 2019-20
- Despite this, average team profits in 2020 fell by less than 12% compared to the year prior, and team values are up 4% in 2021
- The New York Knicks are once again the most valuable team, for the sixth year in a row
A Decade of NBA Profit: How Did The League Fare in 2020?
The NBA has gained undeniable traction over the last decade, at least from a financial standpoint.
In 2011, 22 of the 30 teams were losing money, and the average operating income per team sat at $6 million. But, fast forward to 2020, and every team in the league was profitable, with average operating income surging to $62 million.
Here’s a look at team profitability since 2011, according to Forbes:
| Year | Average Operating Income | YOY Change |
|---|---|---|
| 2011 | $6M | -- |
| 2012 | $12M | 100% |
| 2013 | $24M | 100% |
| 2014 | $23M | -4.2% |
| 2015 | $30M | 30.4% |
| 2016 | $31M | 3.3% |
| 2017 | $52M | 67.7% |
| 2018 | $61M | 17.3% |
| 2019 | $70M | 14.8% |
| 2020 | $62M | -11.4% |
Despite years of momentum, the NBA was not immune to the impacts of COVID-19 last year. However, thanks to hefty TV contracts and player salary cuts, average operating income only fell by 11.4%, from $70 million to $62 million.
The Most Valuable NBA Teams
Despite a decrease in NBA profit per team last year, team values are up 4%—from $2.1 billion in 2020 to $2.2 billion this year.
Here’s a look at the top five most valuable teams in 2021:
| Rank | Team | 2021 Valuation | 1-Year Change |
|---|---|---|---|
| 1 | New York Knicks | $5.0B | 9% |
| 2 | Golden State Warriors | $4.7B | 9% |
| 3 | Los Angeles Lakers | $4.6B | 6% |
| 4 | Chicago Bulls | $3.3B | 3% |
| 5 | Boston Celtics | $3.2B | 3% |
The Knicks took the top spot for the sixth consecutive year, but the Lakers lost their long-standing second place ranking to the Warriors. It’s the first time another team has made the top two since 1999.
» Interested in sports investing? Then you might enjoy this article Investing in the Beautiful Game of Football
Where does this data come from?
Source: Forbes
Details: Team values are measured using 4 metrics—overall sport revenue, market size, area revenue, and brand.


Datastream
Can You Calculate Your Daily Carbon Footprint?
Discover how the average person’s carbon footprint impacts the environment and learn how carbon credits can offset your carbon footprint.


The Briefing
- A person’s carbon footprint is substantial, with activities such as food consumption creating as much as 4,500 g of CO₂ emissions daily.
- By purchasing carbon credits from Carbon Streaming Corporation, you can offset your own emissions and fund positive climate action.
Your Everyday Carbon Footprint
While many large businesses and countries have committed to net-zero goals, it is essential to acknowledge that your everyday activities also contribute to global emissions.
In this graphic, sponsored by Carbon Streaming Corporation, we will explore how the choices we make and the products we use have a profound impact on our carbon footprint.
Carbon Emissions by Activity
Here are some of the daily activities and products of the average person and their carbon footprint, according to Clever Carbon.
| Household Activities & Products | CO2 Emissions (g) |
|---|---|
| 💡 Standard Light Bulb (100 watts, four hours) | 172 g |
| 📱 Mobile Phone Use (195 minutes per day)* | 189 g |
| 👕 Washing Machine (0.63 kWh) | 275 g |
| 🔥 Electric Oven (1.56 kWh) | 675 g |
| ♨️ Tumble Dryer (2.5 kWh) | 1,000 g |
| 🧻 Toilet Roll (2 ply) | 1,300 g |
| 🚿 Hot Shower (10 mins) | 2,000 g |
| 🚙 Daily Commute (one hour, by car) | 3,360 g |
| 🍽️ Average Daily Food Consumption (three meals of 600 calories) | 4,500 g |
| *Phone use based on yearly use of 69kg per the source, Reboxed | |
Your choice of transportation plays a crucial role in determining your carbon footprint. For instance, a 15 km daily commute to work on public transport generates an average of 1,464 g of CO₂ emissions. Compared to 3,360 g—twice the volume for a journey the same length by car.
By opting for more sustainable modes of transport, such as cycling, walking, or public transportation, you can significantly reduce your carbon footprint.
Addressing Your Carbon Footprint
One way to compensate for your emissions is by purchasing high-quality carbon credits.
Carbon credits are used to help fund projects that avoid, reduce or remove CO₂ emissions. This includes nature-based solutions such as reforestation and improved forest management, or technology-based solutions such as the production of biochar and carbon capture and storage (CCS).
While carbon credits offer a potential solution for individuals to help reduce global emissions, public awareness remains a significant challenge. A BCG-Patch survey revealed that only 34% of U.S. consumers are familiar with carbon credits, and only 3% have purchased them in the past.
About Carbon Streaming
By financing the creation or expansion of carbon projects, Carbon Streaming Corporation secures the rights to future carbon credits generated by these sustainable projects. You can then purchase these carbon credits to help fund climate solutions around the world and compensate for your own emissions.
Ready to get involved?
>> Learn more about purchasing carbon credits at Carbon Streaming

-

 Mining1 week ago
Gold vs. S&P 500: Which Has Grown More Over Five Years?
-

 Markets2 weeks ago
Ranked: The Most Valuable Housing Markets in America
-

 Money2 weeks ago
Which States Have the Highest Minimum Wage in America?
-

 AI2 weeks ago
Ranked: Semiconductor Companies by Industry Revenue Share
-

 Markets2 weeks ago
Ranked: The World’s Top Flight Routes, by Revenue
-

 Countries2 weeks ago
Population Projections: The World’s 6 Largest Countries in 2075
-

 Markets2 weeks ago
The Top 10 States by Real GDP Growth in 2023
-

 Demographics2 weeks ago
The Smallest Gender Wage Gaps in OECD Countries