Chart of the Week
Trump’s Relationship with the Price of Oil
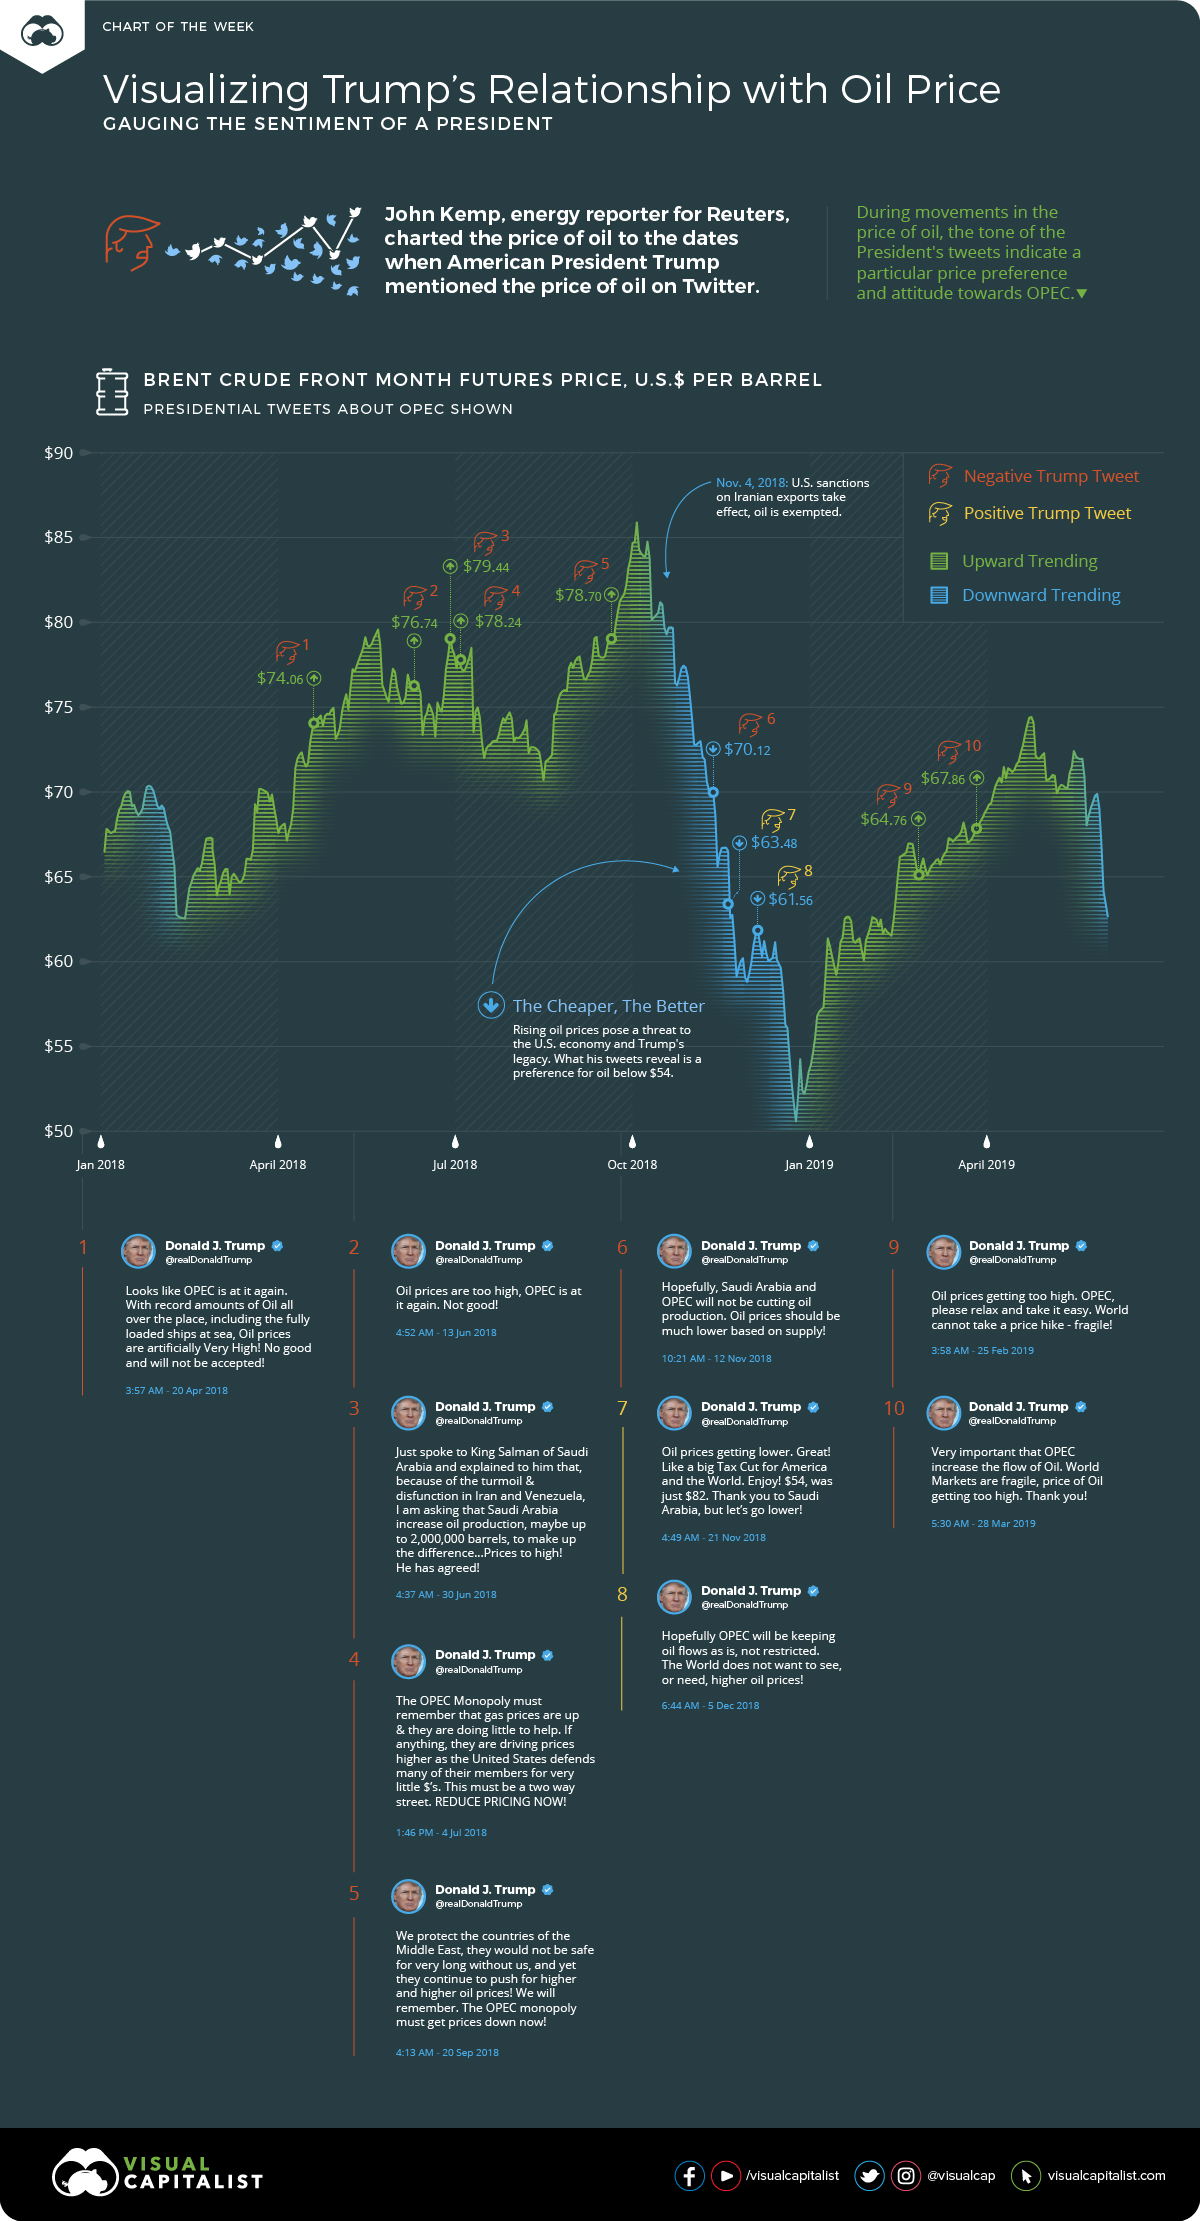
Correction: An earlier version of the graphic stated “U.S. sanctions on Iran’s oil exports take effect.” This was incorrect. On Nov. 4, 2019, U.S. sanctions on Iranian exports did take effect but Iranian oil exports were exempted from the sanctions. A new graphic has been posted with the correction. Visual Capitalist regrets the error.
Visualizing Trump’s Relationship with the Price of Oil
What goes through the head of a U.S. president?
That is a question that both voters and leaders alike would love to know the answer to. As it stands, scores of pundits and analysts already dissect everything from the choice of a tie, to whom a leader sits next to at a state dinner, to glean the potential direction of government policy.
Financial markets rely on the accurate interpretation of government policy to guide investment decisions. But what happens when you’re faced with a world leader who broadcasts his unfiltered thoughts instantaneously and globally? It’s sure to stir up international attention.
This week’s chart is inspired by work done by John Kemp, an energy reporter for Reuters. Kemp tracked all instances of U.S. President Donald Trump’s tweets mentioning oil and OPEC, against the shifting price of oil.
Where’s Your Head At?
U.S. President Donald Trump has actively worked to tie the success of his administration to the fortune of the economy and stock market.
If the economy does well, Trump hopes cheap gas at the pump will help translate into votes at the ballot box in 2020.
Oil prices getting lower. Great! Like a big Tax Cut for America and the World. Enjoy! $54, was just $82. Thank you to Saudi Arabia, but let’s go lower!
— Donald J. Trump (@realDonaldTrump) November 21, 2018
The key to keeping the economy growing is access to cheap energy, and oil is the critical commodity that’ll keep a fragile economy on the road. This is a line of thinking that can be seen throughout Trump’s tweets on the subject.
Tracking Trump’s Tweets
This week’s chart tracks President Donald Trump’s tweets from April 2018 to March 2019 that mention oil and OPEC.
Pre-Sanctions
The tweets start five months before the deadline of sanctions on Iran. During this timeframe, speculation that Trump would place sanctions on the oil-producing nation drove up the price with the prospect of a restricted supply of oil and increased tensions in the Middle East.
Despite the implications of U.S.-imposed sanctions, Trump squarely put the blame on OPEC for this period of rising oil prices. Tweets such as “OPEC is at it again. Not Good!” or “The OPEC monopoly must get price down now!” can be seen in this period.
Whether these tweets had any influence on oil producers is unclear, but they certainly outline a policy preference for cheap oil and a general animosity towards OPEC.
Post-Sanctions
On Nov. 4, 2018, Trump did impose sanctions but excluded Iranian oil exports, deflating a speculative bubble around the price of oil, and the president’s ire towards the region.
In the aftermath of sanctions, repeated news of record oil production and growing energy independence in the U.S. helped drive the price of oil back down. Though the president’s mood lightened, he still persisted in his accusations of OPEC manipulating the price.
Hopefully OPEC will be keeping oil flows as is, not restricted. The World does not want to see, or need, higher oil prices!
— Donald J. Trump (@realDonaldTrump) December 5, 2018
Prices continued to fall, plummeting to nearly $50 per barrel by the end of 2018. Cheap oil is a direct threat to the profits of OPEC nations, but higher prices can create an array of challenges for the U.S. economy.
So despite a U.S. alliance with Saudi Arabia, this is a natural tension baked into the relationship.
We protect the countries of the Middle East, they would not be safe for very long without us, and yet they continue to push for higher and higher oil prices! We will remember. The OPEC monopoly must get prices down now!
— Donald J. Trump (@realDonaldTrump) September 20, 2018
So, what would a U.S. foreign policy look like without dependence on the Middle East?
Shifting Sands
The Middle East has had a considerable influence on U.S. foreign policy since the harsh lessons of 1970s energy crisis. Multiple wars of intervention to protect Saudi oil interests—and in turn, ensuring continued American access to oil—have ravished the region and led to a state of dysfunction and constant tension.
However, with the recent declaration of American energy independence, this relationship may change with a renewed prospect for peace. Trump may work to further undermine the power of OPEC to control oil prices, as well as the Middle East’s influence on U.S. foreign policy.
American energy independence is already challenging established relationships around the world. For example, Ukraine just recently accepted its first shipment of American oil in a move to counter Russia’s influence in the region.
A New Era
Diplomacy by Twitter has yet to prove to be an effective bridge in sustaining good international relations. That said, charting the tweets of world leaders is a unique way to interpret government policy and energy economics in this new era of social media.
It seems that the next time you want to know what is going through a leader’s head, you can simply try checking their tweets.


Chart of the Week
The Road to Recovery: Which Economies are Reopening?
We look at mobility rates as well as COVID-19 recovery rates for 41 economies, to see which countries are reopening for business.

The Road to Recovery: Which Economies are Reopening?
COVID-19 has brought the world to a halt—but after months of uncertainty, it seems that the situation is slowly taking a turn for the better.
Today’s chart measures the extent to which 41 major economies are reopening, by plotting two metrics for each country: the mobility rate and the COVID-19 recovery rate:
- Mobility Index
This refers to the change in activity around workplaces, subtracting activity around residences, measured as a percentage deviation from the baseline. - COVID-19 Recovery Rate
The number of recovered cases in a country is measured as the percentage of total cases.
Data for the first measure comes from Google’s COVID-19 Community Mobility Reports, which relies on aggregated, anonymous location history data from individuals. Note that China does not show up in the graphic as the government bans Google services.
COVID-19 recovery rates rely on values from CoronaTracker, using aggregated information from multiple global and governmental databases such as WHO and CDC.
Reopening Economies, One Step at a Time
In general, the higher the mobility rate, the more economic activity this signifies. In most cases, mobility rate also correlates with a higher rate of recovered people in the population.
Here’s how these countries fare based on the above metrics.
| Country | Mobility Rate | Recovery Rate | Total Cases | Total Recovered |
|---|---|---|---|---|
| Argentina | -56% | 31.40% | 14,702 | 4,617 |
| Australia | -41% | 92.03% | 7,150 | 6,580 |
| Austria | -100% | 91.93% | 16,628 | 15,286 |
| Belgium | -105% | 26.92% | 57,849 | 15,572 |
| Brazil | -48% | 44.02% | 438,812 | 193,181 |
| Canada | -67% | 52.91% | 88,512 | 46,831 |
| Chile | -110% | 41.58% | 86,943 | 36,150 |
| Colombia | -73% | 26.28% | 25,366 | 6,665 |
| Czechia | -29% | 70.68% | 9,140 | 6,460 |
| Denmark | -93% | 88.43% | 11,512 | 10,180 |
| Finland | -93% | 81.57% | 6,743 | 5,500 |
| France | -100% | 36.08% | 186,238 | 67,191 |
| Germany | -99% | 89.45% | 182,452 | 163,200 |
| Greece | -32% | 47.28% | 2,906 | 1,374 |
| Hong Kong | -10% | 97.00% | 1,067 | 1,035 |
| Hungary | -49% | 52.31% | 3,816 | 1,996 |
| India | -65% | 42.88% | 165,386 | 70,920 |
| Indonesia | -77% | 25.43% | 24,538 | 6,240 |
| Ireland | -79% | 88.92% | 24,841 | 22,089 |
| Israel | -31% | 87.00% | 16,872 | 14,679 |
| Italy | -52% | 64.99% | 231,732 | 150,604 |
| Japan | -33% | 84.80% | 16,683 | 14,147 |
| Malaysia | -53% | 80.86% | 7,629 | 6,169 |
| Mexico | -69% | 69.70% | 78,023 | 54,383 |
| Netherlands | -97% | 0.01% | 45,950 | 3 |
| New Zealand | -21% | 98.01% | 1,504 | 1,474 |
| Norway | -100% | 91.87% | 8,411 | 7,727 |
| Philippines | -87% | 23.08% | 15,588 | 3,598 |
| Poland | -36% | 46.27% | 22,825 | 10,560 |
| Portugal | -65% | 58.99% | 31,596 | 18,637 |
| Singapore | -105% | 55.02% | 33,249 | 18,294 |
| South Africa | -74% | 52.44% | 27,403 | 14,370 |
| South Korea | -4% | 91.15% | 11,344 | 10,340 |
| Spain | -67% | 69.11% | 284,986 | 196,958 |
| Sweden | -93% | 13.91% | 35,727 | 4,971 |
| Switzerland | -101% | 91.90% | 30,796 | 28,300 |
| Taiwan | 4% | 95.24% | 441 | 420 |
| Thailand | -36% | 96.08% | 3,065 | 2,945 |
| U.S. | -56% | 28.20% | 1,768,346 | 498,720 |
| United Kingdom | -82% | 0.05% | 269,127 | 135 |
| Vietnam | 15% | 85.02% | 327 | 278 |
Mobility data as of May 21, 2020 (Latest available). COVID-19 case data as of May 29, 2020.
In the main scatterplot visualization, we’ve taken things a step further, assigning these countries into four distinct quadrants:
1. High Mobility, High Recovery
High recovery rates are resulting in lifted restrictions for countries in this quadrant, and people are steadily returning to work.
New Zealand has earned praise for its early and effective pandemic response, allowing it to curtail the total number of cases. This has resulted in a 98% recovery rate, the highest of all countries. After almost 50 days of lockdown, the government is recommending a flexible four-day work week to boost the economy back up.
2. High Mobility, Low Recovery
Despite low COVID-19 related recoveries, mobility rates of countries in this quadrant remain higher than average. Some countries have loosened lockdown measures, while others did not have strict measures in place to begin with.
Brazil is an interesting case study to consider here. After deferring lockdown decisions to state and local levels, the country is now averaging the highest number of daily cases out of any country. On May 28th, for example, the country had 24,151 new cases and 1,067 new deaths.
3. Low Mobility, High Recovery
Countries in this quadrant are playing it safe, and holding off on reopening their economies until the population has fully recovered.
Italy, the once-epicenter for the crisis in Europe is understandably wary of cases rising back up to critical levels. As a result, it has opted to keep its activity to a minimum to try and boost the 65% recovery rate, even as it slowly emerges from over 10 weeks of lockdown.
4. Low Mobility, Low Recovery
Last but not least, people in these countries are cautiously remaining indoors as their governments continue to work on crisis response.
With a low 0.05% recovery rate, the United Kingdom has no immediate plans to reopen. A two-week lag time in reporting discharged patients from NHS services may also be contributing to this low number. Although new cases are leveling off, the country has the highest coronavirus-caused death toll across Europe.
The U.S. also sits in this quadrant with over 1.7 million cases and counting. Recently, some states have opted to ease restrictions on social and business activity, which could potentially result in case numbers climbing back up.
Over in Sweden, a controversial herd immunity strategy meant that the country continued business as usual amid the rest of Europe’s heightened regulations. Sweden’s COVID-19 recovery rate sits at only 13.9%, and the country’s -93% mobility rate implies that people have been taking their own precautions.
COVID-19’s Impact on the Future
It’s important to note that a “second wave” of new cases could upend plans to reopen economies. As countries reckon with these competing risks of health and economic activity, there is no clear answer around the right path to take.
COVID-19 is a catalyst for an entirely different future, but interestingly, it’s one that has been in the works for a while.
Without being melodramatic, COVID-19 is like the last nail in the coffin of globalization…The 2008-2009 crisis gave globalization a big hit, as did Brexit, as did the U.S.-China trade war, but COVID is taking it to a new level.
—Carmen Reinhart, incoming Chief Economist for the World Bank
Will there be any chance of returning to “normal” as we know it?

-

 Markets1 week ago
U.S. Debt Interest Payments Reach $1 Trillion
-

 Markets2 weeks ago
Ranked: The Most Valuable Housing Markets in America
-

 Money2 weeks ago
Which States Have the Highest Minimum Wage in America?
-

 AI2 weeks ago
Ranked: Semiconductor Companies by Industry Revenue Share
-

 Markets2 weeks ago
Ranked: The World’s Top Flight Routes, by Revenue
-

 Countries2 weeks ago
Population Projections: The World’s 6 Largest Countries in 2075
-

 Markets2 weeks ago
The Top 10 States by Real GDP Growth in 2023
-

 Money2 weeks ago
The Smallest Gender Wage Gaps in OECD Countries