Markets
The Troubling Trajectory of Hyperinflation in Venezuela
Presented by: 

The Troubling Trajectory of Hyperinflation in Venezuela
The Money Project is an ongoing collaboration between Visual Capitalist and Texas Precious Metals that seeks to use intuitive visualizations to explore the origins, nature, and use of money.
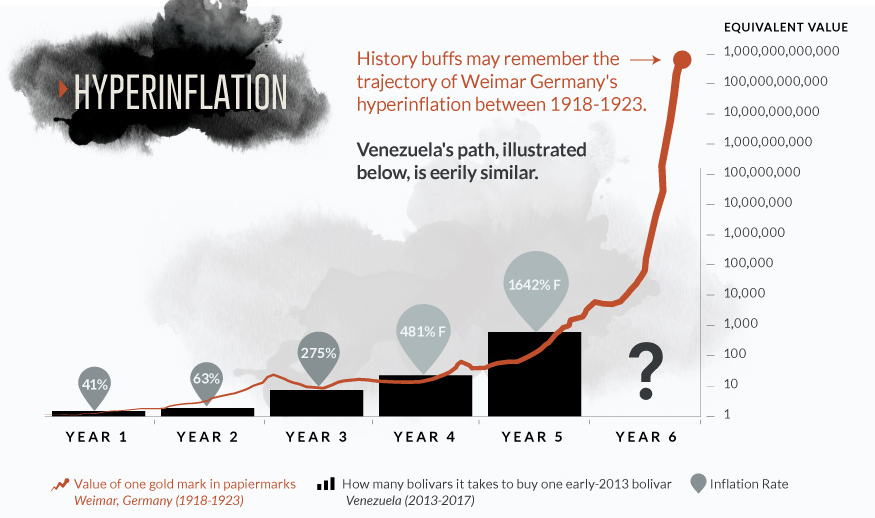
Extreme shortages of food and power continue to ravage the country of Venezuela, and ordinary people have been paying the price.
With triple-digit inflation, that “price” is expected to continue to soar even higher. The International Monetary Fund (IMF), in its most recent set April forecasts, expects inflation in Venezuela to hit 481% by the end of 2016.
Even scarier is the estimated pace of acceleration – by 2017, the IMF expects Venezuelan hyperinflation to climb to a whopping 1,642%.
Our brains have trouble computing numbers of this magnitude, so we created today’s infographic to put things in perspective. We look at it from two angles, including a historical comparison as well as a more tangible example.
This Pattern Looks Familiar…
If the chart for the Venezuelan bolivar looks eerily familiar, it may be because its trajectory thus far is almost identical to that of the Papiermark during hyperinflation in the Weimar Republic from 1918-1923.
Although the Papiermark would eventually peak at an inflation rate of 3.5 billion percent in 1923, the pace of inflation started relatively modestly. It started in the double-digits after the war in 1918.
This is similar to today’s bolivar. In 2013 and 2014, the pace of inflation in Venezuela was increasing, but still confined to double-digits. Now things are accelerating fast, and if the IMF is correct with its predictions, there could be huge consequences.
Could hyperinflation in Venezuela ever hit the peak levels associated with Weimar Germany? It’s hard to say, but it’s not impossible.
A More Tangible Example
To put things from a more tangible perspective, let’s do the math based on IMF projections to see what may be in store for ordinary Venezuelans.
- In 2012, one U.S. dollar could buy approximately four bolivars.
- At the end of 2015, one U.S. dollar could buy 900 bolivars at the black market rate.
- Based on IMF projected inflation rates, by the end of 2017, one U.S. dollar should be able to buy 90,000 bolivars.
Where things go after that is anybody’s guess.
About the Money Project
The Money Project aims to use intuitive visualizations to explore ideas around the very concept of money itself. Founded in 2015 by Visual Capitalist and Texas Precious Metals, the Money Project will look at the evolving nature of money, and will try to answer the difficult questions that prevent us from truly understanding the role that money plays in finance, investments, and accumulating wealth.


Markets
U.S. Debt Interest Payments Reach $1 Trillion
U.S. debt interest payments have surged past the $1 trillion dollar mark, amid high interest rates and an ever-expanding debt burden.


U.S. Debt Interest Payments Reach $1 Trillion
This was originally posted on our Voronoi app. Download the app for free on iOS or Android and discover incredible data-driven charts from a variety of trusted sources.
The cost of paying for America’s national debt crossed the $1 trillion dollar mark in 2023, driven by high interest rates and a record $34 trillion mountain of debt.
Over the last decade, U.S. debt interest payments have more than doubled amid vast government spending during the pandemic crisis. As debt payments continue to soar, the Congressional Budget Office (CBO) reported that debt servicing costs surpassed defense spending for the first time ever this year.
This graphic shows the sharp rise in U.S. debt payments, based on data from the Federal Reserve.
A $1 Trillion Interest Bill, and Growing
Below, we show how U.S. debt interest payments have risen at a faster pace than at another time in modern history:
| Date | Interest Payments | U.S. National Debt |
|---|---|---|
| 2023 | $1.0T | $34.0T |
| 2022 | $830B | $31.4T |
| 2021 | $612B | $29.6T |
| 2020 | $518B | $27.7T |
| 2019 | $564B | $23.2T |
| 2018 | $571B | $22.0T |
| 2017 | $493B | $20.5T |
| 2016 | $460B | $20.0T |
| 2015 | $435B | $18.9T |
| 2014 | $442B | $18.1T |
| 2013 | $425B | $17.2T |
| 2012 | $417B | $16.4T |
| 2011 | $433B | $15.2T |
| 2010 | $400B | $14.0T |
| 2009 | $354B | $12.3T |
| 2008 | $380B | $10.7T |
| 2007 | $414B | $9.2T |
| 2006 | $387B | $8.7T |
| 2005 | $355B | $8.2T |
| 2004 | $318B | $7.6T |
| 2003 | $294B | $7.0T |
| 2002 | $298B | $6.4T |
| 2001 | $318B | $5.9T |
| 2000 | $353B | $5.7T |
| 1999 | $353B | $5.8T |
| 1998 | $360B | $5.6T |
| 1997 | $368B | $5.5T |
| 1996 | $362B | $5.3T |
| 1995 | $357B | $5.0T |
| 1994 | $334B | $4.8T |
| 1993 | $311B | $4.5T |
| 1992 | $306B | $4.2T |
| 1991 | $308B | $3.8T |
| 1990 | $298B | $3.4T |
| 1989 | $275B | $3.0T |
| 1988 | $254B | $2.7T |
| 1987 | $240B | $2.4T |
| 1986 | $225B | $2.2T |
| 1985 | $219B | $1.9T |
| 1984 | $205B | $1.7T |
| 1983 | $176B | $1.4T |
| 1982 | $157B | $1.2T |
| 1981 | $142B | $1.0T |
| 1980 | $113B | $930.2B |
| 1979 | $96B | $845.1B |
| 1978 | $84B | $789.2B |
| 1977 | $69B | $718.9B |
| 1976 | $61B | $653.5B |
| 1975 | $55B | $576.6B |
| 1974 | $50B | $492.7B |
| 1973 | $45B | $469.1B |
| 1972 | $39B | $448.5B |
| 1971 | $36B | $424.1B |
| 1970 | $35B | $389.2B |
| 1969 | $30B | $368.2B |
| 1968 | $25B | $358.0B |
| 1967 | $23B | $344.7B |
| 1966 | $21B | $329.3B |
Interest payments represent seasonally adjusted annual rate at the end of Q4.
At current rates, the U.S. national debt is growing by a remarkable $1 trillion about every 100 days, equal to roughly $3.6 trillion per year.
As the national debt has ballooned, debt payments even exceeded Medicaid outlays in 2023—one of the government’s largest expenditures. On average, the U.S. spent more than $2 billion per day on interest costs last year. Going further, the U.S. government is projected to spend a historic $12.4 trillion on interest payments over the next decade, averaging about $37,100 per American.
Exacerbating matters is that the U.S. is running a steep deficit, which stood at $1.1 trillion for the first six months of fiscal 2024. This has accelerated due to the 43% increase in debt servicing costs along with a $31 billion dollar increase in defense spending from a year earlier. Additionally, a $30 billion increase in funding for the Federal Deposit Insurance Corporation in light of the regional banking crisis last year was a major contributor to the deficit increase.
Overall, the CBO forecasts that roughly 75% of the federal deficit’s increase will be due to interest costs by 2034.

-

 Misc2 weeks ago
Tesla Is Once Again the World’s Best-Selling EV Company
-

 AI1 week ago
The Stock Performance of U.S. Chipmakers So Far in 2024
-

 Misc1 week ago
Almost Every EV Stock is Down After Q1 2024
-

 Money2 weeks ago
Where Does One U.S. Tax Dollar Go?
-

 Green2 weeks ago
Ranked: Top Countries by Total Forest Loss Since 2001
-

 Real Estate2 weeks ago
Visualizing America’s Shortage of Affordable Homes
-

 Maps2 weeks ago
Mapped: Average Wages Across Europe
-

 Mining2 weeks ago
Charted: The Value Gap Between the Gold Price and Gold Miners